Limitations & Known Issues
- Question: I conduct a round-trip testing for model merging and partition. Basically I merge different data groups into a single model and then partition it into different data groups. Model Comparison shows some difference between original data groups and the partitioned data groups.
Answer: Like many other reverse-engineering processes, this difference is inevitable due to the underlying model merging methodologies. See Partition of a Merged Model for more details. It is expected that the partitioned model is mainly used as a starting point. Further refinement may be needed to make the partitioned model to be useful.
- Question: Is Google Map supported?
Answer: NO.
- Question: The model comparison report doesn’t show all of the differences between two compared models.
Answer: This is a designed behavior. The Tool identifies the first 1,000,000 modeling differences and stops further comparison. If you are trying to compare two large reality-based modes that are not comparable, the generated difference model may exhaust the memory and result in significant performance degrading. Therefore, the Tool limits the maximum number of reported differences to 1,000,000. But you can always change this setting.
- Question: My Substation Diagram is quite messy. It is difficult to see the network connectivity.
Answer: This is possible when the substation configuration is complicated or special. The Tool relies on pattern recognition methodology for diagram layout. For a complicated or special substation configuration, a ‘matched’ pattern may not be found. In that case, the Tool uses a default algorithm to layout the diagram, and the resulting layout may not be satisfactory. It is expected when more layout patterns are recognized and supported, the quality of the substation diagram will be enhanced. Realizing this limitation, Simplified Diagram is provided to enhance the clarity of the diagram layout. In general, you should use the Simplified Diagram to understand the overall Substation configuration and Detailed Diagram for more details about a specific equipment or bus connection.
- Question: Some of the validation errors/warnings don’t make sense. How can I verify these reported incidences?
Answer: The first step recommended is to check the governing profiles. The validation function generally follows the governing CIM profiles, even there are mistakes in them. This is whole idea of standard compliance. The Tool packages come with CPSM profile documents under the Doc\CPSM folder. For ENTSO-E profile documents, please contact ENTSO-E for the information. Please note that some of the modeling restrictions are not formally documented in these profile documents for some reasons. For example, some profile documents specify attribute IdentifiedObject.name as ‘required’ or ‘optional’ for all of the classes involved. This is not true. In reality, this attribute is ‘required’ for some classes and ‘optional’ for others. Because of some reasons (either the profiling tool limitation or problem of profiling methodology used), this attribute must be specified as either ‘required’ or ‘optional’ for all of the classes involved. Some profile documents add notes to describe these issues, while others don’t. In general, the modeling restrictions and validation rules used in the Tool have been tested during InterOP (IOP). Please also note that many of validation logics, particularly the rule-based validation logics are not described in these profile documents. These validation logics are based on ‘common sense’. For example, a RegulatingControl should not be set to regulate a 110 kV bus to the target voltage of 69 kV.
Certainly, there are always cases where misinterpretation of profiles and software bugs result in false alarms or failure to identify the model errors. In this case, please report these issues so that they can be addressed in the future version of the Tool. If this is a fatal error that requires immediate fixing, a patch will be released.
- Question: The power flow shown in the diagram doesn’t appear to be accurate. Is this an approximation?
Answer: Kind of. If the loaded model contains the power flow information, the Tool respect it and show flow as it is. If the loaded model contains only the basic state variables, i.e. voltages, the Tool will calculate the flow for each branch. The flow for the tapped transformers is approximated and may not be accurate. Once we know how to calculate the flow for transformers with tap ratio or phasor shifters, we will fix the issue.
- Question: Does the Tool support 1-to-many or many-to-many associations?
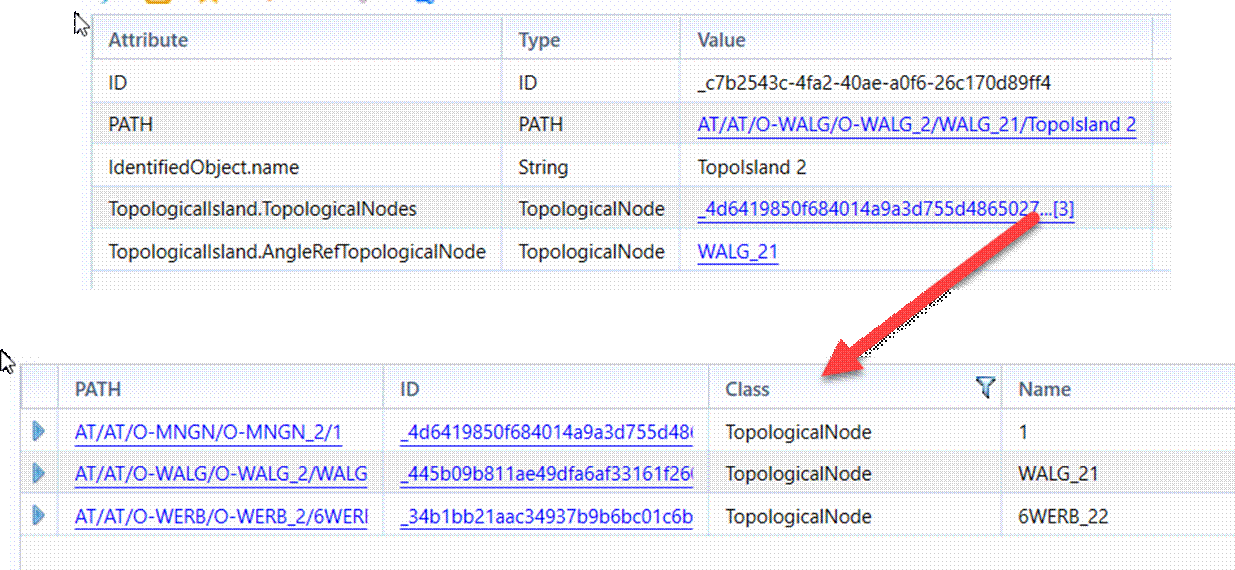
Answer: Kind of. Users can import/export models with 1-to-many or many-to-many associations. But the Tool doesn’t enable users to edit them. Additionally, the associated objects are displayed in a separate display when users click the link, as illustrated below.
- Question: How to print displays? It appears that this function has been removed in the desktop version of the Tool.
Answer: Yes, it was removed. We try to encourage you to be environment-friendly by removing this function. If you really need print displays, they can be exported as different printable formats including, CSV, HTM, Excel, SVG, and PNG.
- Question: Why does the selected color theme not apply to Diagram Displays?
Answer: This is because Diagram Display is a plug-in component from a different product called grid-IE. It contains its own color options.
- Question: There is a performance issue. It takes long time to display a large geographical diagram or an imported standard diagram.
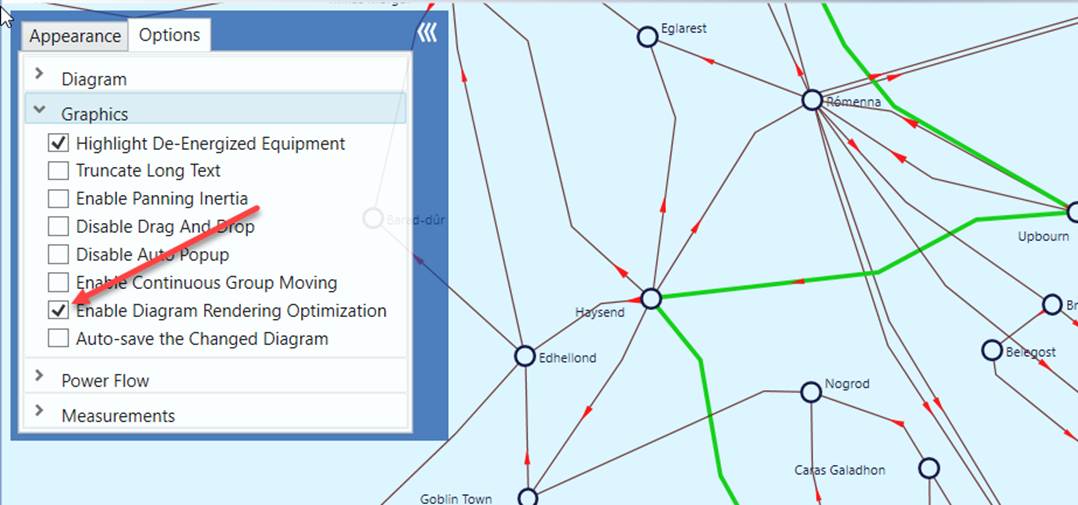
Answer: Yes, this is a known issue due to the limitation of .NET graphical support. You can mitigate this issue by enabling diagram rendering optimization as illustrated below. When this option is enabled, some of the time-consuming graphical components, such as power flow animation, measurements, etc., will not be displayed for large diagrams. The ultimatum solution, however, is to support diagram virtualization in the future release.
- Question: The Tool doesn’t load large zip file. Is there any workaround?
Answer: Yes. This is a known issue. If the original file size is more than 2 GB, some zipping applications, including Windows, will create a zip file using compression method, which is a proprietary algorithm not supported by the 3rd-party library (zlib) used in the Tool. To work around this issue:
- Unzip this file using Windows or other tools;
- Load the unzipped file into the Tool;
- Export the loaded model into a zip file from the Tool.
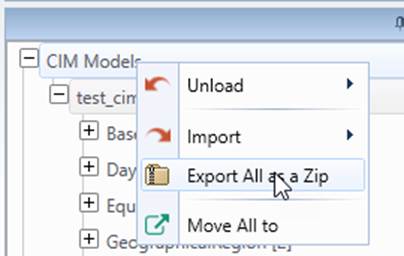
- The Tool shall be able to load the new zip file created by the Tool.
- Question: Unable to unzip/zip files in some cases. Why?
Answer: If your original file name is too long or contains non-ASCII characters, you may not be able to load the ZIP file, depending on your Windows settings. Similarly, if your model’s name is too long or includes non-ASCII characters, exporting a ZIP file from the Tool may fail. Renaming the model files or model names to shorter, ASCII-compliant names should resolve the issue.