Personalizing Diagram Look-and-Feel
Diagram look-and-feel is quite personal. Users have their own preferences regarding how the diagrams shall be laid out, connected, etc. The Tool provides various options, enabling users to set their own preferences and adjust them as necessary. This article uses screenshots to demonstrate how users can set these preferences.
Line Connection
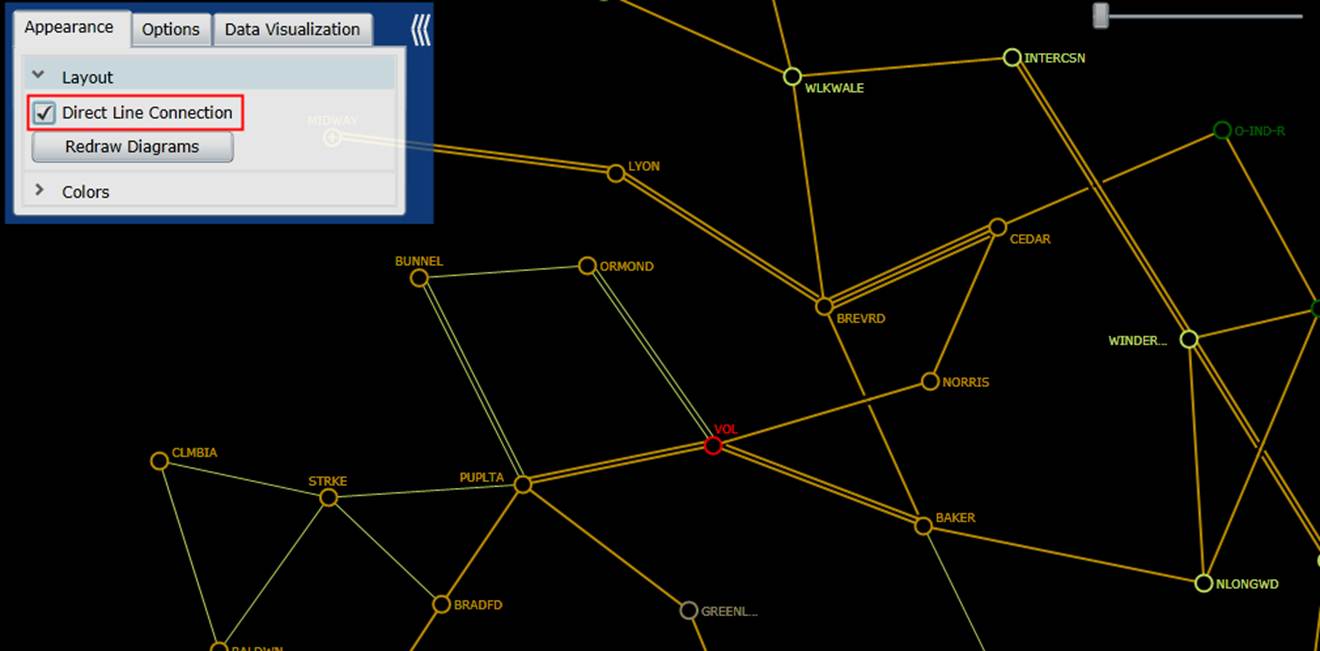
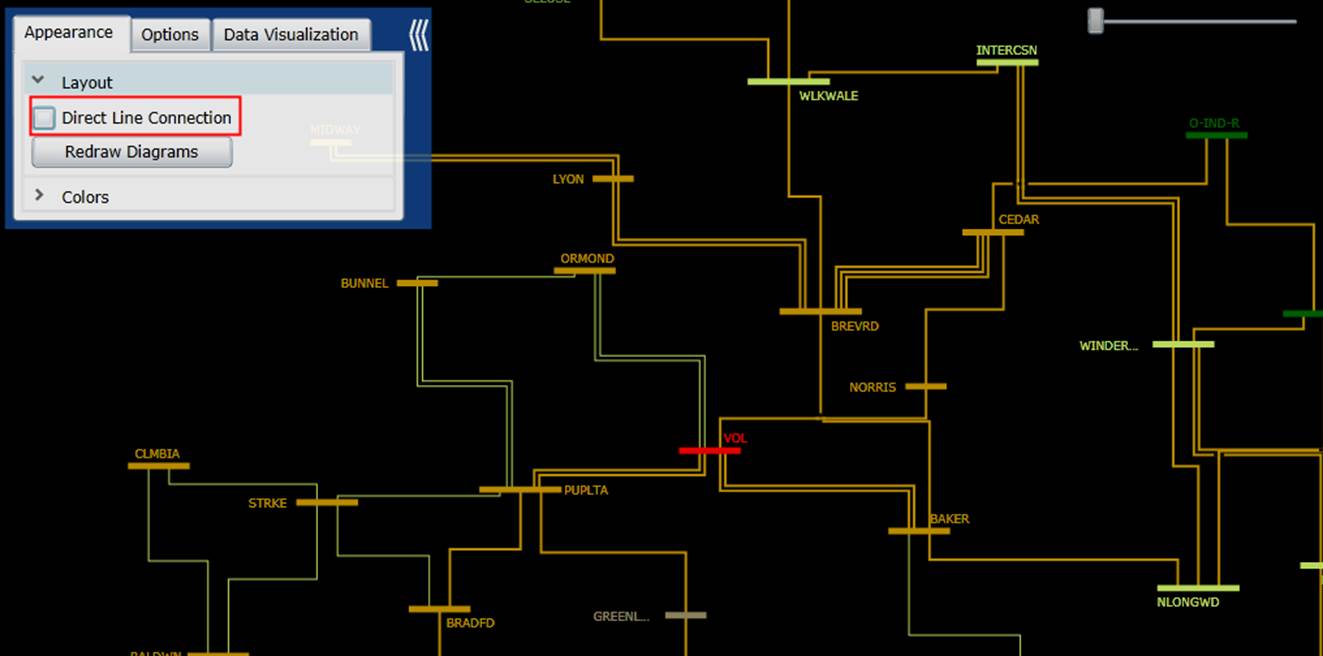
For the layout of the Neighborhood Diagram, users have the option to decide whether the substations shall be directly connected or vertically/horizontally connected. Different users have different favors. The Tool let users to make their own decisions. The following two screenshots compare a directly-connected Neighborhood Diagram with the corresponding vertically/horizontally connected Neighborhood Diagram.
Line Crossing
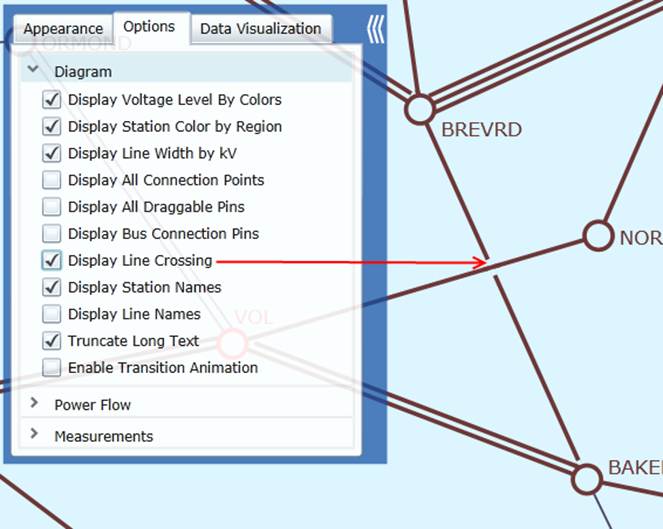
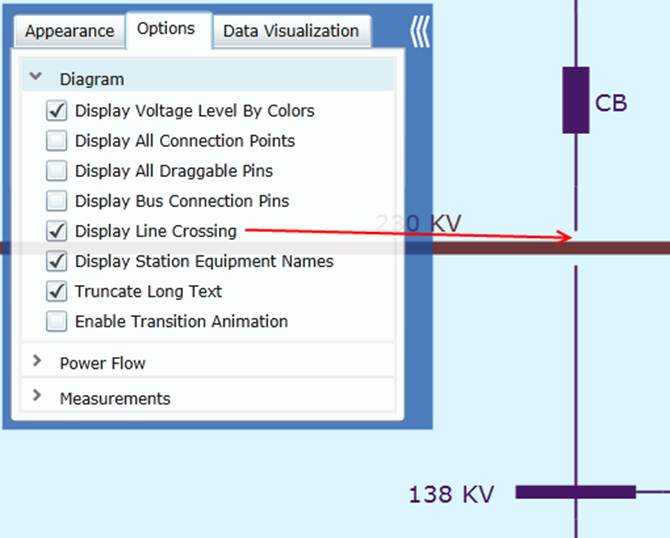
Line crossing is inevitable in some cases. It happens in both substation diagram and neighborhood diagram. When the “Display Line Crossing” option is enabled, a small gap is added for one of the crossing lines, reminding users that the lines/buses are not connected. In many cases, this option enhances the clarity of the diagram. The following two screenshots illustrate the crossing lines in Substation Diagram and Neighborhood Diagram respectively.
Connection Point
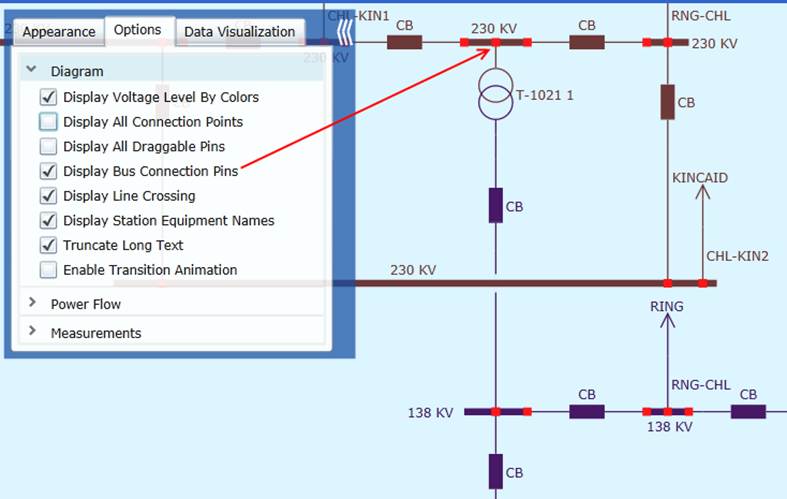
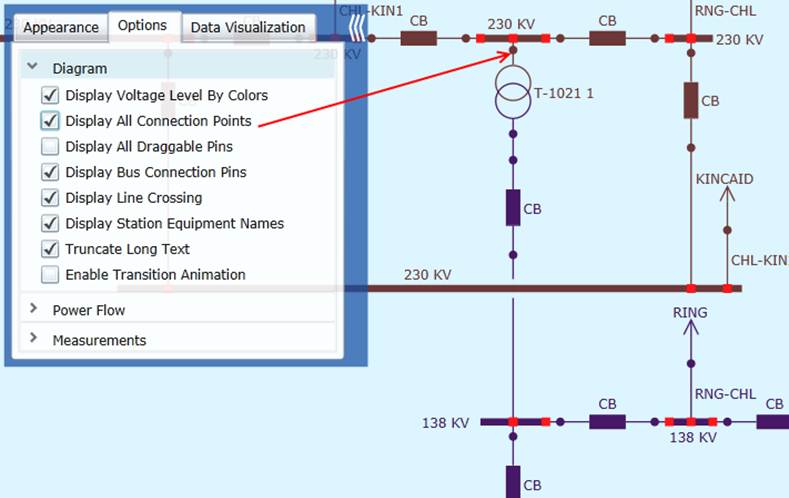
Displaying connection points is another way to help users understand the network connectivity. Users can choose to display the bus connection only or all of the connection points. The following two screenshots show the difference between two options.
Resolution
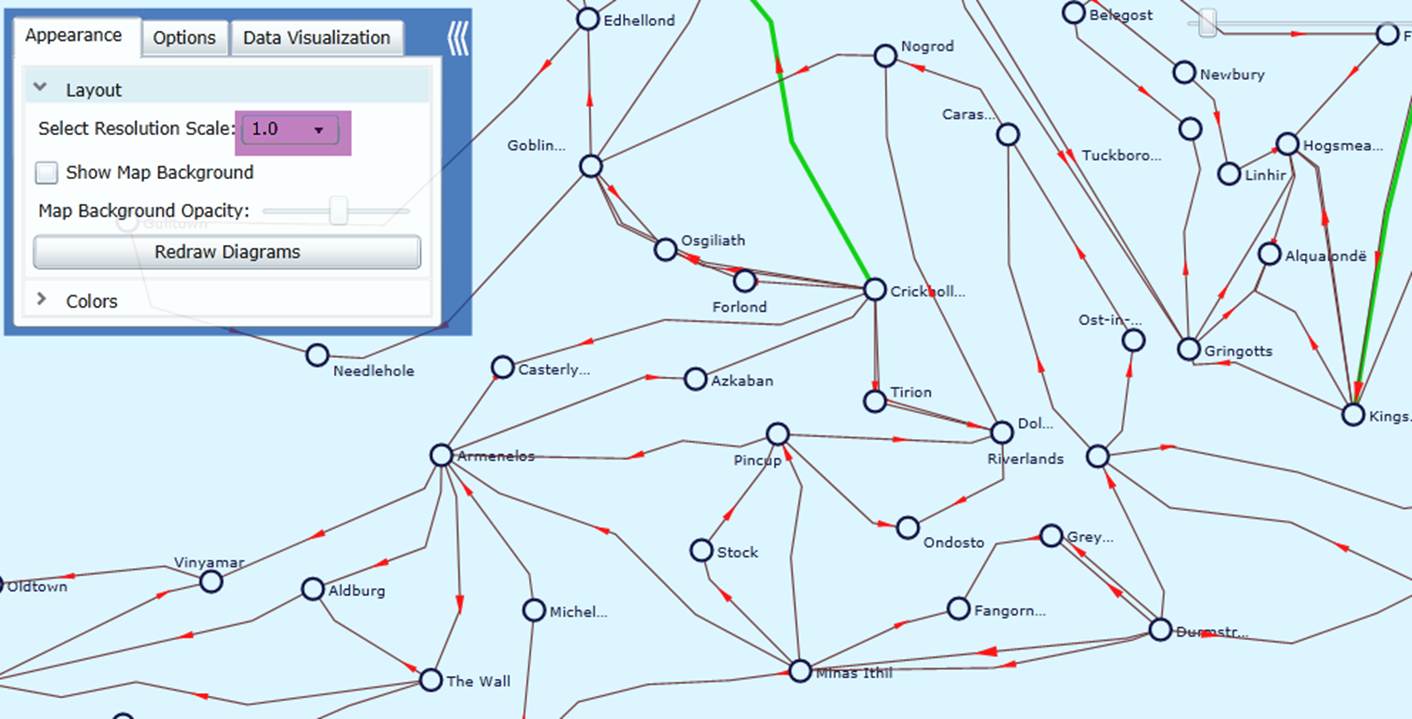
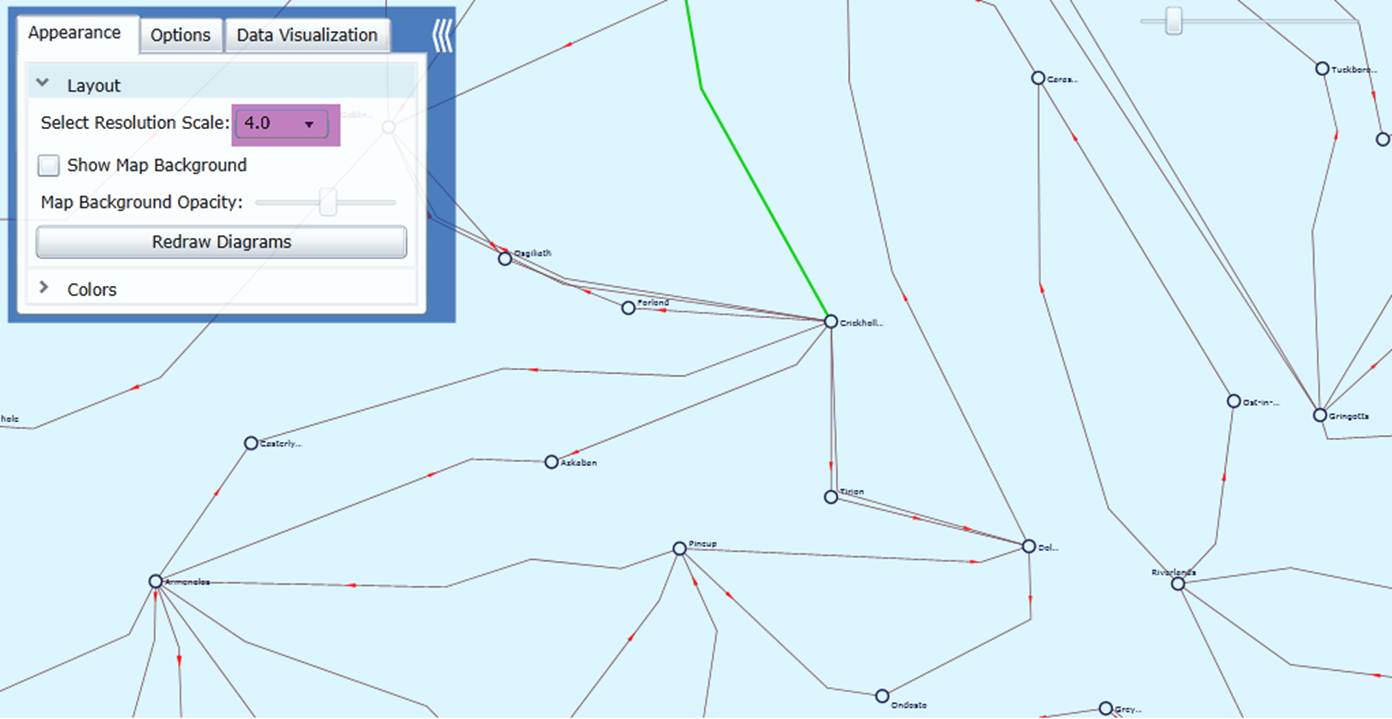
Layout of the geographical diagram is quite model-dependent. If the substations are located in small geographical area, the generated geographical diagram may not be very clear due to the overlapping of graphical symbols. In that case, users can adjust the Resolution Scale, as illustrated below. An increased resolution scale will spread the geographical diagram by using small graphical symbols. During zoom in/out, the graphical symbols and the connections will be dynamically adjusted to maintain the same size, thus resulting in fine resolutions. The 2nd diagram shows a fine-resolution counterpart of the 1st diagram after the resolution scale is raised from 1.0 to 4.0.
Map Opacity
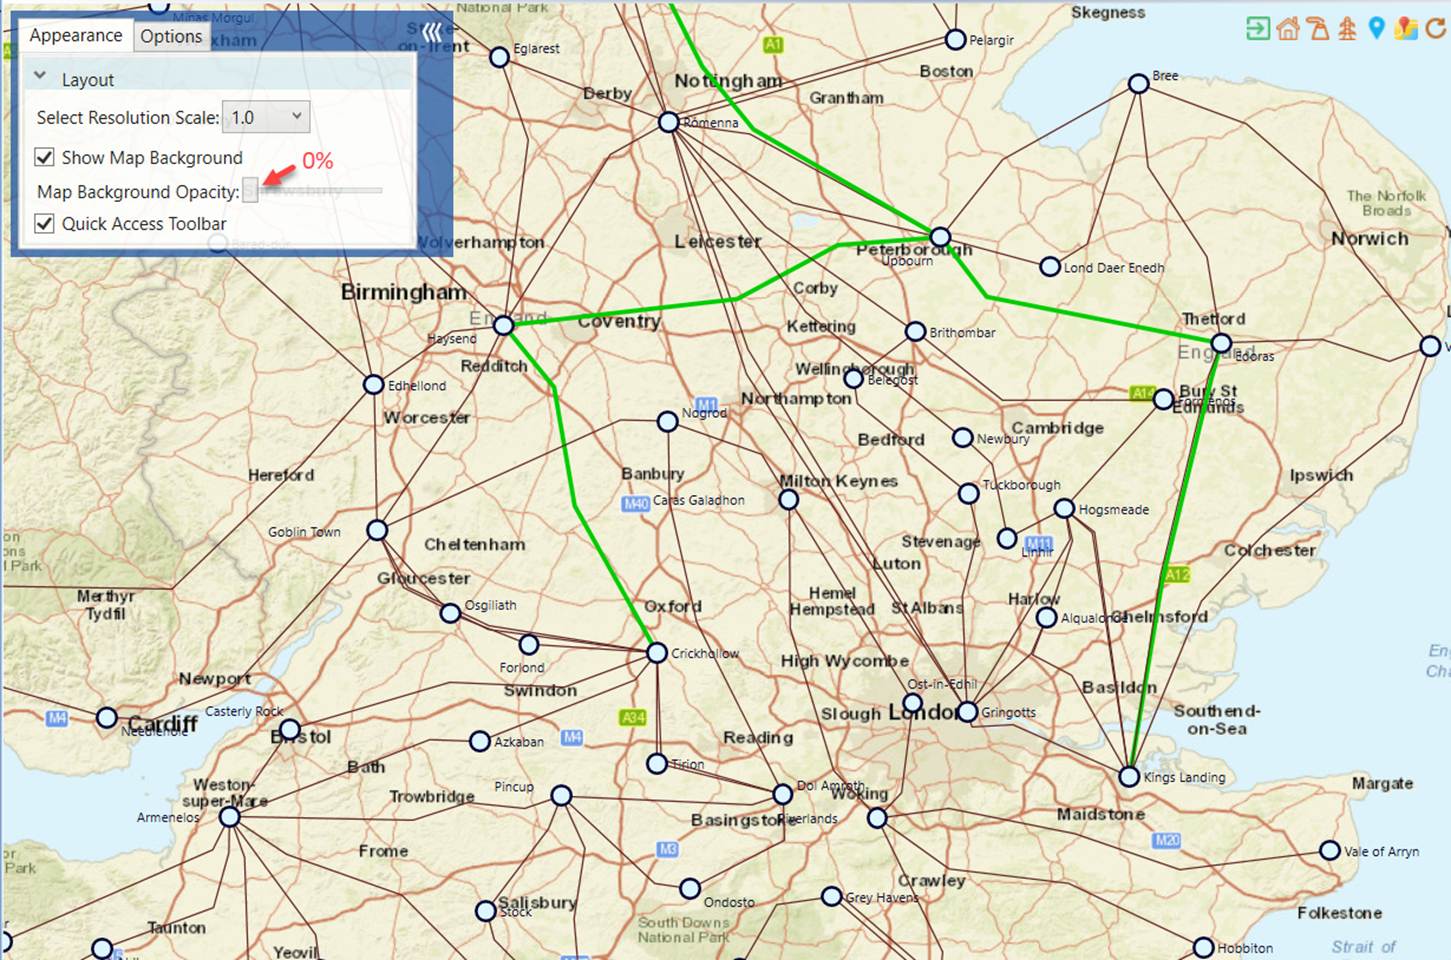
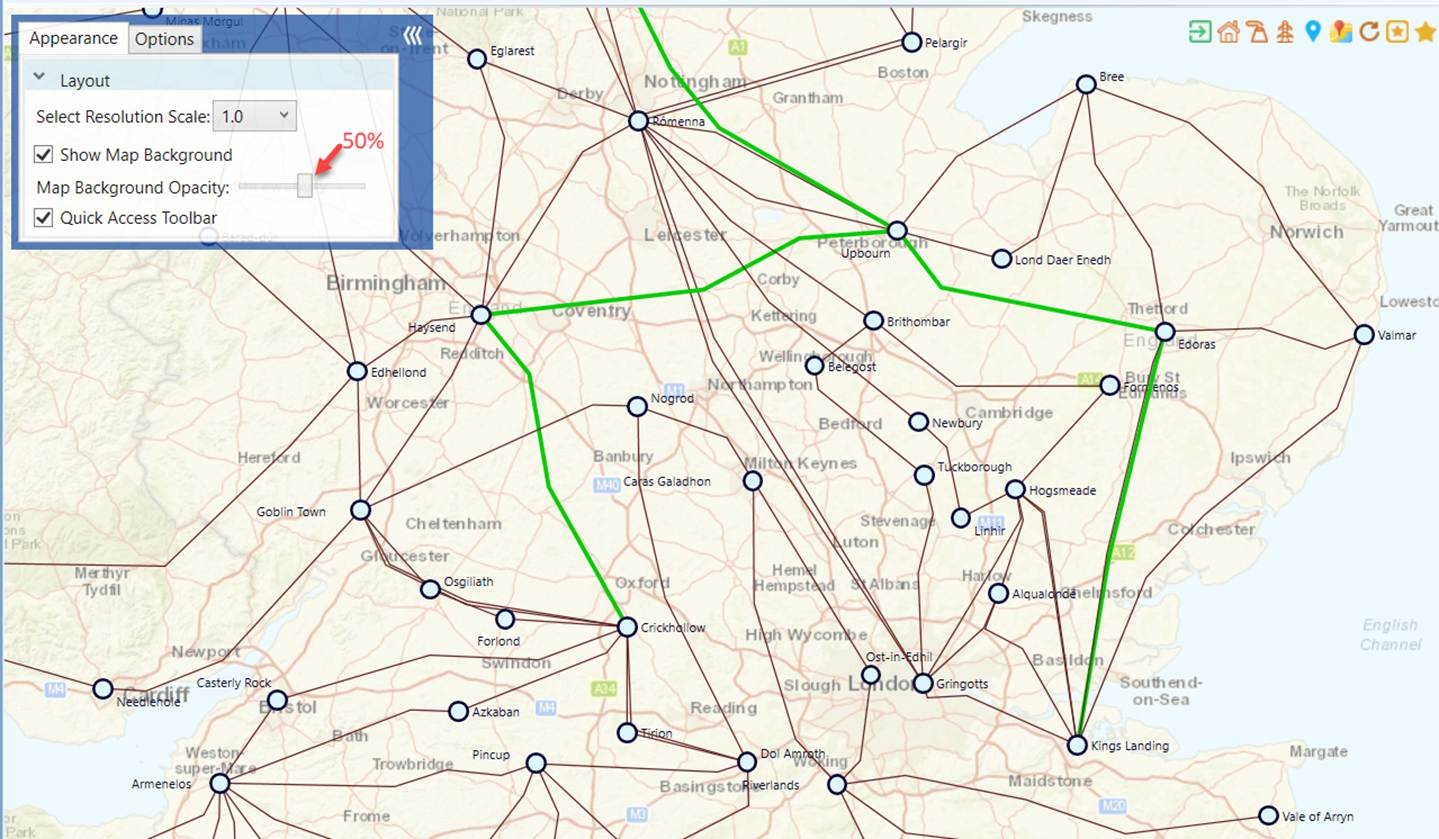
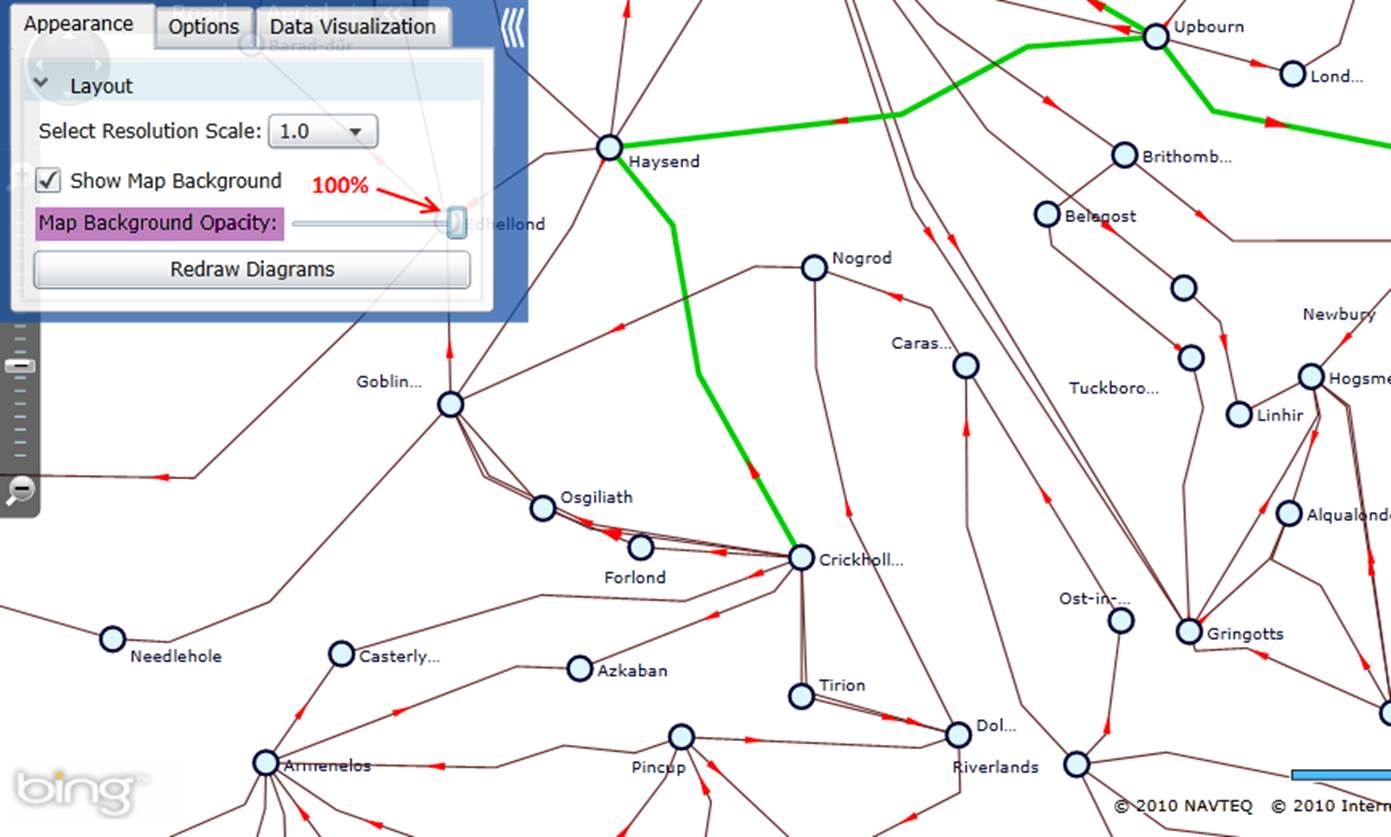
Map background can be noisy at times, especially containing lines and shapes similar to diagram components. An opacity mask slider can be used to completely show or hide the map background, or anywhere in between. The following screenshots demonstrate how map background can be faded when the opacity adjusted from 0 to 100%.
Map background can be noisy at times, especially containing lines and shapes similar to diagram components. An opacity mask slider can be used to completely show or hide the map background, or anywhere in between. The following screenshots demonstrate how map background can be faded when the opacity adjusted from 0 to 100%.
Drag and Drop
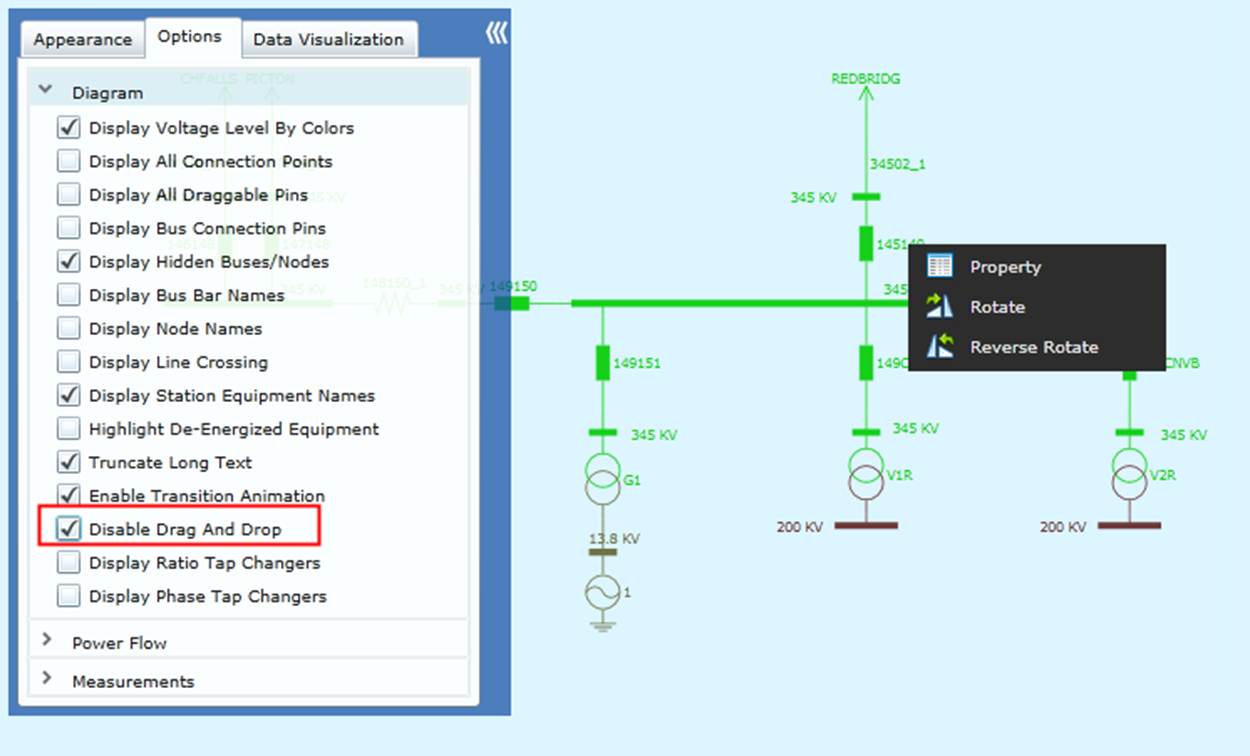
Diagram objects can be dragged and dropped to provide users a customized view. However, if a diagram is for viewing only, accidental dragging and dropping may cause some inconveniences. To avoid it, users can check “Disable Drag and Drop” in Options. By doing it, the diagram is “fixed”, but other mouse actions such as double click, mouse-over, and right click for context menu remain functional.