Auto Play
Overview of Auto Play
Auto Play is an automation feature that enables users to invoke a process automatically calling/saving a Substation Diagram and Line Diagram every a few seconds. This feature allows users to generate all of the Substation Diagrams/Line Diagram system-wide or for a specified region with one-mouse clicking. The Auto Play feature is designed to support a use case where Substation/Line one-line are auto-generated and maintained in the Tool and then exported as SVG consumable by other tools or systems. The supported use case typically consists of the following sequential steps:
- Load CIM-based model into the Tool and run the corresponding auto-play function to generate a diagram for each station. The generated diagrams will be saved in the CIM format.
- Users manually adjust the layout of some diagrams for better clarity and look-and-feel and save these changes in the same CIM format.
- Run the SVG export application in auto-play mode to generate a SVG file for each saved CIM-base Substation Diagram or Line Diagram.
- Publish the converted SVG files to the production environment after testing.
- When a new version of model becomes available, the CIM-based diagrams will be merged with the new model through model assembling and partition function of the Tool.
- Run the inconsistency detection application. The Tool will alert users for any inconsistency between the existing diagrams and the new models.
- Users call each of the discovered diagrams to visualize and verify ‘diagram fixing’ and adjust the fixed diagrams as needed. Repeat step 3 and republish the updated diagrams to the production environment.
Auto-Generation of Substation/Line Diagrams in Bulk
Substation Diagrams and Line Diagrams can be auto-generated through auto-play function. To generate a one-line diagrams for each Substation/ACLineSegment in the model:
- Load the model into the Tool.
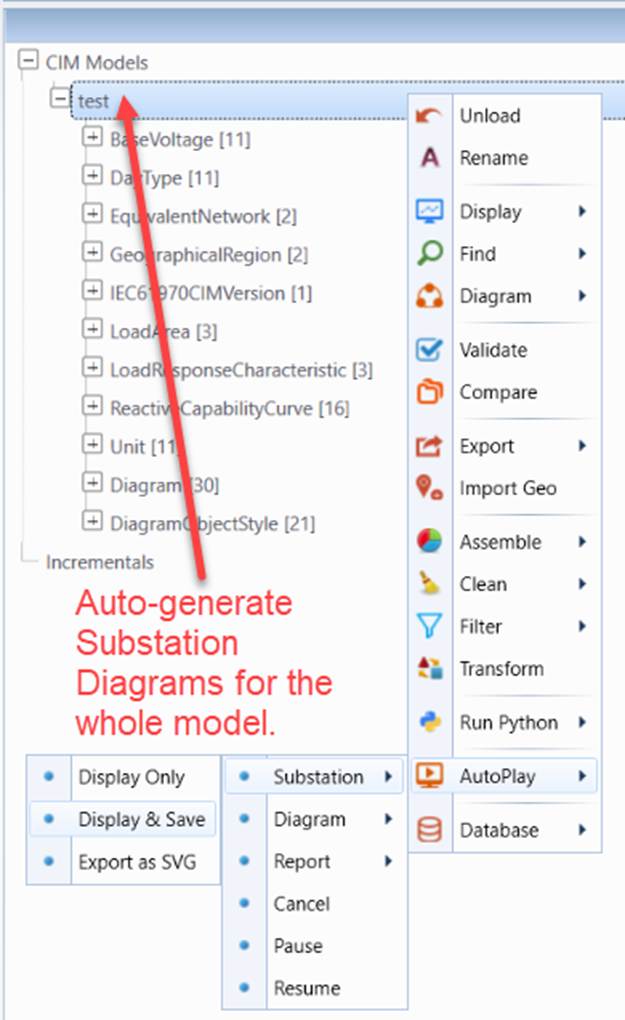
- Right-mouse click the tree item associated with the loaded model to invoke a context menu.
- Invoke Substation/Line one-line auto-generation by selecting context menu item AutoPlay→Substation (or Line)→Display & Save.
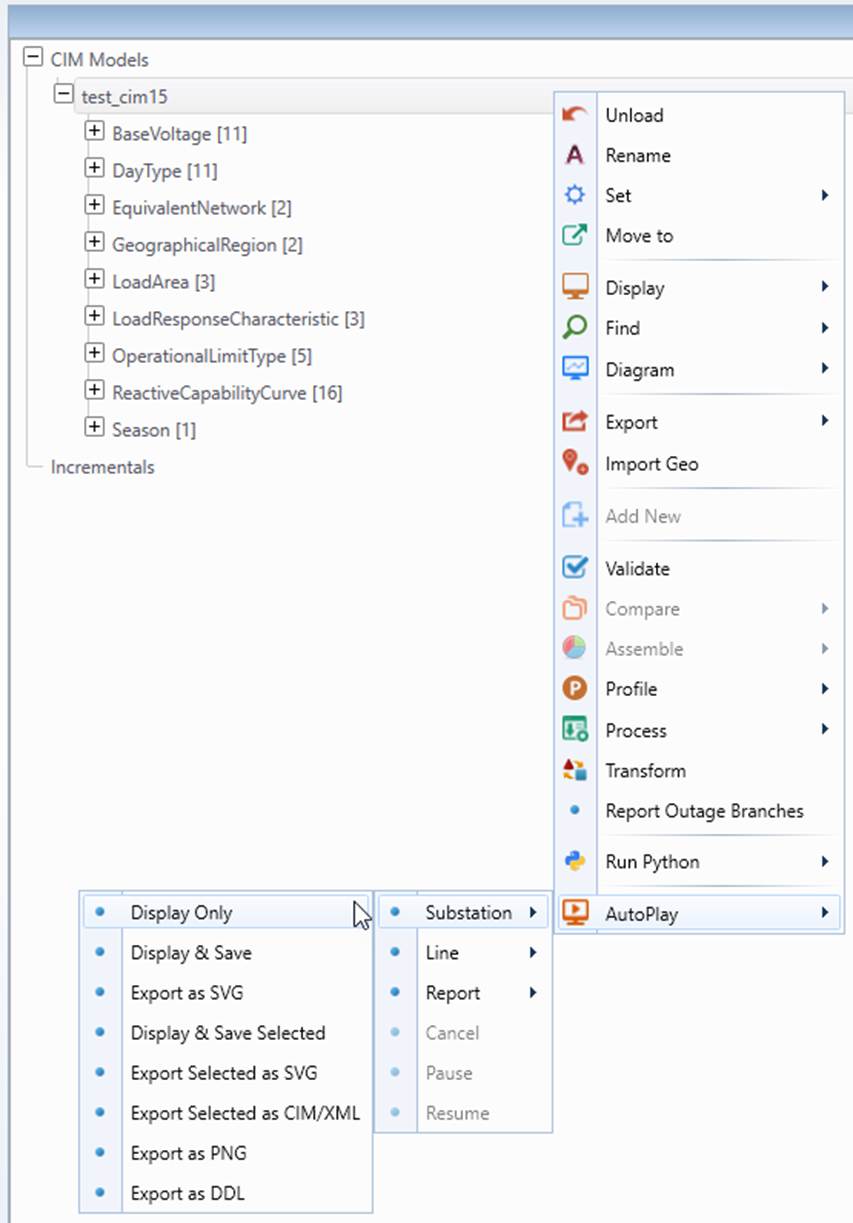
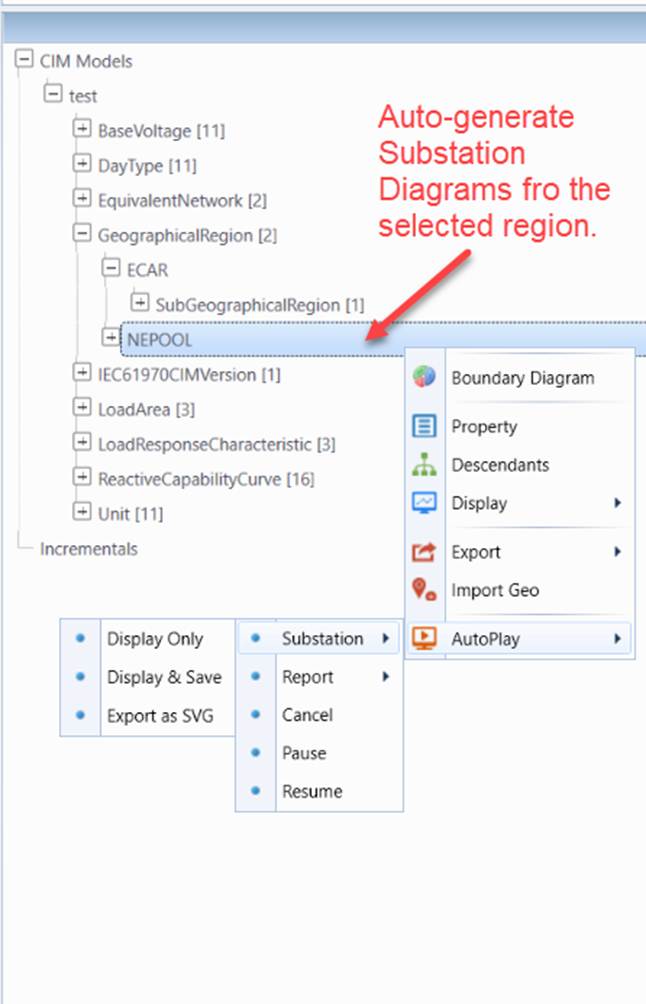
A similar process can also be invoked for a selected region (GeographicalRegion or SubGeographicalRegion). In this case, one-line diagrams will be generated for the Substations belonging to the specified region. Optionally, users can choose
- Display Only: Auto-generate Substation Diagram/Line Diagram for each Substation/ACLineSegment and display it. The generated diagram is not saved.
- Display & Save: Auto-generate Substation Diagram/Line Diagram for each Substation/ACLineSegment and save it as an in-memory CIM-compliant diagram into the model.
- Export as SVG: : Auto-generate Substation Diagram/Line Diagram for each Substation/ACLineSegment, save it as an in-memory CIM-compliant diagram into the model, and then export the saved diagram as a SVG file.
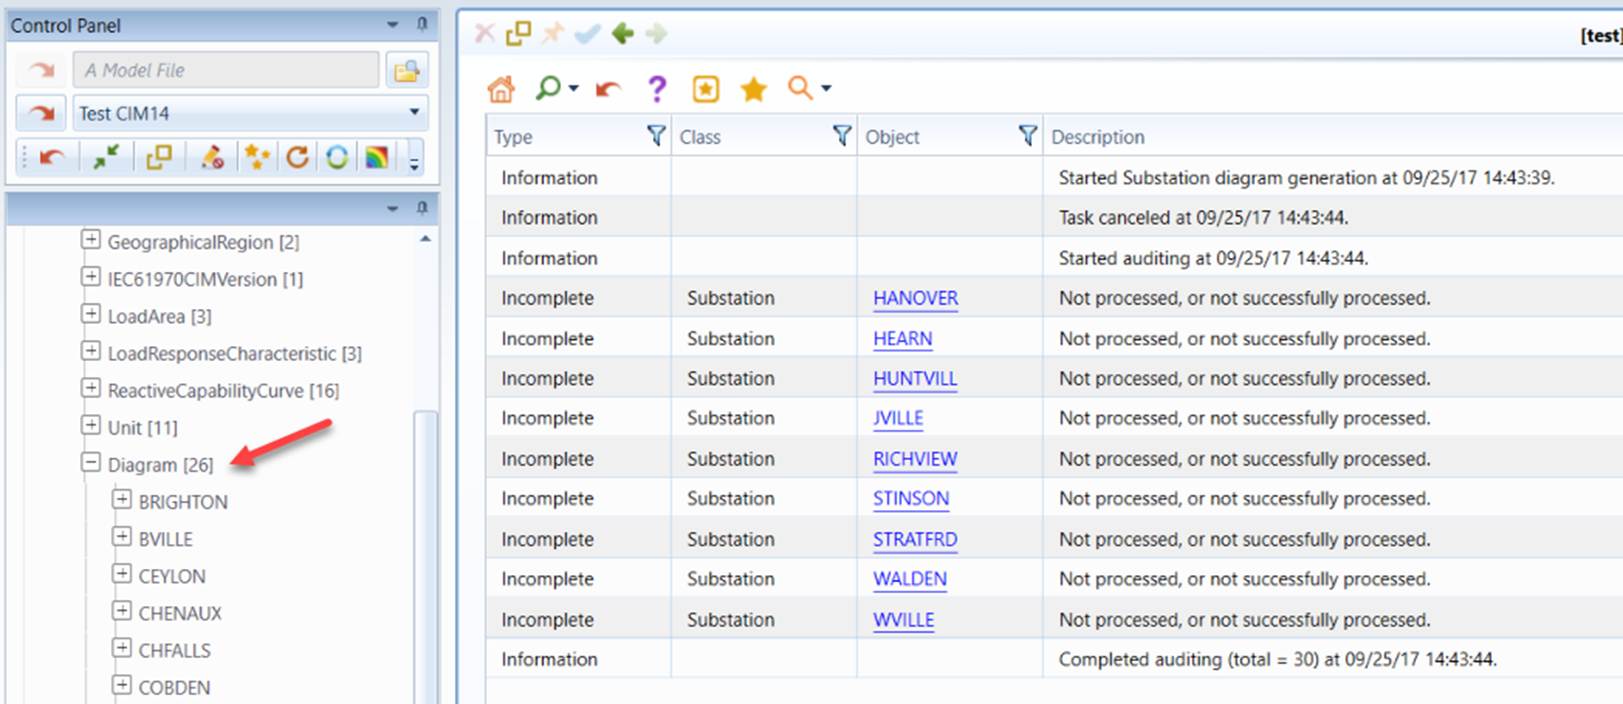
Once the function is invoked, the Tool will auto-generate a Substation/Line one-line diagram and save generated diagram in the CIM format in the workspace every specified period of time. Users will see list of the saved diagrams continuously grow until all of the diagrams are generated or auto-play is canceled/paused. When the auto-play is completed, a report will be displayed, summarizing the events logged during the auto-play process.
Once diagrams are saved into the model, a multi-page Diagram Summary displayed can be called as illustrated below. The diagrams are sorted in alphabetical order, allowing users to quickly access to a saved diagram by clicking the diagram name hyperlink.
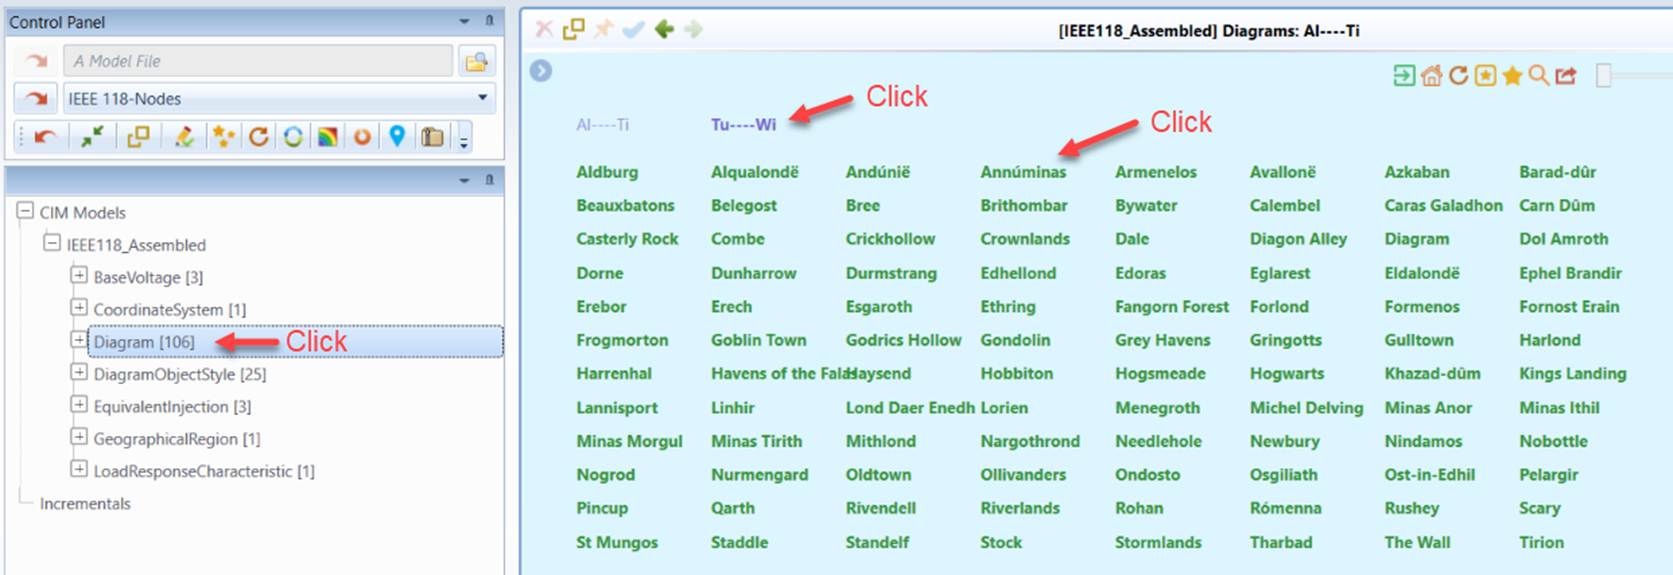
The format of diagram summary page is govern by the configurations at \CIMSpy\config\ui\AddonConfig.xml, as illustrated and described below:

where
- rows: maximum number of rows in each page;
- columns: maximum number of columns in each page;
- columnWidth: column width in pixel;
- rowHeight: row height in pixel;
- initX: horizontal distance from the top-left corner of the table to the top-left of the display boundary;
- initY: vertical distance from the top-left corner of the table to the top-left of the display boundary.
Export of Saved Diagrams in Bulk
While the Tool provides an option, i.e. AutoPlay→Substation→Display & Save, to enables users to combine three steps, i.e.
- Auto-generate Substation Diagram/Line Diagram for each Substation/ACLineSegment;
- Save it as an in-memory CIM-compliant diagram into the model;
- Export the saved diagram as a SVG file.
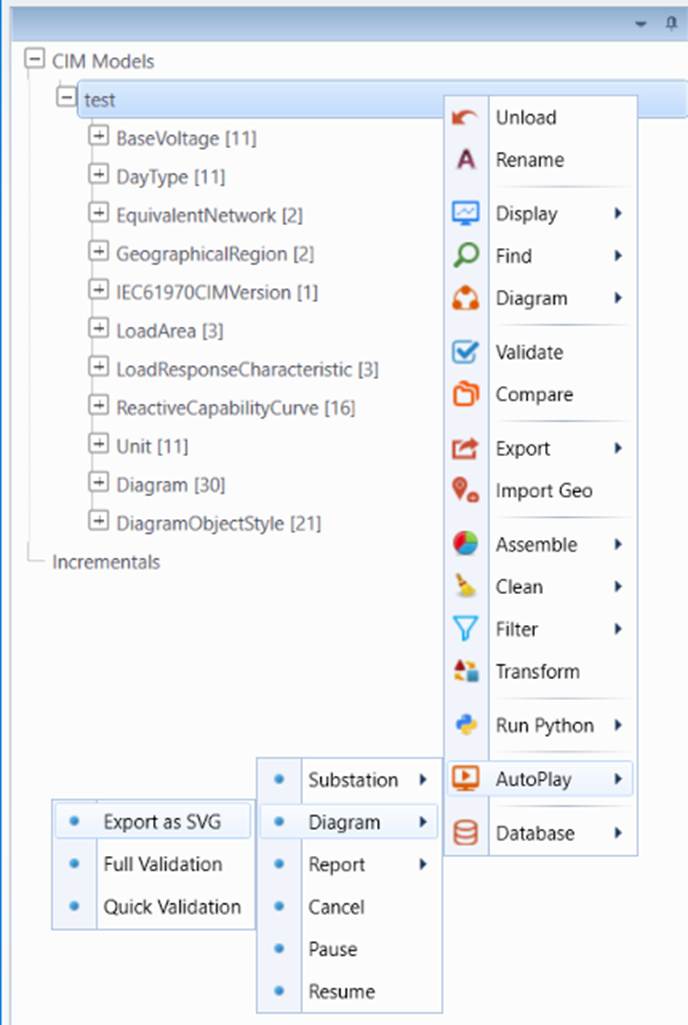
into one, Step 3 is typically a separate process. This is because the auto-generated diagrams normally require some manual adjustment for better clarity and look-and-feel. The SVG export process can be invoked as an auto-play process, as illustrated below.
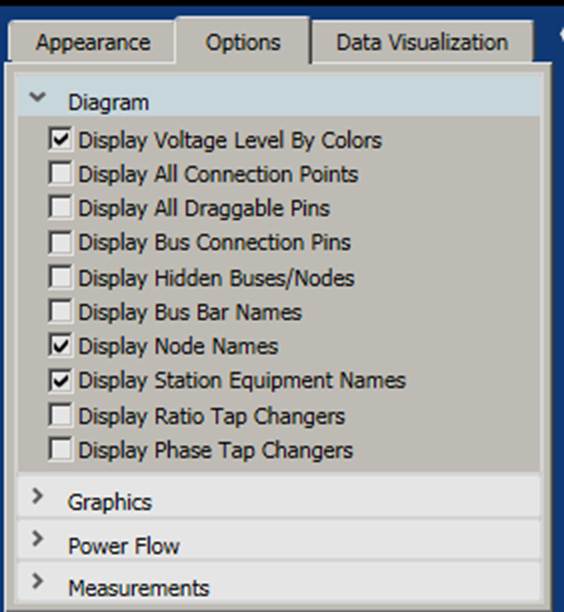
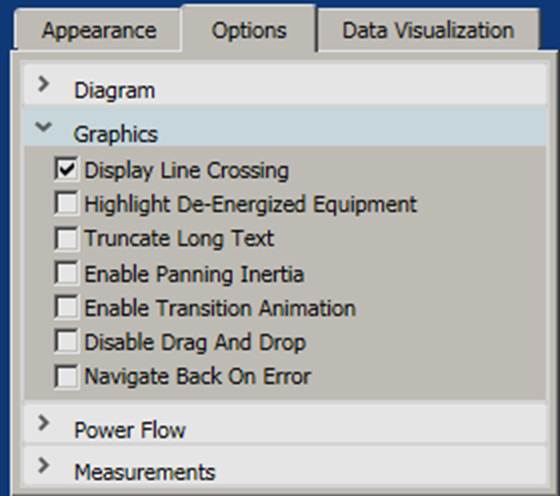
Before starting the auto export, check the diagram settings to make sure that the exported diagrams are properly configured. The Editing Mode shall be turned- off; the color theme shall be properly selected, and the follow diagram settings are suggested.
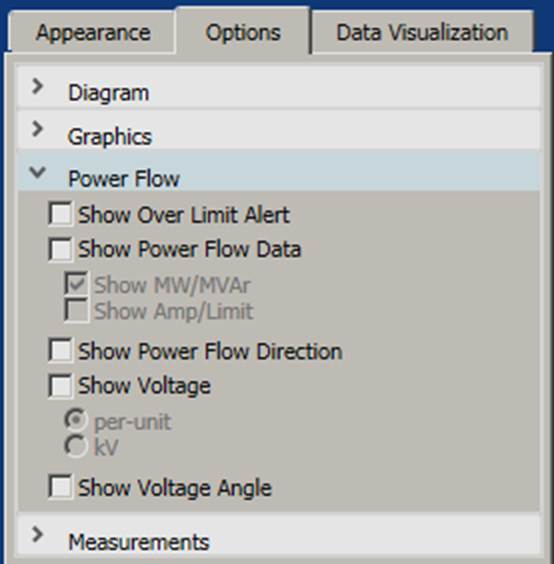
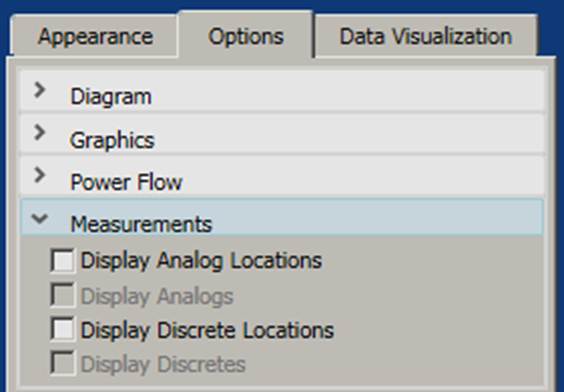
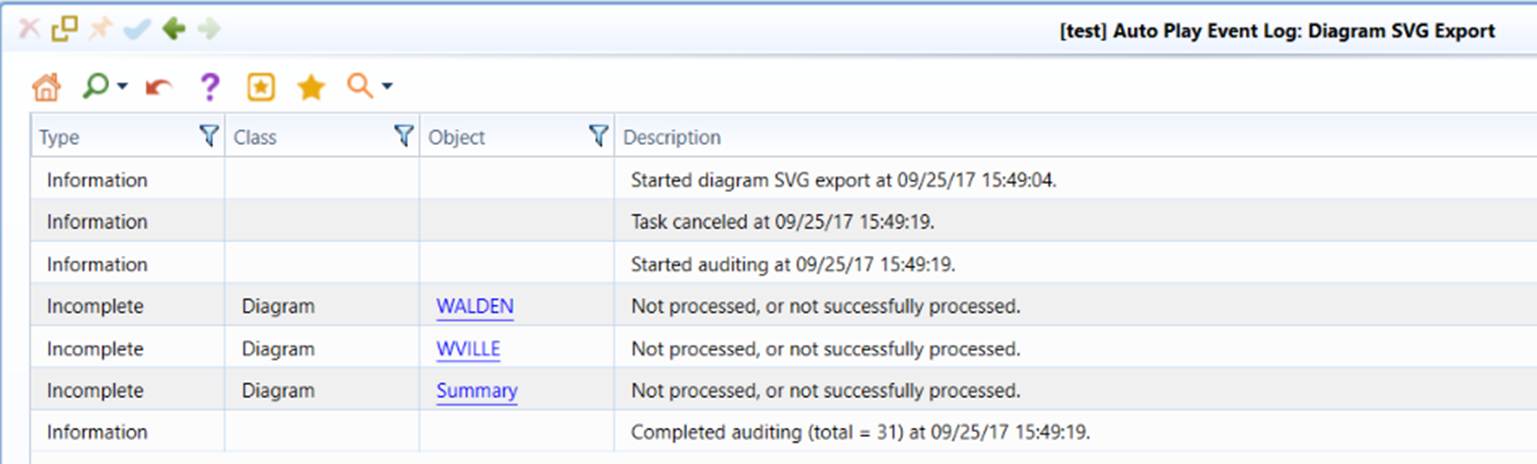
Once all of the saved diagrams are exported as SVG files or auto-play is canceled/paused, an event log report will be displayed in the active model view. The event log records any errors detected during diagram rendering and SVG export. Users can follow the link to verify the identified issues.
During the bulk diagram SVG export, the multi-page summaries will also be exported. Each page is stored as a SVG file with navigation links to other pages. A summary page is also generated with links to all of the pages.
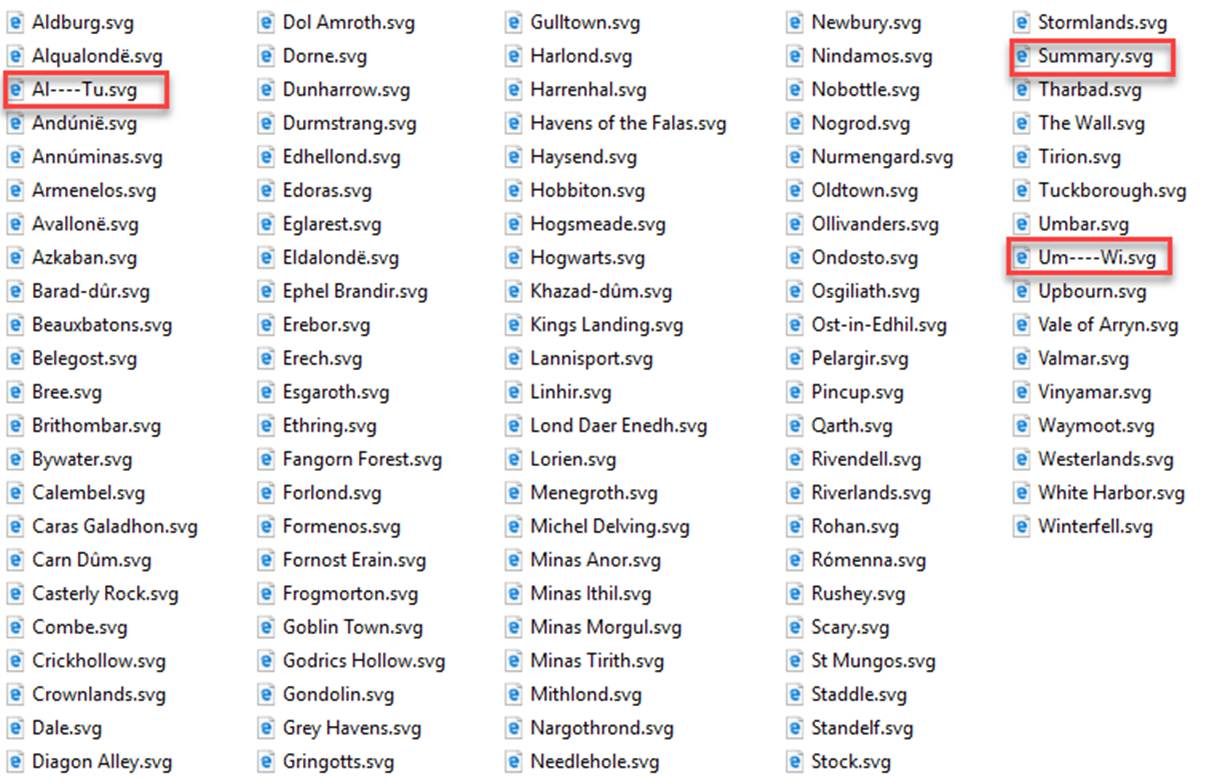
Diagram Selection/Filtering
The Auto-Play process can be customized to have users decide which Substations should be included/excluded during diagram auto-generation and export, as illustrated below
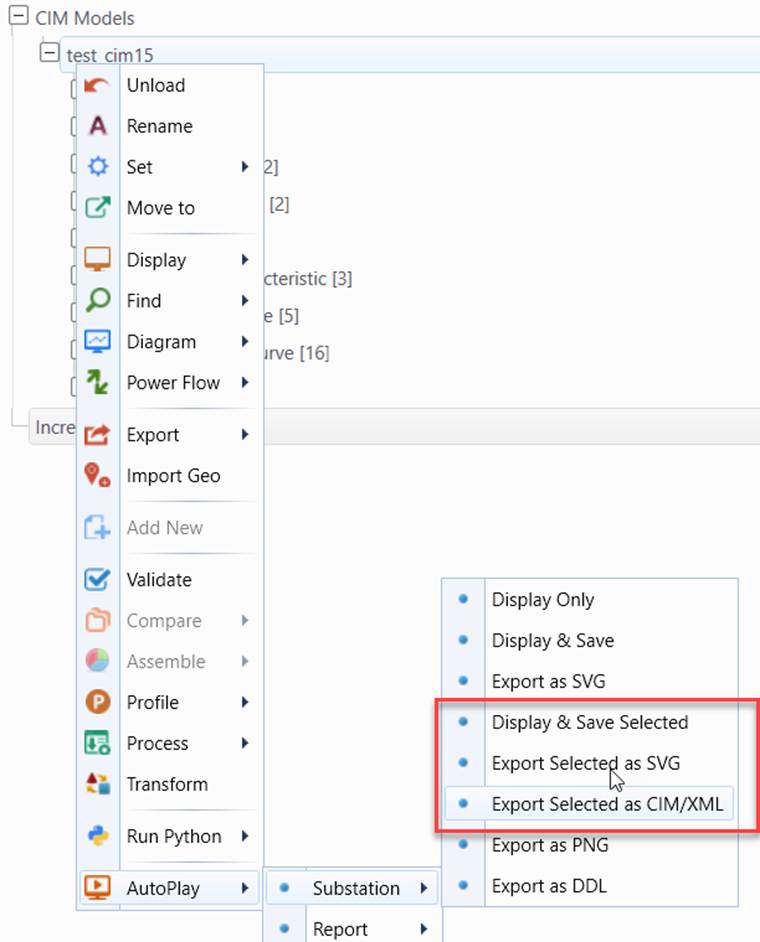
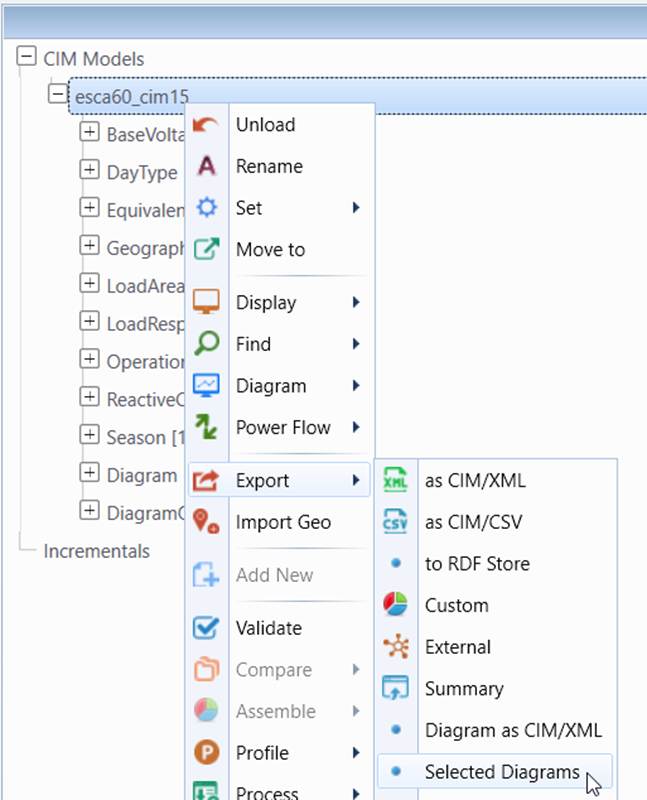
More specifically, the following customized diagram Auto-Play process can be invoked from the context menu associated with model:
- AutoPlay→Substation→Display & Save Selected: Auto-generate diagrams for the selected Substations and save the diagrams in the model.
- AutoPlay→Substation→Export Selected as SVG: Auto-generate diagrams for the selected Substations and export the diagrams as a collection of SVG files without saving the diagrams in the model.
- AutoPlay→Substation→Export Selected as CIM/XML: Auto-generate diagrams for the selected Substations and export the diagrams as CIM/XML files (per CIM Diagram Layout profile) without saving the diagrams in the model.
- Export→Selected Diagram: Save the selected (saved) Substation diagrams as CIM DL files. Note: the menu item is available only when Diagrams are saved in the model.
When these processes are invoked, users will be prompted to input a CSV-based configuration file to specify which Substations shall be included/excluded, as illustrated below.
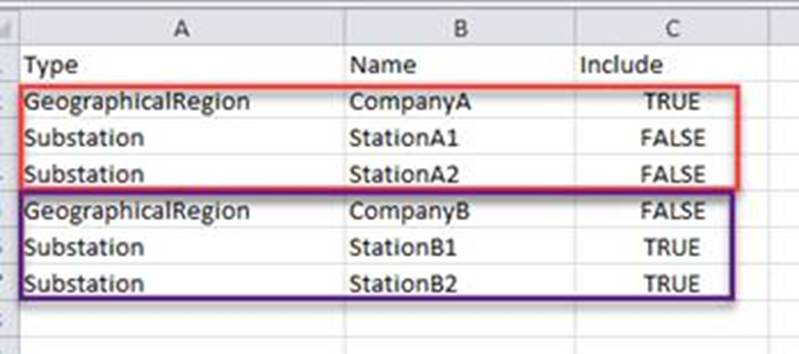
The above specification tells the Tool:
- Include all of the Substations in GeographicalRegion CompanyA, except Substation StationA1 and StationA2;
- Include only Substation stationB1 and StationB2 for GeographicalRegion CompanyB.
By default, if a GeographicalRegion is not specified, its contained Substations will not be included unless explicitly marked as included, i.e. Include=TRUE.
Additionally, users must provide a folder to store the exported diagrams organized by GeographicalRegions. Be default, diagrams will be saved by GeographicalRegions:
- When exporting diagrams as SVG, a separate sub-folder will be created for storing Substation Diagrams for each GeographicalRegion.
- When export the diagrams as CIM/XML files (per CIM Diagram Layout profile), a single file will be created for storing Substation Diagrams for each GeographicalRegion.
Users can disable the above default behavior by adding the following setting in \config\ui\AddonConfig.xml.

A sample configuration can be found at \TestCases\auto_play\filter.csv. It works with sample model Test CIM14 and Test CIM15, which can be loaded from the data source dropdown as illustrated below.
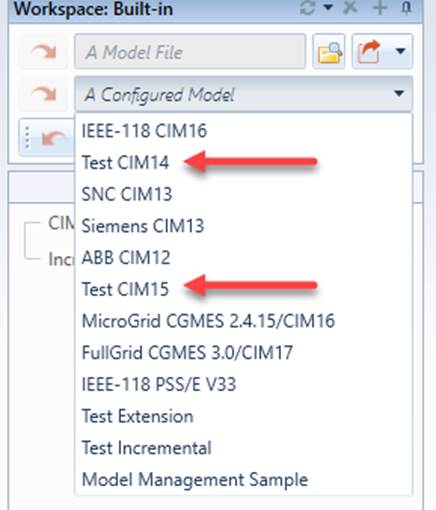
Diagram Maintenance
Assuming model is maintained in other tools or systems, such as EMS, and diagrams are maintained in the Tool, when model is changed, diagram must be updated to be consistent with model. This process is called diagram maintenance.
A typical model maintenance work flow is summarized as follows:
- Load a new version of model into the Tool and assemble it with the latest version of diagram.
- Run full diagram validation to identify inconsistencies.
- Based on the diagram validation logging, fix the reported model/diagram inconsistencies. Each reported incidence has a hyperlink to the corresponding diagram.
- Run quick diagram validation to ensure the targeted issue is fixed during the diagram fixing process.
- Continue the diagram fixing process. The diagram validation event logging can be saved and imported back to theTool so that the paused diagram fixing process can be continued.
- After all of the reported inconsistencies are fixed, run a full diagram validation to ensure that diagram and model are fully consistent.
- Export a full set of SVG files.
- Test the published SVG files in the target environment.
- Archive the new diagram/model file for the future diagram maintenance.
Diagram Model Assembling
When a new version of model becomes available, the CIM-based diagrams will be merged with the new model through export and assembling function of the Tool:
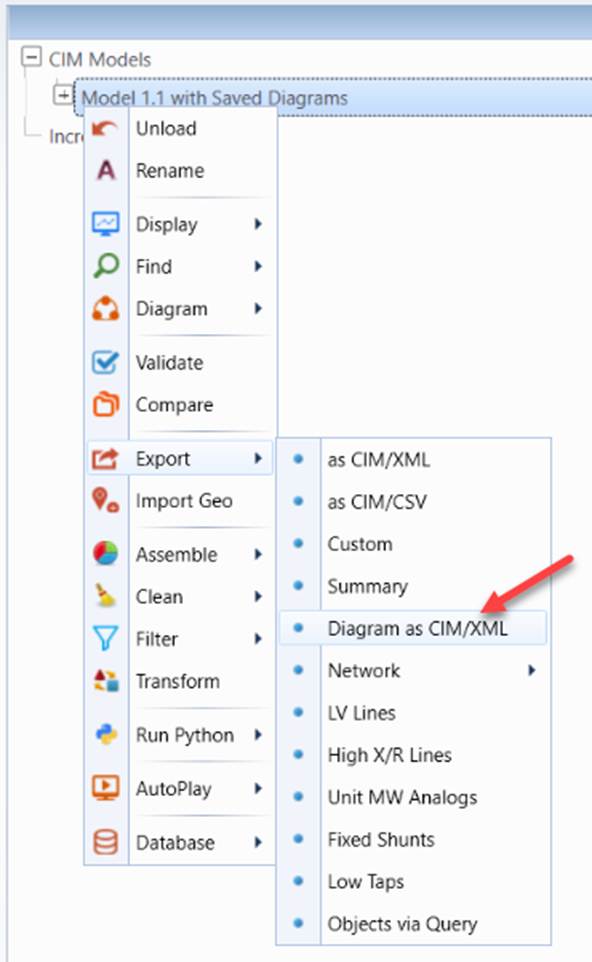
- Load the previous version of model file with saved diagram into the Tool. Export the saved diagram as a standalone CIM diagram file via context menu Export→Diagram as CIM/XML
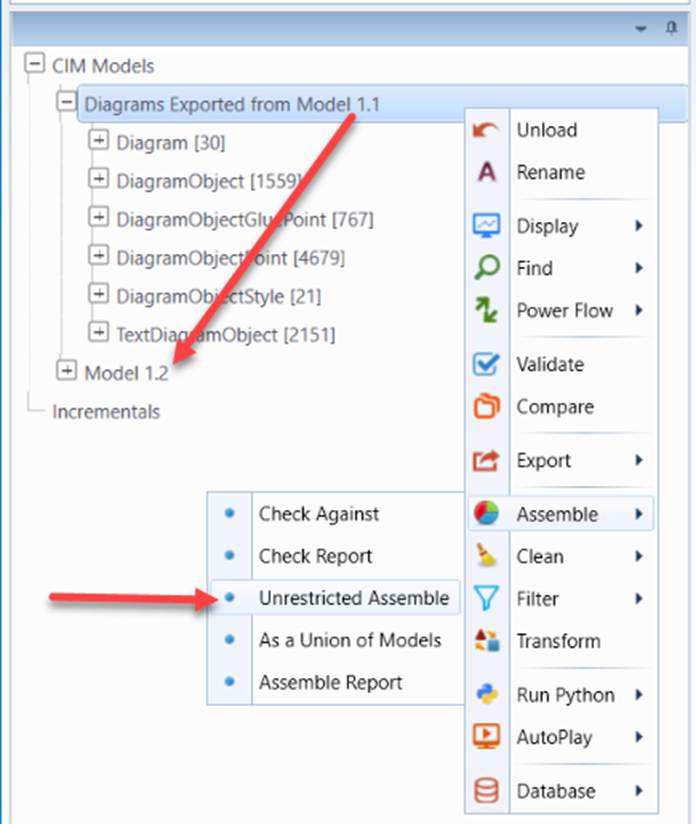
- Load a new version of model CIM/XML file and diagram CIM/XML file exported from the previous version of model file into the Tool and perform model merging via context menu Assemble→Unrestricted Assemble.
- Saved the merged model and then run diagram validation via context menu AutoPlay→Diagram→Quick Validation.
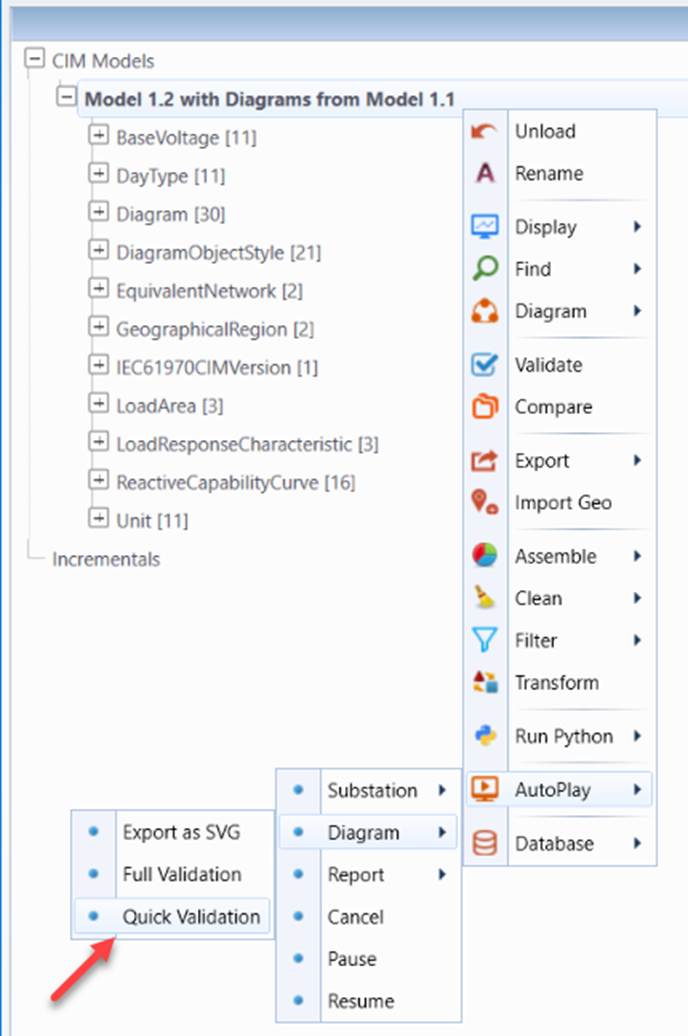
Diagram Validation
The Tool provides two types of diagram validations: Full diagram validation and quick diagram validation. The former is used to check the consistency between the saved diagram and the new version of the model comprehensively, while the latter provides a quick way to check the consistency during diagram fixing. The quick validation takes much less time to execute.
Full diagram validation consists of three stages:
- Data validation: The diagram object model is checked against network object model. This stage of validation is targeted to check the referential integrity between diagram and model.
- Diagram rendering testing: During this stage, each diagram is rendered visually. The goal of this stage is detect the network connection/topology changes.
- Auditing: Ensuring each diagram is validated.
Among three stages of diagram validation, diagram rendering testing is most time consuming. Quick validation skips this stage and provides a quick way to validate the diagram. Quick validation is particularly useful during diagram fixing. In most cases, Quick validation is good enough. In general, the Full Validation shall only be executed before publishing the updated diagrams.
The result of diagram validation (quick or full) is a report, showing all of the inconsistencies detected. Whenever applicable, hyperlinks are provided to enable users to navigate to the corresponding displays to perform the necessary diagram maintenance, such as removal of diagram for a deleted Substation or adjustment of fixed diagram, etc.
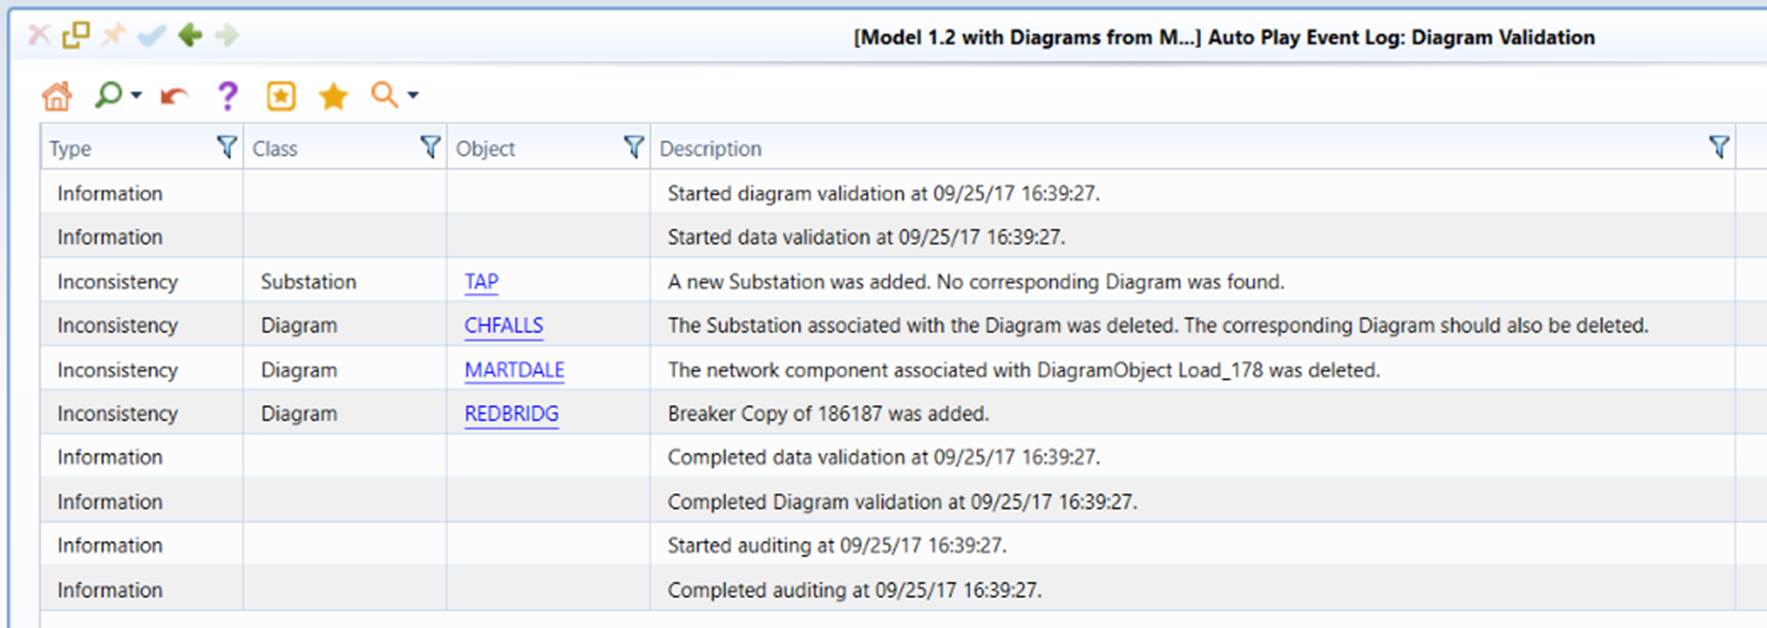
Diagram Fixing
If an inconsistency is identified, users will be informed for the changes detected. A heat-map per inconsistency will be created to highlight the detected inconsistency between the saved diagram and the new version of model, as illustrated below. If an inconsistency is identified, users will be informed for the changes detected. A heat-map per inconsistency will be created to highlight the detected inconsistency between the saved diagram and the new version of model, as illustrated below.
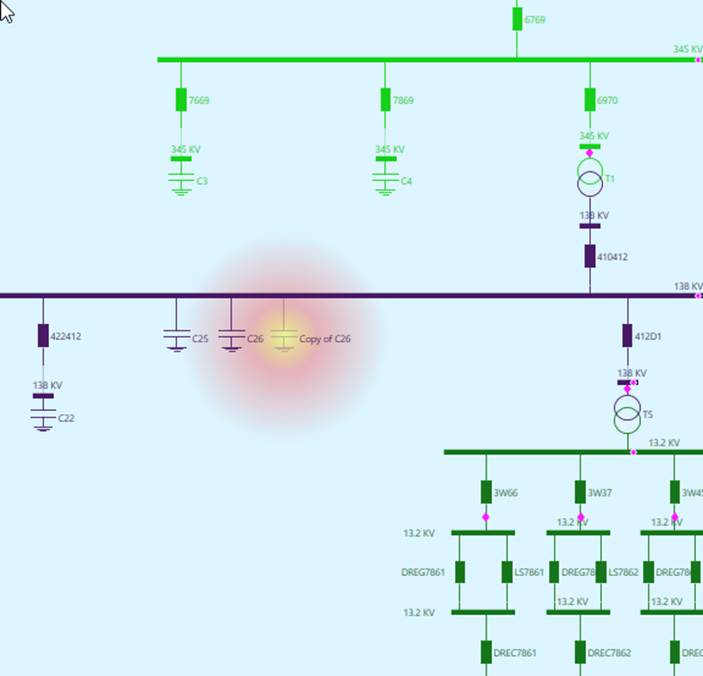
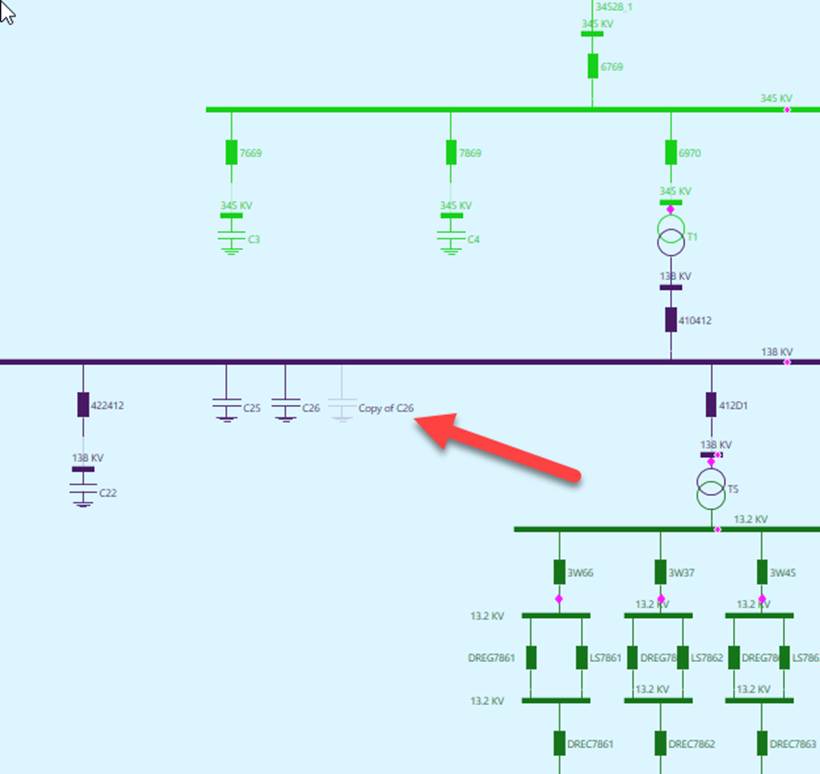
The heat-map will disappear after a while. But you shall still be able to find the related network components, since the opacity of these highlighted will be changed, as shown below
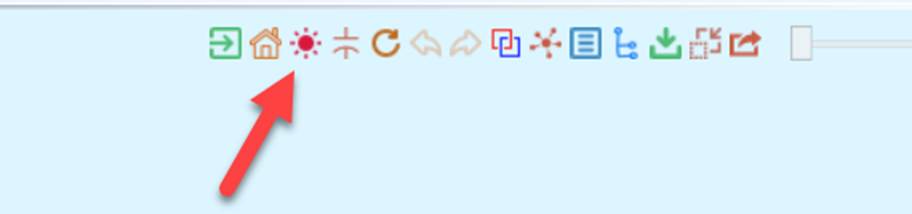
Users can always redisplay those highlighted from the quick access bar, as illustrated below.
Users are expected to manually adjust the fixed diagram. Once the fixed diagram is properly adjusted, users must explicitly save the manually adjusted diagram to overwrite the previously saved diagram and export the fixed diagrams as a file.
Auto-Generation of Changed Diagrams
This function is designed to facilitate diagram maintenance. It enables users to:
- Speed up the diagram auto-generation, because only changed diagrams need to be generated after initial full auto-generation.
- Track diagram changes in a change management or version control system, such as SVN, Git, etc.
The function can be triggered from the context menu, as illustrated below:
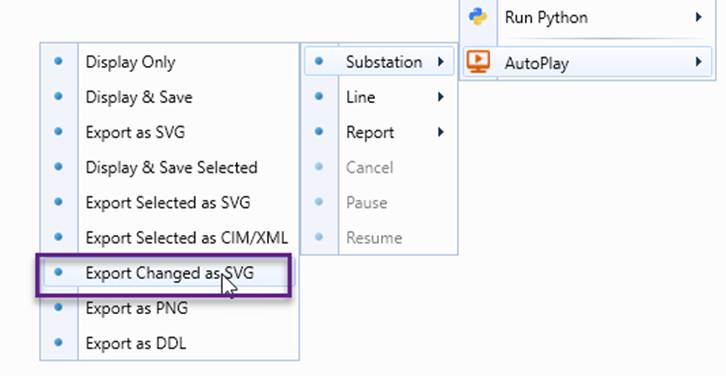
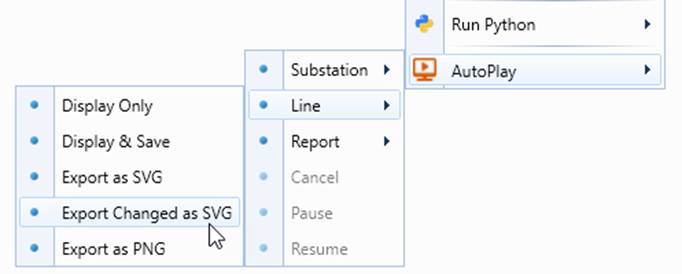
This function is based on Network Configuration comparison. Two custom reports, Substation Configuration and Line Configuration are designed to identify the changed diagrams.
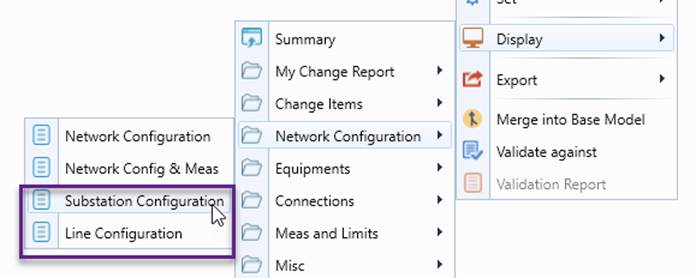
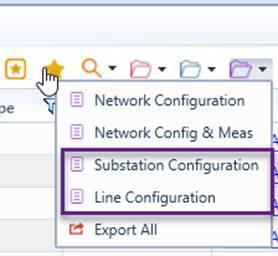
More specifically, the function automates the following processes:
- Compare the current model with an old version and generate an incremental model;
- From the incremental model, generate Substation Configuration or Line Configuration to identify the changed Substations or Lines;
- Auto-generate diagrams for changed Substations or Lines, including Summary reports (as needed) and save them as SVG files in a specified folder;
- Export the Substation Configuration or Line Configuration report as a CSV file, named as ChangeLog.csv in the same folder
Note:
- Users can customize changed diagram detection algorithm by changing the mode of the related reports. By default, the Substation Configuration report is derived from Network Configuration Base Report with mode = 53 (1 + 4 + 16 + 32). It reports network configuration changes at the Substation level (32), including measurement changes (1), node changes (4), and name changes (16). Similarly, the Line Configuration report is derived from Network Configuration Base Report with mode = 85 (1 + 4+ 16 + 64). It reports network configuration changes at the Line level (64), including measurement changes (1), node changes (4), and name changes (16). Users can change the mode to fit their need. As an example, if measurement changes shall be ignored, the corresponding modes need to be detected by 1, i.e. mode = 52 for Substation Configuration, mode = 84 for Line Configuration.
- The auto-generated diagrams shall be copied to the diagram depository to replace the existing ones. The deleted Substation/Line diagrams are, of course, not exported. These diagrams shall be manually removed from the diagram depository, based on ChangeLog.csv. The replaced/deleted old diagrams shall be retained in a change management or version control system, such as SVN, Git,
- The number of generated diagrams may not match the number of changed Substations/Lines in ChangeLog.csv. This is because the deleted are not exported and some may be reported more than one time.
Diagram Versioning and Archiving
Once diagram maintenance is completed and the generated SVG files are successfully published to the production environment. The existing version of diagrams must be properly versioned and archived for future diagram maintenance. It is strongly recommended:
- Saved diagrams shouldn’t be stored separately from the model. In other words, the assembled model/diagram shall be stored together as a single file:
- The version of the archived model/diagram file shall be in line with the version number of model. For example, if the new model file is named as MAS34_CIM15Export.xml, then the version number 34 shall be carried over in the name of the archived model/diagram file.
- Always store/manage the archived model/diagram file in a source control system, such as SVN, SourceSafe, Git, or Microsoft Team Foundation, etc.
- When check in the archived model/diagram file into a source control system, add detailed comments or logging describing what have been changed in the new version of model/diagram file. The initial/final diagram validation logging files shall also be archived for traceability purpose.
Logging
The Tool provides full logging services for three automation processes, i.e. diagram generation, SVG export, and diagram validation. The purposes of logging include
- Helping users monitor the automation processes;
- Reporting issues identified during the automation process;
- Providing hyperlinks for the identified issues to facilitate issue debugging and model maintenance.
The Tool supports two types of logging during each of the three auto-play automation processes:
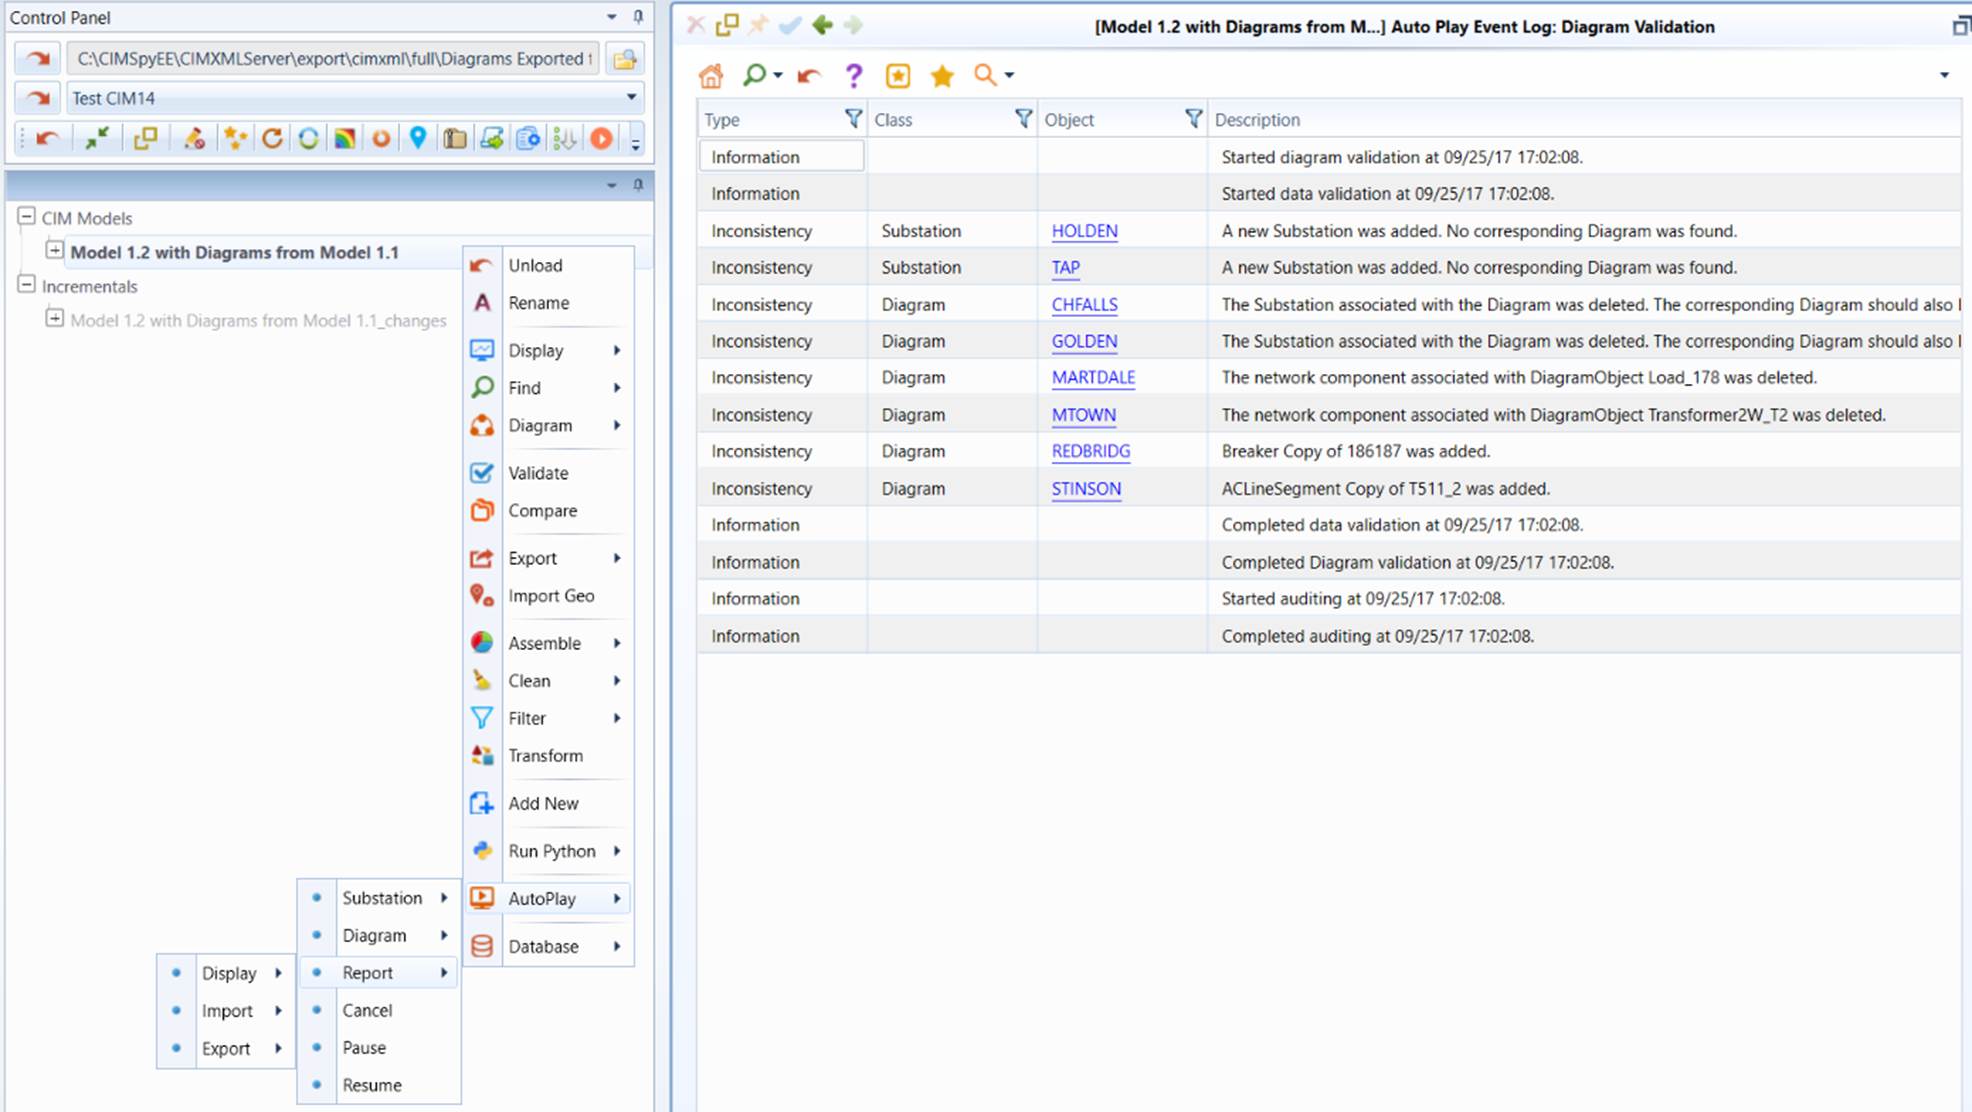
- XML-based logging: This type of logging is mainly to support user interface. The report is generated only after the automation process is completed. The logged events are saved as an XML file which can be imported back to the Tool for inspection.
- Text-based logging: This type of logging is mainly to support code debugging. It is an instant logging, meaning any logged event will be instantly written to a text file. Therefore, even the application aborts for any reasons, the previously logged events will not be lost.
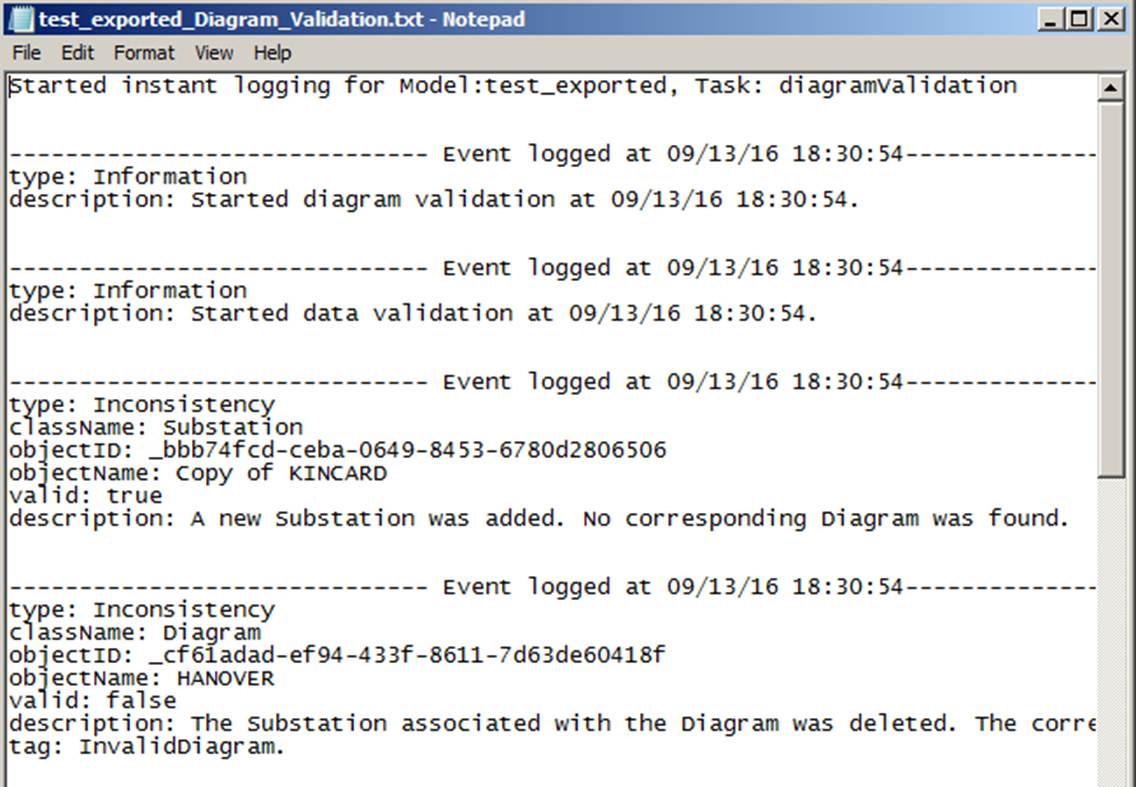
The contents in both log files are equivalent. Both XML-based logging and text-based logging can be enabled or disabled. The log files are stored in a specified directory, specified in AddonConfig.xml under \CIMSpy\config\ui. 
Names of log files are auto-created with model name and auto-play type, as shown below.
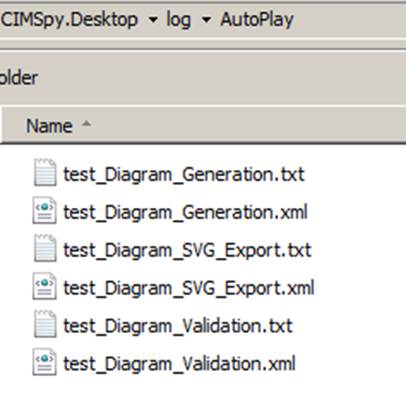
Events logged during the automation process are classified into the following categories:
- Information: The logged event is for information only, such as when users start the automation and when it is completed.
- Error: The logged event reports an error during diagram rendering, SVG export, etc. The error could be caused by invalid model data, wrong configuration, or software bugs. Users must analyze the errors and correct them correspondingly.
- Inconsistency: The logged event report inconsistence between model and saved diagram. This is mostly because model has changed and the corresponding saved diagram is no long valid. For example, a Substation is deleted from the model. Consequently, the saved Substation diagram is no longer valid. Users must correct the diagram to keep model and diagram in-sync.
Events are logged at different stages. For example, during diagram validation, events are logged at three stages: data validation, diagram rendering testing, and auditing.
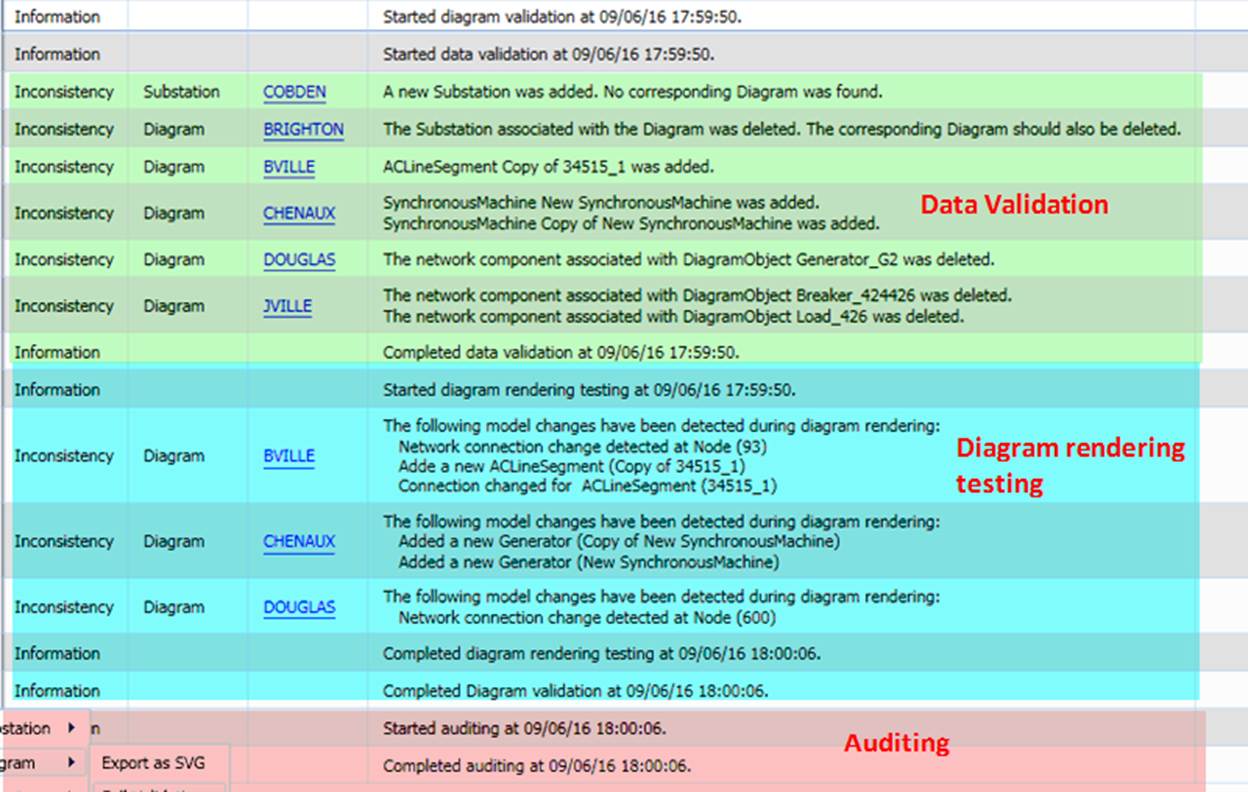
These stages are designed to validate the diagram from different perspectives, as described below:
- Data validation: Checking the data consistency between model and diagram.
- Diagram rendering testing: Each saved diagram is actually rendered against the model to ensure diagrams and models are consistent.
- Auditing: Ensuring all of the saved diagrams are checked against the model. If the time interval between two plays is too short, some of the diagrams may not be checked. If this happens, auditing will report the missed diagrams.
The above three stages are complimentary, checking the model from different perspectives. Inevitably, the same error/inconsistency may be reported redundantly. Normally, when the issue is fixed, all of the duplicate events will disappear.
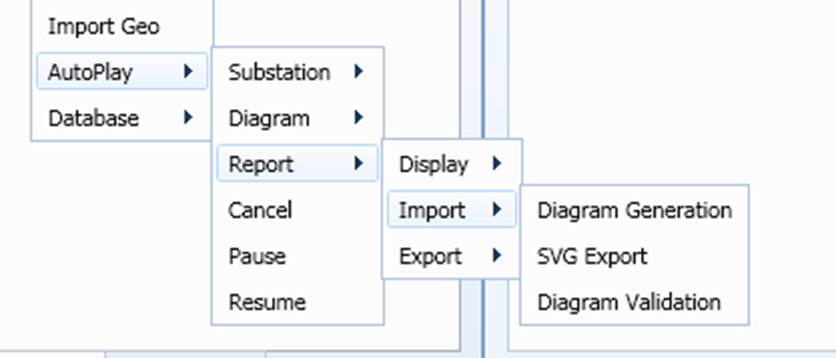
The logging reports can be called through context menu as illustrated below:
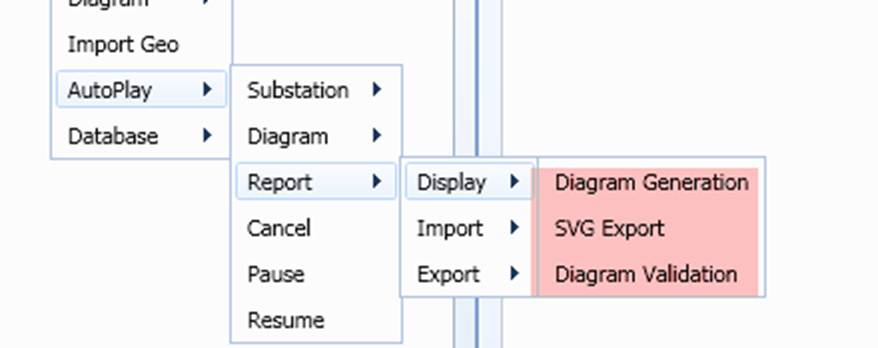
All of the logged events can be explicitly exported as XML files and the exported XML files can be imported back to the Tool. If auto event logging is enabled (i.e. enableXMLEventLogging is set to ‘true’ in the configuration), export event is not necessary, since the XML-based event logging file is auto-created after the automation process is completed. The import functionality is mainly to allow users to store the current logging so that the work can be continued during debugging.
Configuration
The auto-play function of the Tool is configurable. Users can change the time interval between two plays \CIMSpy\config\ui\AddonConfig.xml.

- genDiagram: time interval (in msec) between two plays when auto-generating Substation/Line diagrams for “Display Only”;
- saveAsCIM: time interval (in msec) between two plays when auto-generating Substation/Line diagrams and save as CIM diagrams;
- saveAsSVG: time interval (in msec) between two plays when exporting saved diagrams to SVG files;
- saveAsSVG: time interval (in msec) between two plays when run full diagram validation.
- saveByRegion: if true, a separate sub-folder will be created for storing Substation Diagrams for each GeographicalRegion when exporting diagrams as SVG. This configuration parameter is optional. The default value is ‘false’ if missing. The configuration is applicable only for AutoPlay->Substation->Export as SVG.
- maxNumberOfTrials: If the Tool is installed in a slow machine, this setting shall be increased correspondingly to avoid overlapping between two plays. If this setting is too low, some of the substation/line diagrams may not be saved. In this case, the Tool will start another iteration of trial to complete the remaining diagram generation, or saving, or validation till all of the substations/lines are processed or the specified maximum number of iterations is reached,