Tabular Display
Tabular display shows multiple objects of the same class in a multi-paged table. This feature allows users to inspect multiple objects of the same class in one display. In addition to displaying multiple objects, Tabular Displays are also used to display views (custom reports) and various types of task reports, ranging from Validation Report.to Model Merging Logging,
Calling Tabular Display
There are a few ways to call a Tabular Display:
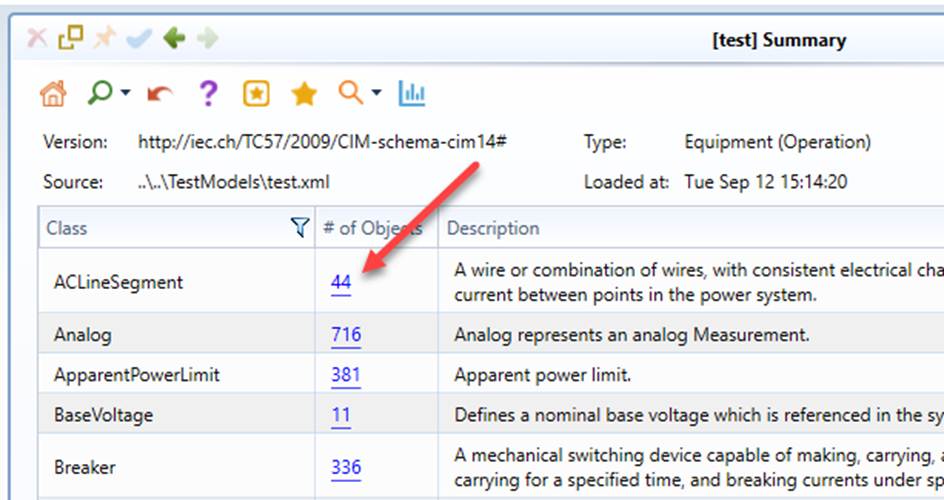
- Click the object count link in the Summary page to display all of the objects of the same class.
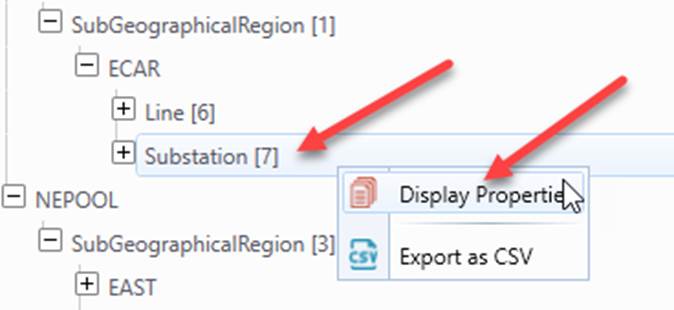
- Click the category tree item in the navigation tree (or Right-mouse click the category tree item and invoke the “Display Properties” menu item) to display the objects of the same class in a model hierarchy. This feature allows users to selectively choose what to display. For example, users can choose to display the Substations belonging to the same SubGeographicalRegion.
- Construct queries or call pre-defined or built-in displays to filter objects or build custom reports.
- By navigating from a task report, such as Validation Report.
- After running a task, such as Model Validation.
- By navigating from a Bookmark.
Understanding Tabular Display
Once a Tabular Display is called, the Active Model View will display the corresponding object attributes and references in a tabular format. Links are also provided for navigation to the referenced objects. Whenever possible, object names (instead of rdf:ID) are displayed as navigation links. The following screenshot illustrates some of the features of a Tabular Display.
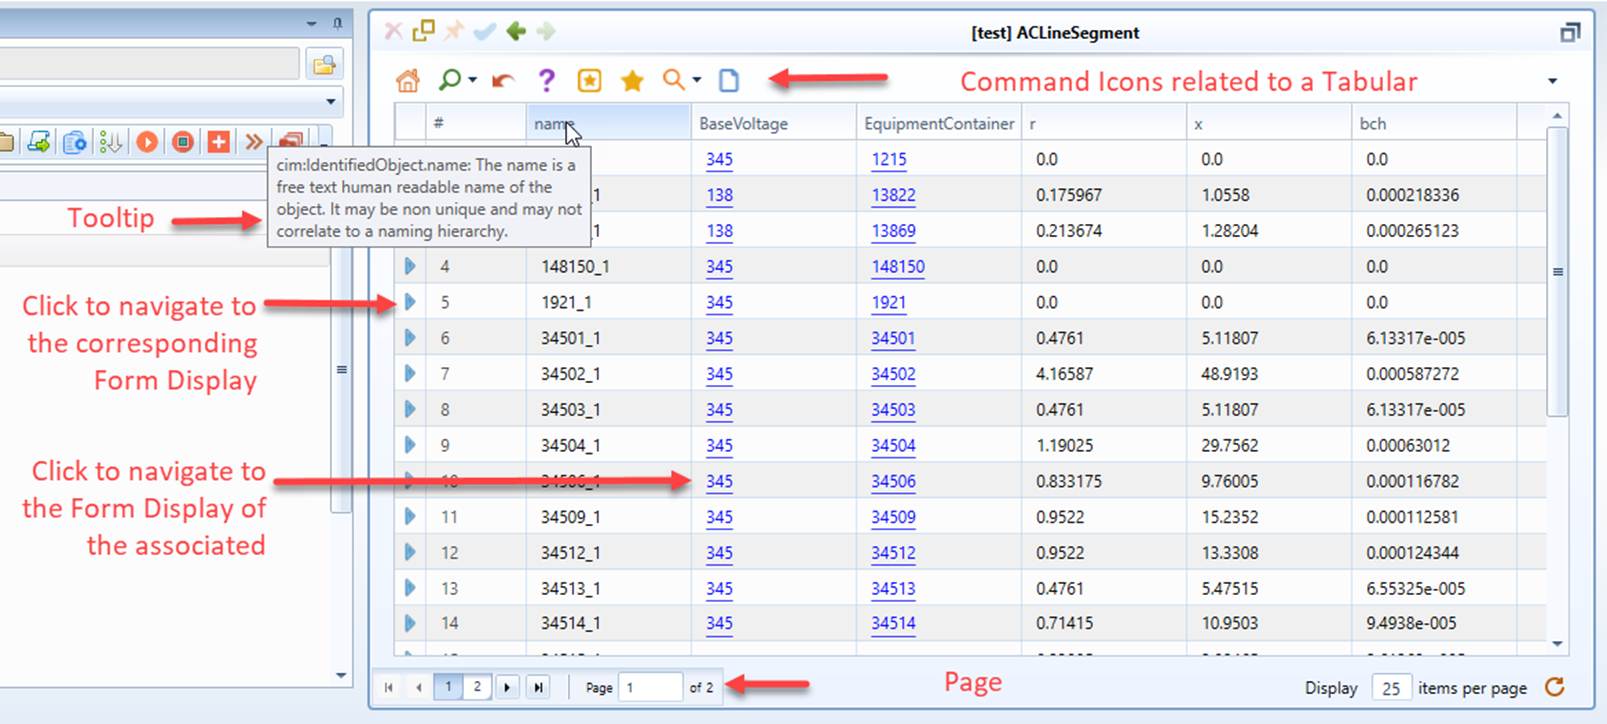
Features of Tabular Display
- The Tabular Display enables users to enter the data for multiple objects during the editing mode.
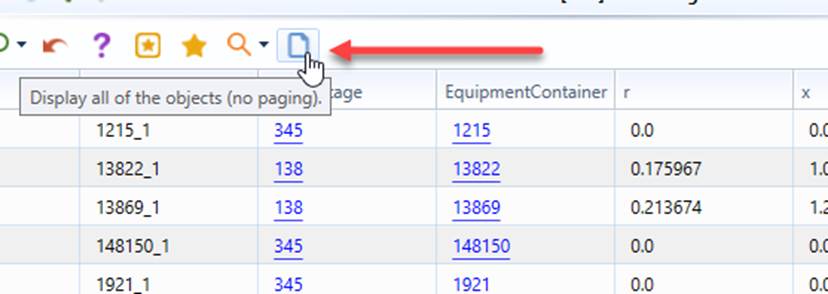
- By default, paging is supported. But users can choose to display all of the objects in a single page by clicking the related command icon, as illustrated below.
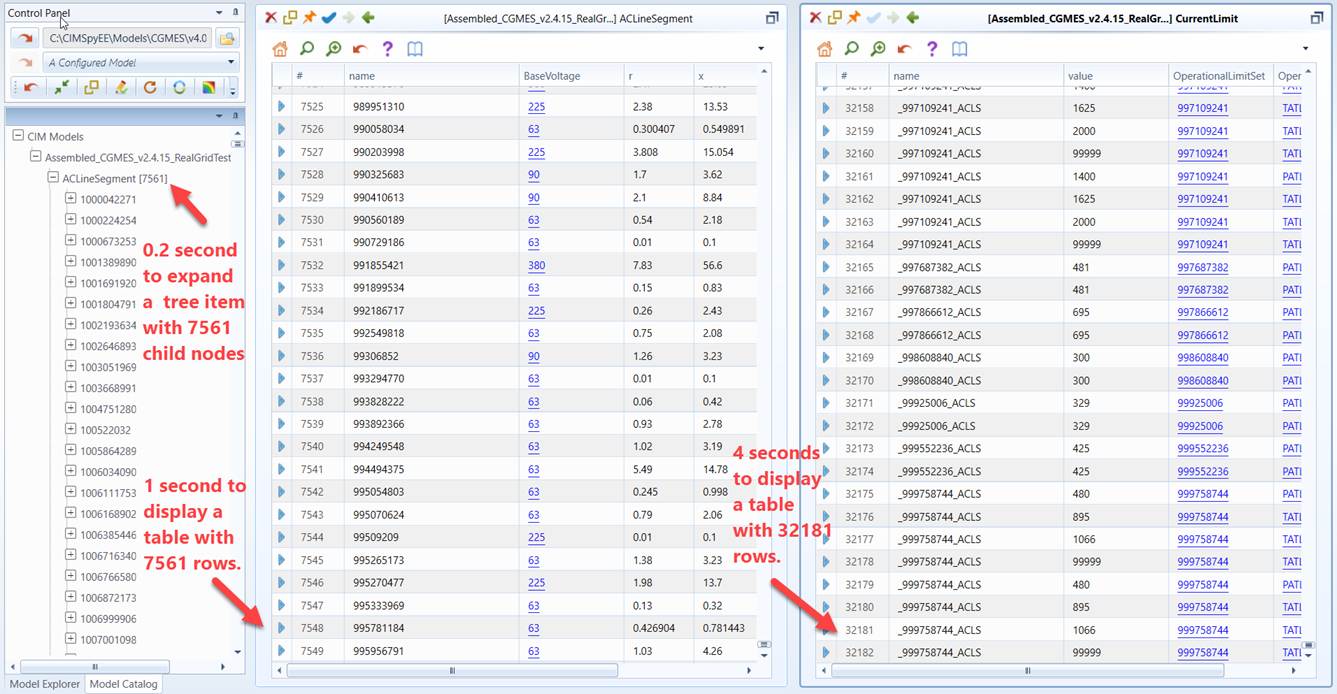
- Virtualization is supported. A tabular display with tens of thousands of rows can be displayed within seconds, for example 32,000 rows within 4 seconds.
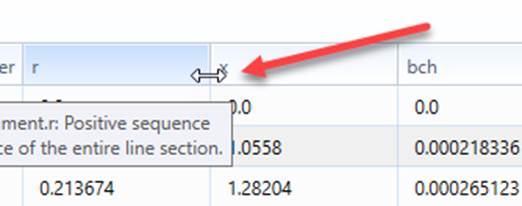
- Users can adjust tabular display by resizing column width, as illustrated below.
- Copy-and-paste is supported. User can select cells, copy them (Ctrl-C) to clipboard, and then paste (Ctrl-V) the copied cells to other places.
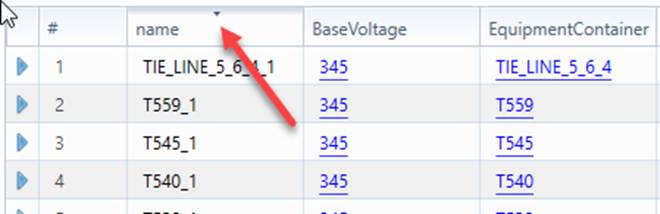
- Users can sort the table by column. This is achieved by double-clicking the column header, as illustrated below.
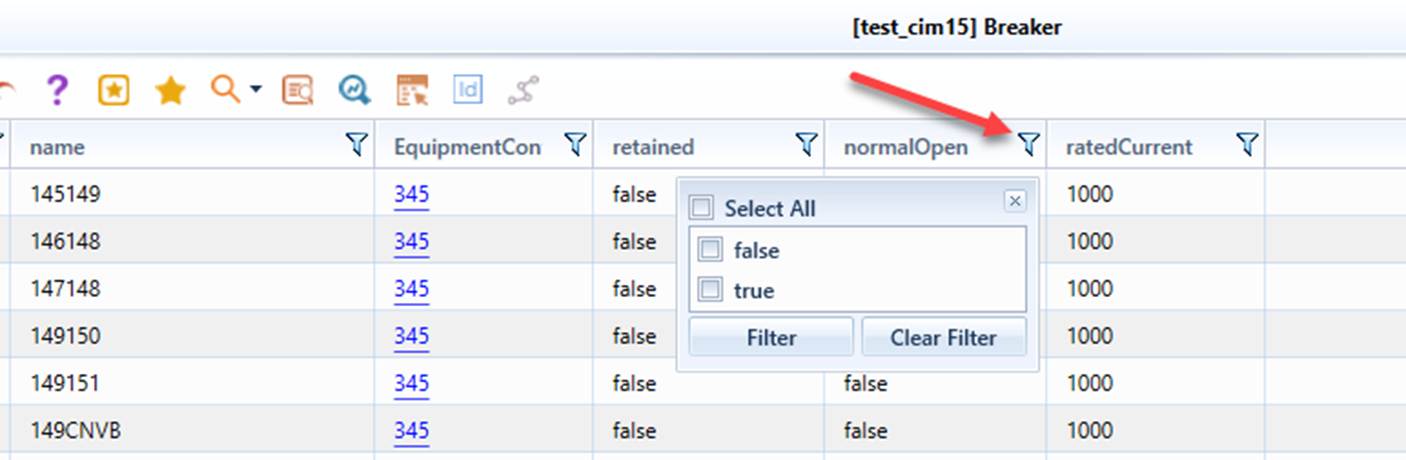
- Tabular displayed used to display objects of a class or custom reports (views), can be filtered by the values of the selected column, as illustrated below
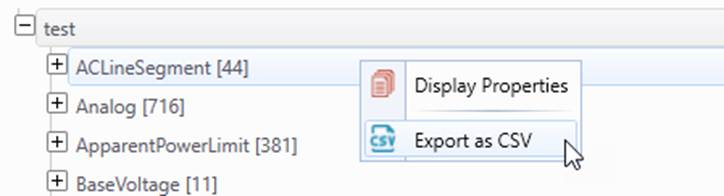
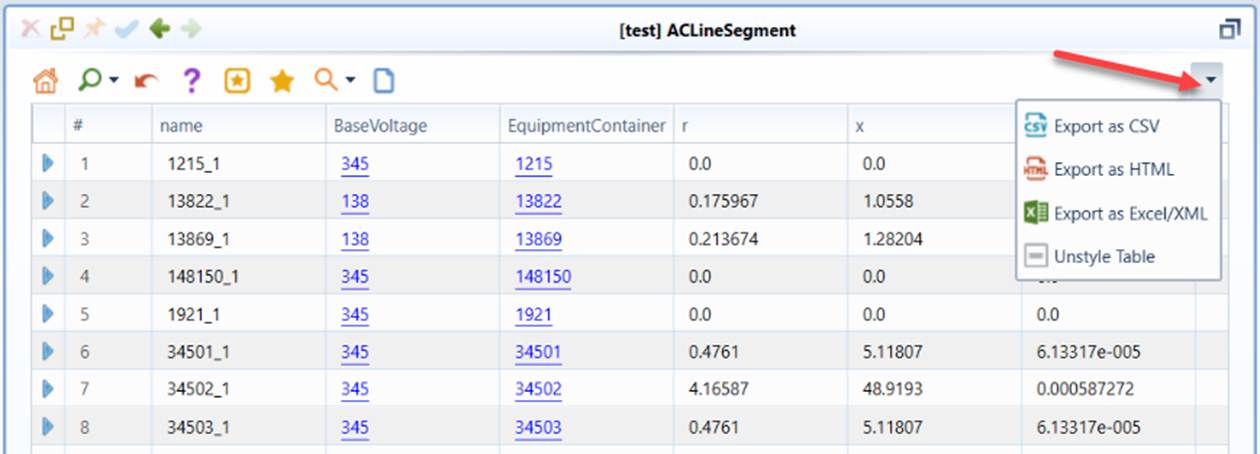
- Most of the Tabular displays can be exported as CSV files, as illustrated below.
- All of the data shown in a tabular display can be exported as CSV/HTML/XML files, as illustrated below. Note this feature export the data exactly as it is shown in the UI. For association properties, for example, it shows the names rather than rdf:IDs. Use the above export feature if users want the rdf:IDs to be exported.
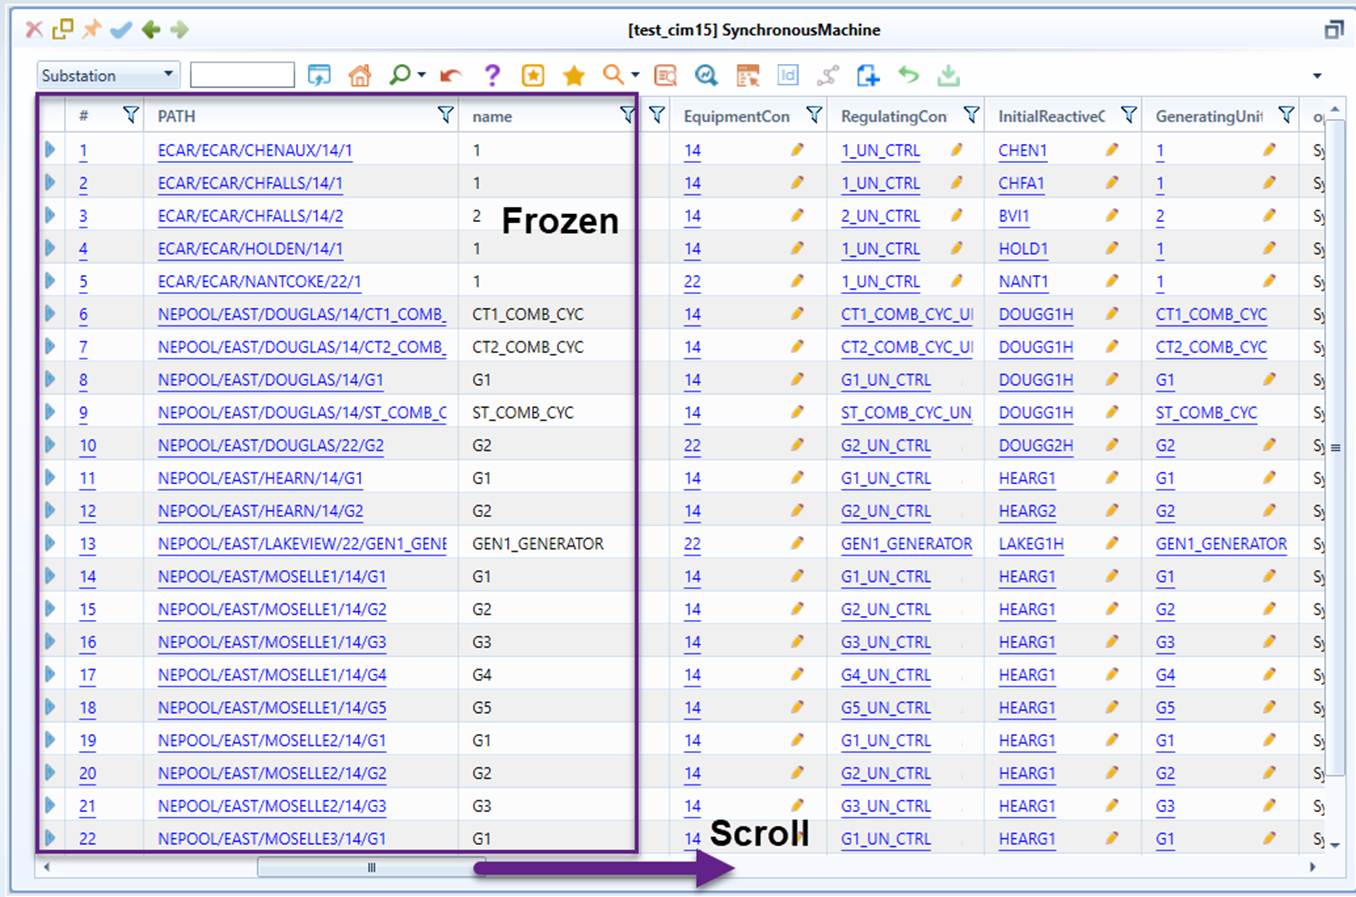
- The identifier columns (e.g., #, Name, and Path) remain frozen when users scroll through large tables, as shown below.
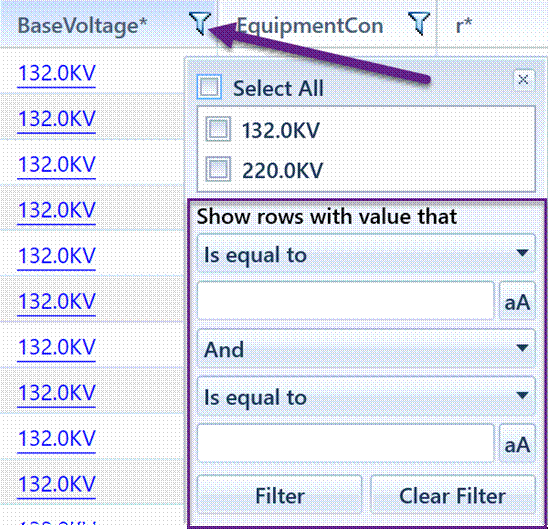
- Added advanced filtering capability for each column, as shown below.
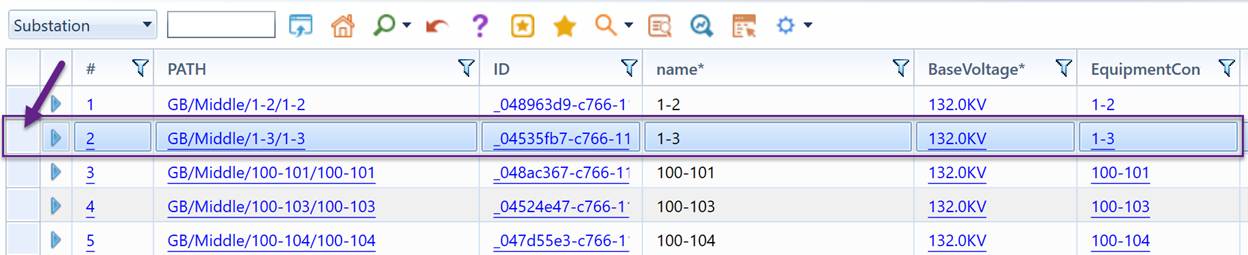
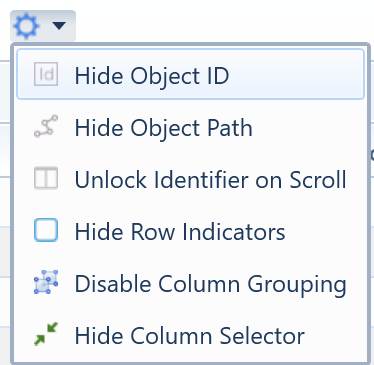
- Row Indicator: Displays a row indicator that allows users to select and highlight an entire row.
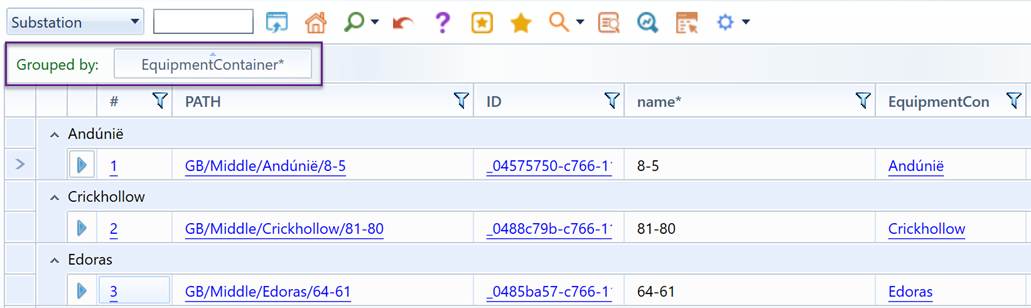
- Column Grouping: Enables column grouping by dragging and dropping column headers into the grouping area.
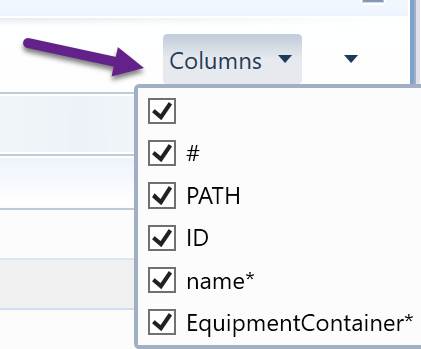
- Show/Hide Columns: Provides an option to control column visibility by showing or hiding selected columns.
The above features can be enabled/disabled, as illustrated below. Note this is a persistent setting, meaning it will be valid till explicitly changed.
About Path Column
In a tabular display showing raw model objects, a hierarchical ‘path’ column is displayed by default. This attribute, dynamically generated based on the pre-defined object containership, displays the object hierarchal path using object names. A Substation path, for example, is displayed as ‘GeographicalRegion/SubGeographicalRegion/Substation’, as shown below. The ‘path’ column is introduced for two purposes:
- Enhancing ‘Situational Awareness”: The ‘path’ attribute shows the hierarchical location of an object. It provides the context information informing users where the object is hierarchically located. For example, the Substation path shows which GeographicalRegion/SubGeographicalRegion the Substation belongs to. By clicking the hyperlink of path, the Model Explorer navigation tree will be automatically expanded, showing the hierarchical location of the related object. The feature facilitates model browsing.
- Supporting Hierarchical Grouping/Sorting: The ‘path’ attribute contains rich information in support of hierarchical grouping/sorting. By clicking the ‘path’ title in the tabular display, users can sort the objects based on their hierarchical paths. For example, when sorting Substation objects by ‘path’, all of the substation objects are first grouped/sorted by GeographicalRegion, and then by SubGeographicalRegion. This feature improves the usability of the Tool.
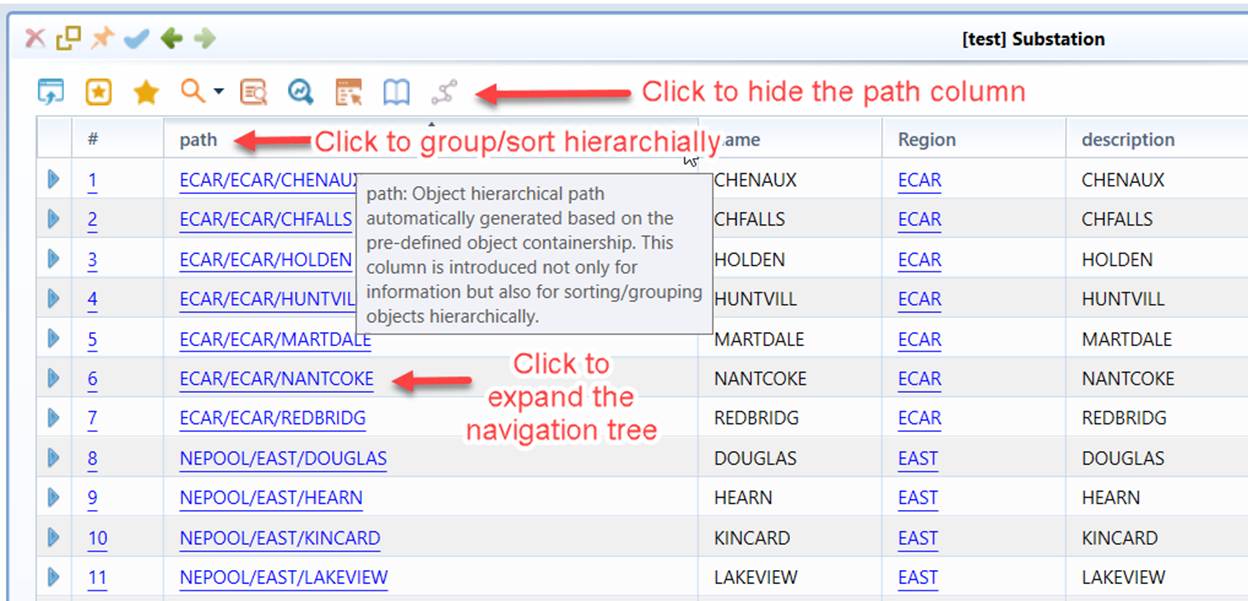
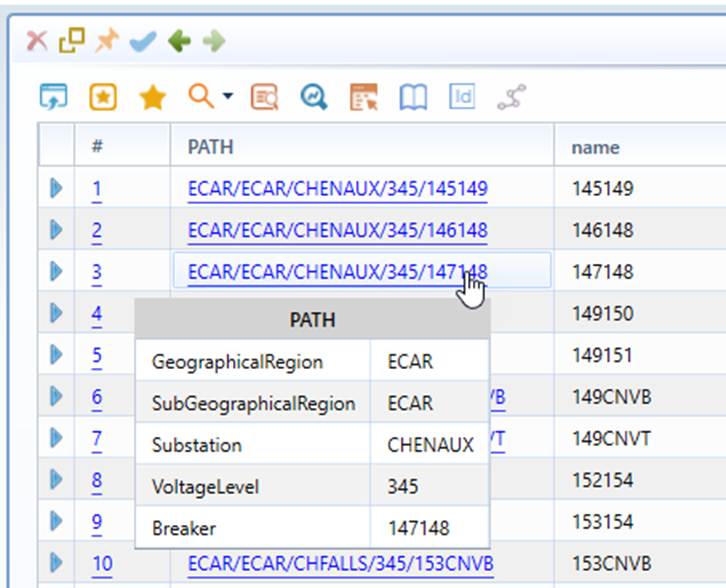
While the ‘path’ of an object is displayed without showing class names, such information can be found with mouse over the selected path, as illustrated below:
Note:
- The ‘path’ column is read-only regardless of status of the editing mode. It is automatically generated by the Tool. When the object hierarchy is changed, this attribute will be automatically updated.
- Users can hide the ‘path’ column by clicking the corresponding command icon, as illustrated above.
- Object ‘path’ is pre-defined. In CIM, there is no strict hierarchical definition for CIM objects. The Tool relies on model constraint meta-data for the path definition. The model constraint meta-data (i.e. CIMSpy\config\constraint\DefaultConstraint.xml) defines which association shall be used to access the parent object for each class.
- Object ‘path’ is supported by MQL and Python Scripting. Users can leverage such support for various purposes, for example, adding a ‘path’ column in a custom report built with MQL
About Performance
By leveraging cutting-edge UI virtualization technologies, the Tool enables users to display a large table consisting of tens of thousands rows within a few seconds. The following shows some results for conducted performance tests:
Note
the above testing was conducted on a laptop with Inter i7/2.70 GHZ CPU and 16 GB RAM.