Generating Custom Reports
The Tool enables users to view multiple objects of the same class in a tabular display. It also allows users to filter the tabular display through MQL query. These functions are mainly data-driven. The content is displayed as it is. There are many cases where users want to build custom tabular displays. A custom tabular display may combine the data from related objects and the data displayed could be also manipulated. For example, users may want to generate a report that displays all of the related information about ACLineSegments, including the connected Substation/ConnectivityNode, line parameter in per-unit, and flags indicating whether the line serves as a tie-line. There are different use cases for creating such custom tabular displays:
- Model Transformation/Conversion: By generating various custom tabular displays, users can convert a CIM model into various flat tables to support other applications or traditional model exchange. The converted flat tables can be exported as a collection of CSV files that can serve as the input of other applications. The exported CSV files can also server as traditional model exchange formats.
- Data Mining & Reporting: Users can define custom tabular displays to find the information of interest. This user-centered reporting feature enables users to find particular information of the interest and then generates a report in a format that users specify. It provides an infrastructure support for visual data mining, aimed at discovering business intelligence (BI) from large volume of data or BigData.
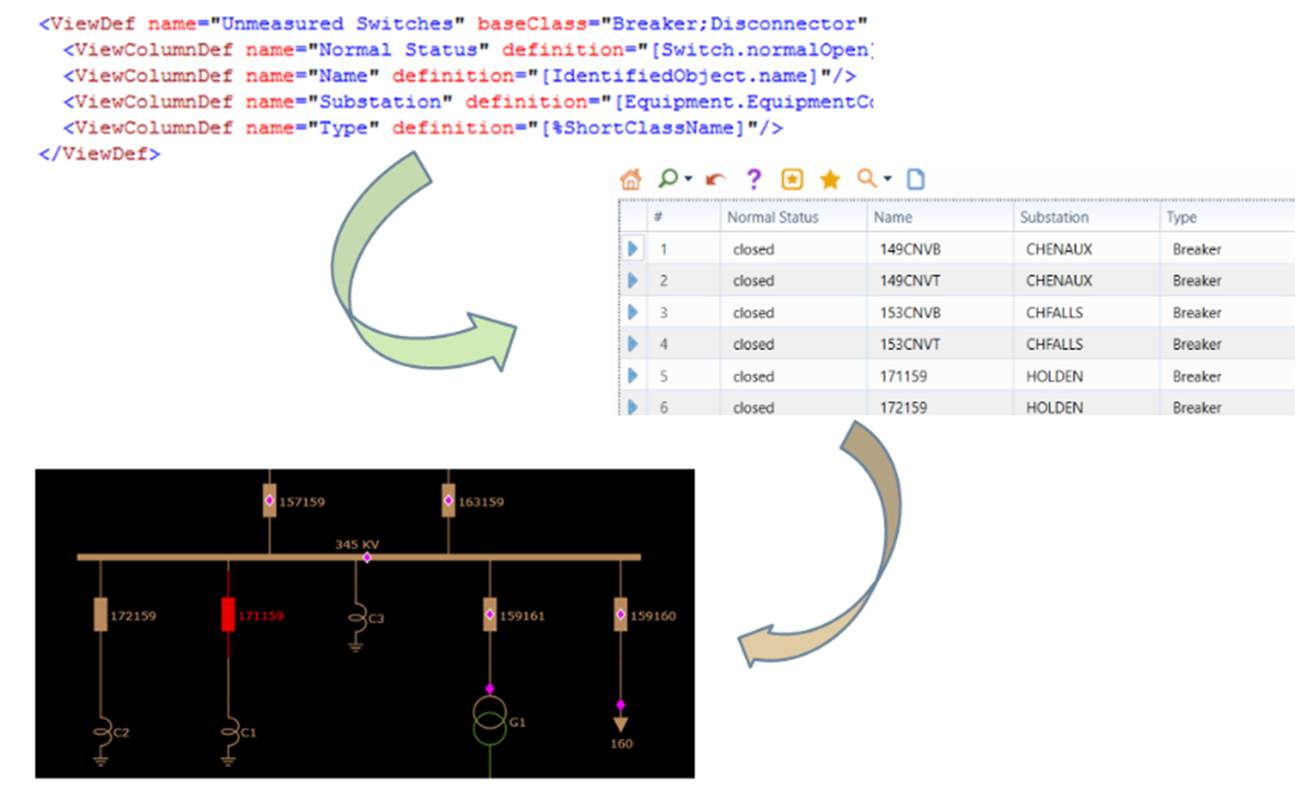
Displaying and Exporting a Custom Report
A custom report is defined using the View support in the server configuration. A View is a virtual table created during the run-time. It is quite similar to the View concept of the database. In order to support generation of the custom report, users must define a ViewDefGroup as a shared resource as illustrated below. A ViewDefGroup contains one or more ViewDefs, each defining a custom tabular display. A ViewDef contains a collection of ViewColumnDefs representing the columns in the custom tabular display.
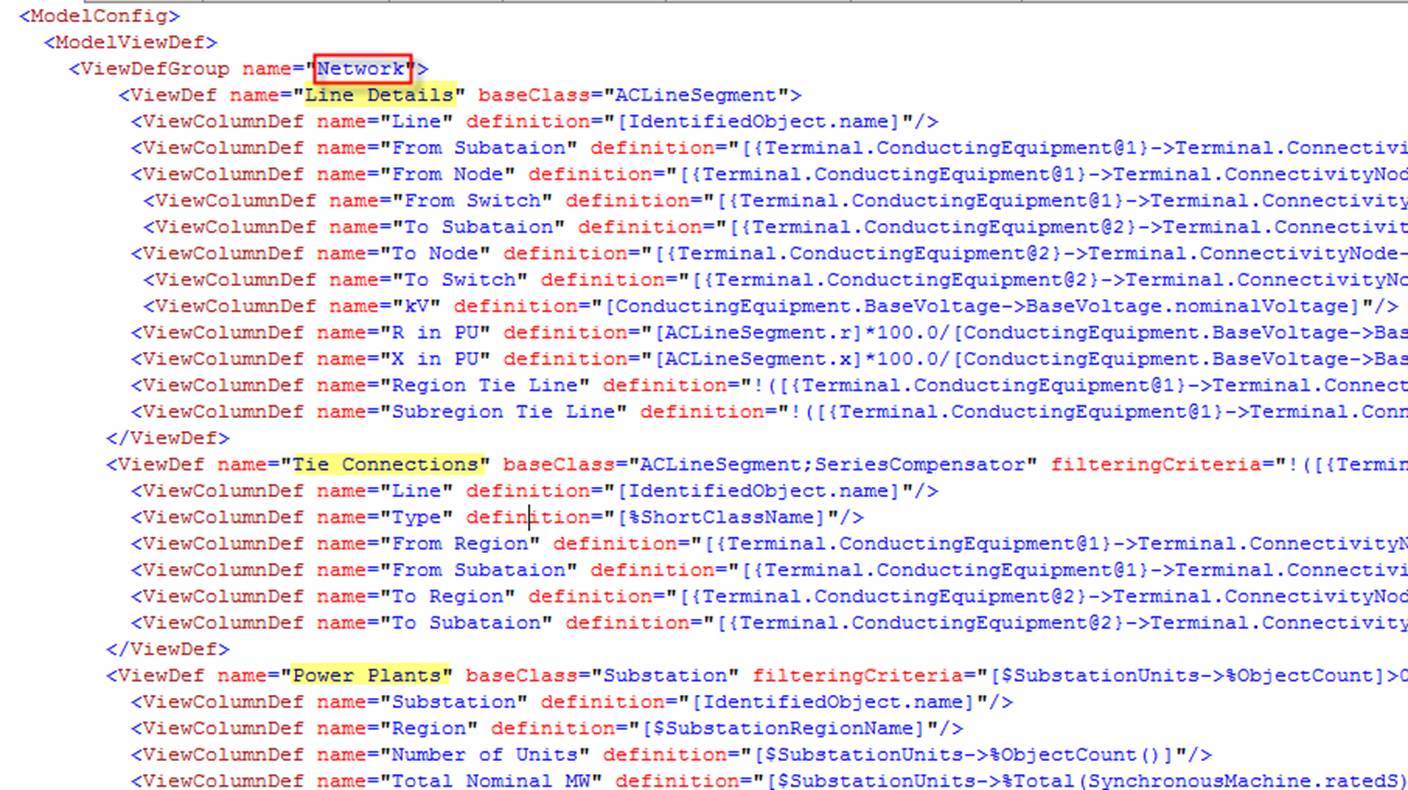
A ViewDefGroup contains the following attributes:
- Name (required): the name of the custom tabular display group. It must be unique within the application. This attribute is required.
- iconURL (optional): the icon URL which will be used to show as the menu icon in the application toolbar. Both absolute and relative path are supported. This attribute is optional.
- createIconFromText (optional): the text which will be used to create the menu icon shown in the application toolbar. The automatic icon will only be created if the iconURL is not defined or the image file specified by iconURL is not found. The automatic icon file is saved under \CIMSpy\temp directory.
Here is one example of the definition and its presentation in the toolbar.


Both iconURL and createIconFromText are defined to customize the UI to make it easier to identify the report group in the UI.
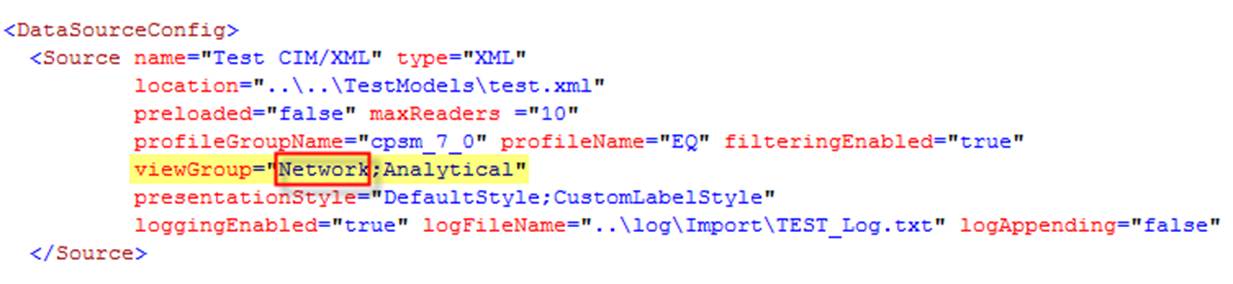
Once a ViewDefGroup is defined, users can attach it to a Data Source. Multiple ViewDefGroups can be attached to a single Data Source. They are separated by “;” and declared in the viewGroup attribute of the Source element as illustrated below.
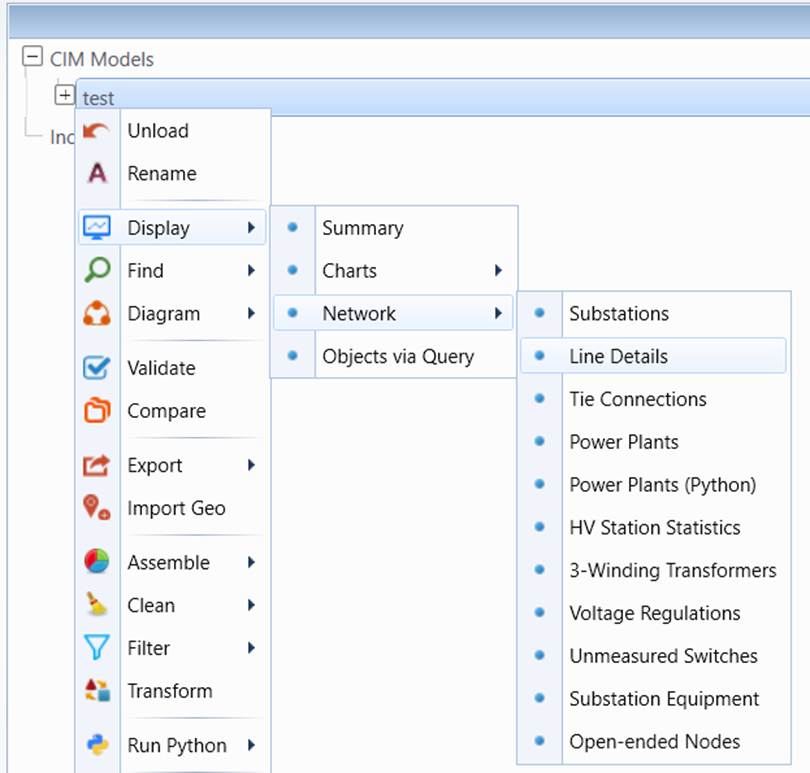
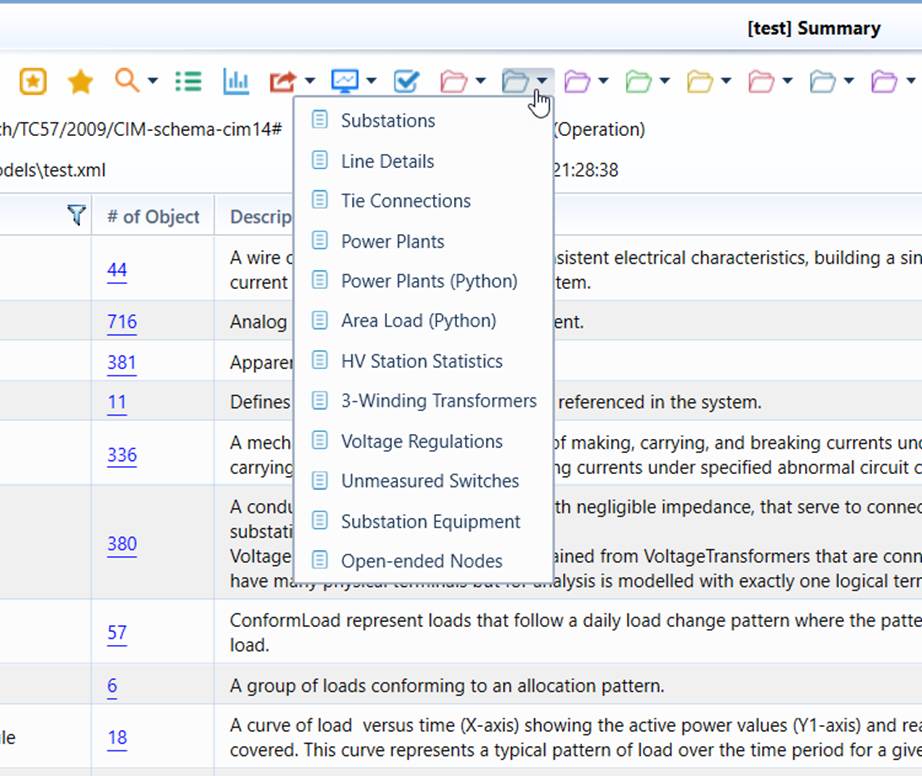
At run-time, after the model specified in the Data Source definition is loaded into the Tool, users can generate the custom tabular display from the context menu associated with the loaded model or from the dropdown icon at the Summary display, as illustrated below.
The generated tabular display can also be exported as a CSV file. Users can also export all of the custom tabular displays to a collection of CSV file by selecting “All of above” menu item as illustrated below.
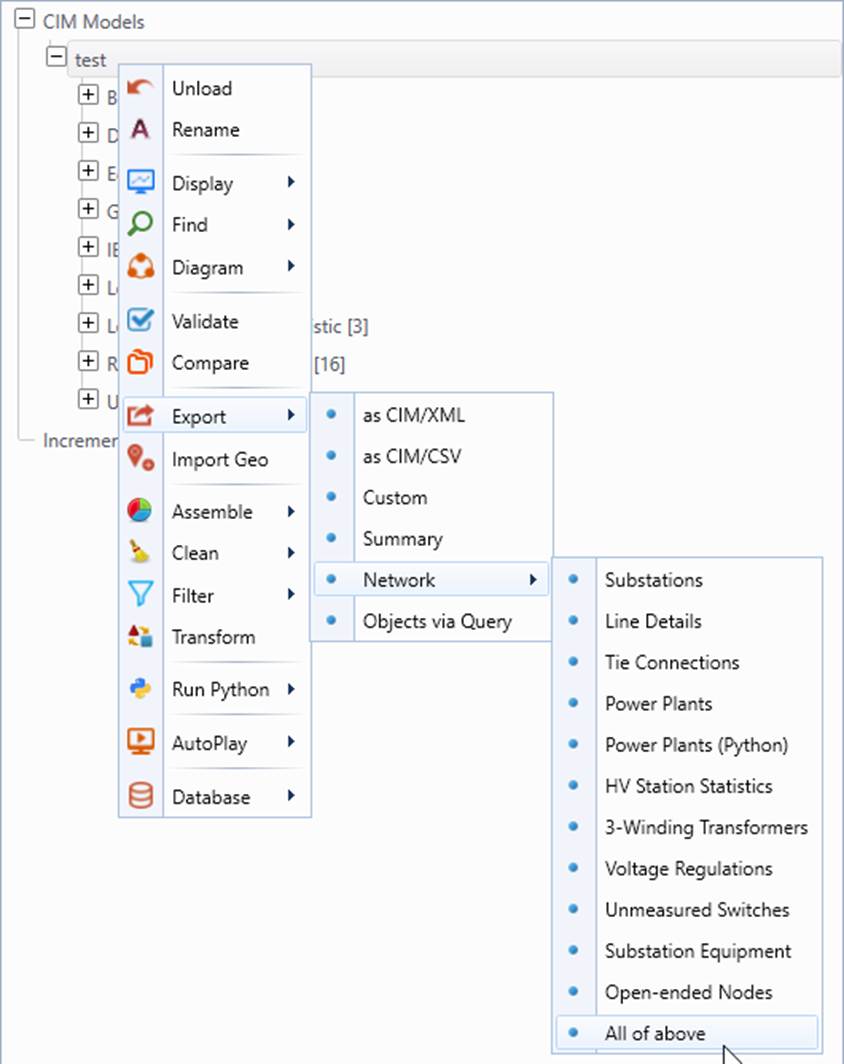
By default, the empty views will be exported as well as part of the exporting “All of above” option. User can configure the below setting “skipExportEmptyView” to ‘true’ to skip exporting the empty views.

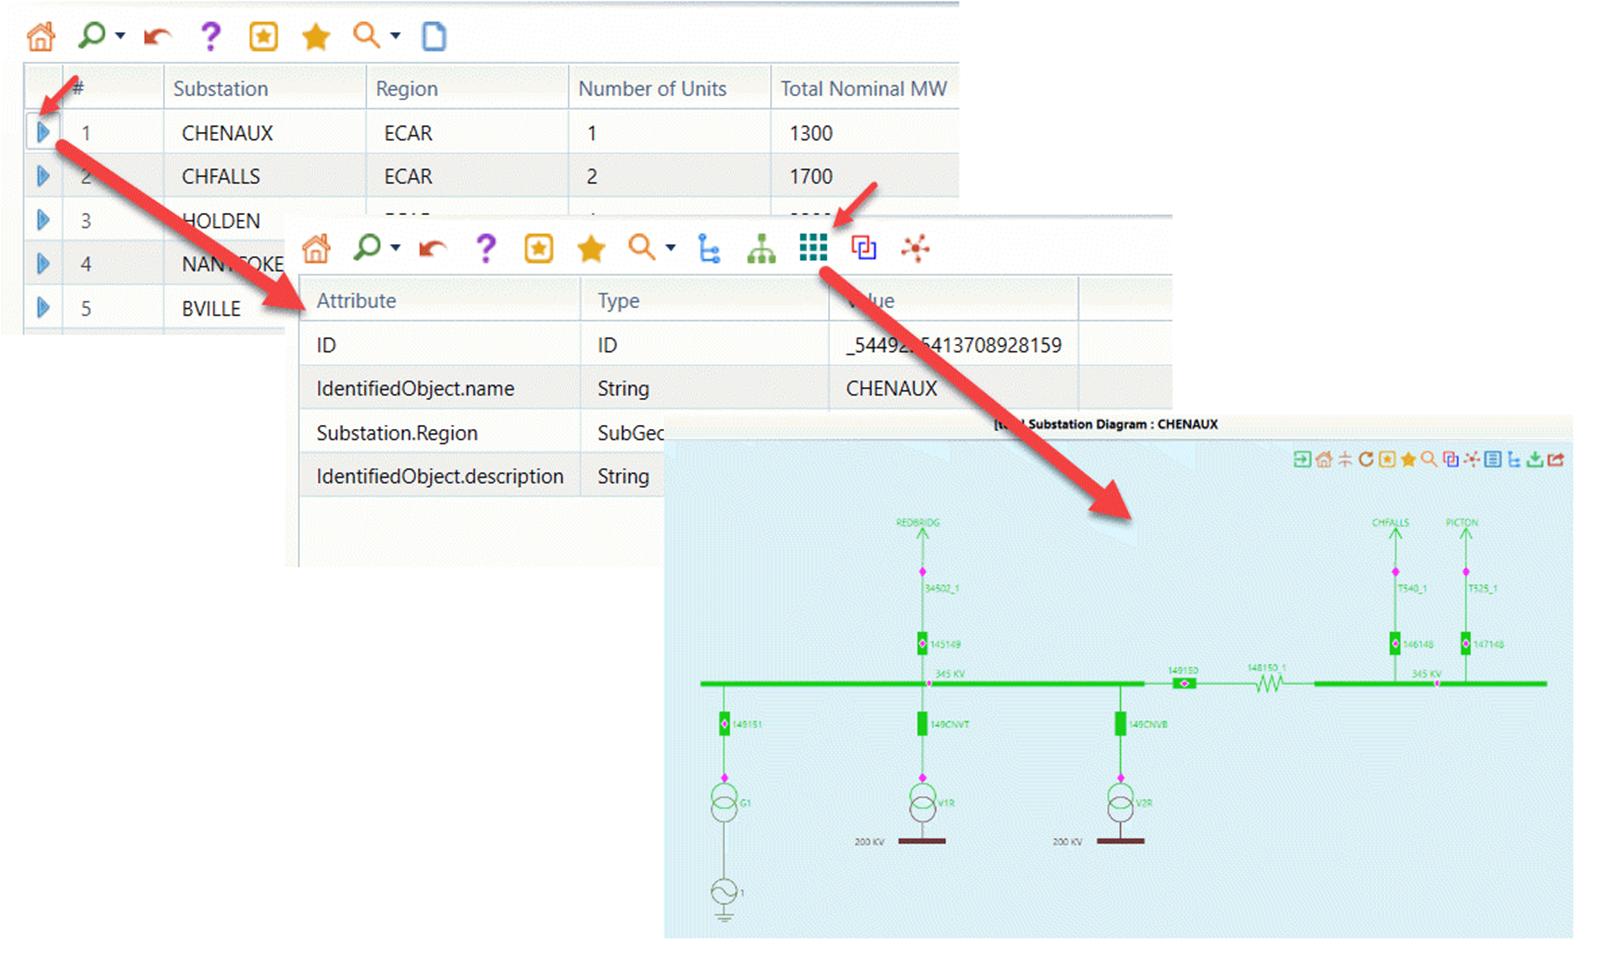
Like in a regular tabular display, each row in custom tabular display is associated with the rdf:ID of an object of the baseClass. When users double-click the selected row, the corresponding Form Display will be displayed, which will lead to a Diagram Display if the corresponding Diagram Display is available. By leveraging these built-in features, users will be able to find the information of their interest through visual data mining.
Note
It is not required to define a Data Source in order to attach a group of custom tabular displays to a model. Users can designate one or more groups of custom tabular displays as default view groups at the root element of the model configuration, i.e. ModelConfig. The default view groups will be attached to any of the loaded model, even the model is not loaded as a data source. This attribute is overloaded by viewGroup of the Source element, meaning the data source can have its own attached view groups.

Defining a Custom Tabular Display
A custom tabular display is specified by the ViewDef element with in a ViewDefGroup, as illustrated below. Each ViewDef contains multiple ViewColumnDefs representing the columns in the generated tabular display.
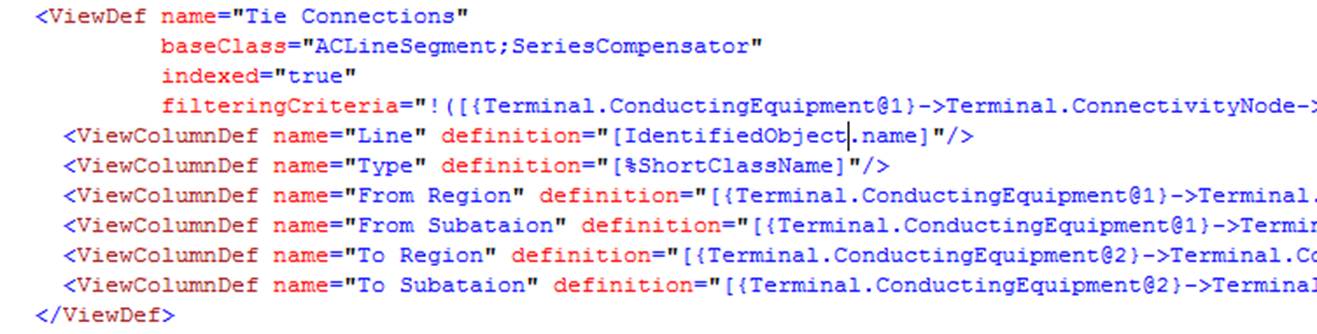
A ViewDef contains the following attributes:
- name: the name of the custom tabular display. It must be unique within a view group. This is the name displayed in the context menu and the title of the generated tabular display. This attribute is required.
- baseClass: the base class of the custom tabular display. All of the columns are defined using the specified baseClass as the starting point. The column values may be directly from the objects of the base class or the associated objects via navigation. The baseClass attribute is required if attribute byMerging is not specified. It can contain multiple class names, each separated by the “;” or could be a wild card, i.e. “*”, meaning any classes.
- byMerging: a collection of reports to be combined. This attribute is used to create a report by merging the defined ViewDefs. The names of the ViewDefs to be merged are separated by “;”. This attribute is required if attribute baseClass is not specified. ViewColumnDefs are not needed when this attribute is defined, because columns are defined by the the ViewDefs to be merged.
- show: if specified as ‘false’, this report will not be shown. This flag is used to define hidden reports which are used to create a merged report. If missing, the default value is ‘true’.
- filteringCriteria: the logical MQL expression used to filter the objects. This attribute is optional. If this attribute is specified, only those that meet the filtering criteria (i.e. the evaluated logical value is ‘true’) will be displayed in the custom tabular displays. Otherwise, all of the objects of the base class will be shown in the custom tabular display. The filteringCriteria also targets the base class. It must be a logical MQL string.
- Index: a flag indicating whether the generated tabular shall be indexed. This attribute is optional. If not specified, the default value will be ‘false’, meaning no index column will be added to the generated tabular display.
A ViewColumnDef contains two required attributes:
- name: the attribute used to define the column title.
- definition: an MQL string specifying how the column value shall be generated. This MQL string, relative to the base class, must return a value.
As an example, the following custom tabular display can be generated from the above ViewDef, which specifies a custom tabular display listing all of the tie lines and the related information.

Realizing that the MQL-based reporting support will never be complete or adequate for heterogeneous model reporting requirements, the Tool provides Python scripting support, enabling users to build their own through script programming. These scripting functions can be either embedded in MQL or plugged directly into the report.
The Tool also provides enhanced support to enable users to design a model comparison report against an incremental model generated from model comparison.
Defining MQL Alias to Facilitate Custom Display Design
The MQL strings used to define the filtering criteria and specify how the column values shall be generated could be very long, thus difficult to interpret and debug. In many cases, the MQL strings used to define various columns share significant portion of the string. MQL aliases are introduced to facilitate the MQL string authoring, enhance the readability of the MQL string, and promote the reuse of the design.
Users can define a collection of aliases, each representing a MQL sub-string. An MQL alias can embed other MQL aliases, but not itself directly or indirectly. MQL aliases are defined in the MQLAliases element and they are defined as shared resources that can be reused by any functions that use the MQL support. The MQLAliases element contains a collection of child MQLAlias elements. Each MQLAlias element contains two required attributes
- name: an alias name used to representing the a MQL substring. The MQL alias name must be pre-fixed by the “$” character when used in a host MQL string. At run-time, the MQL alias names will be replaced but its represented MQL sub-strings.
- mqlString: the represented MQL sub-string. There is no syntax restriction for the represented MQL sub-string as long as it is meaningful in the host MQL string.
The following example illustrates how 3 MQLAliases are defined and used in definition of a custom tabular display.
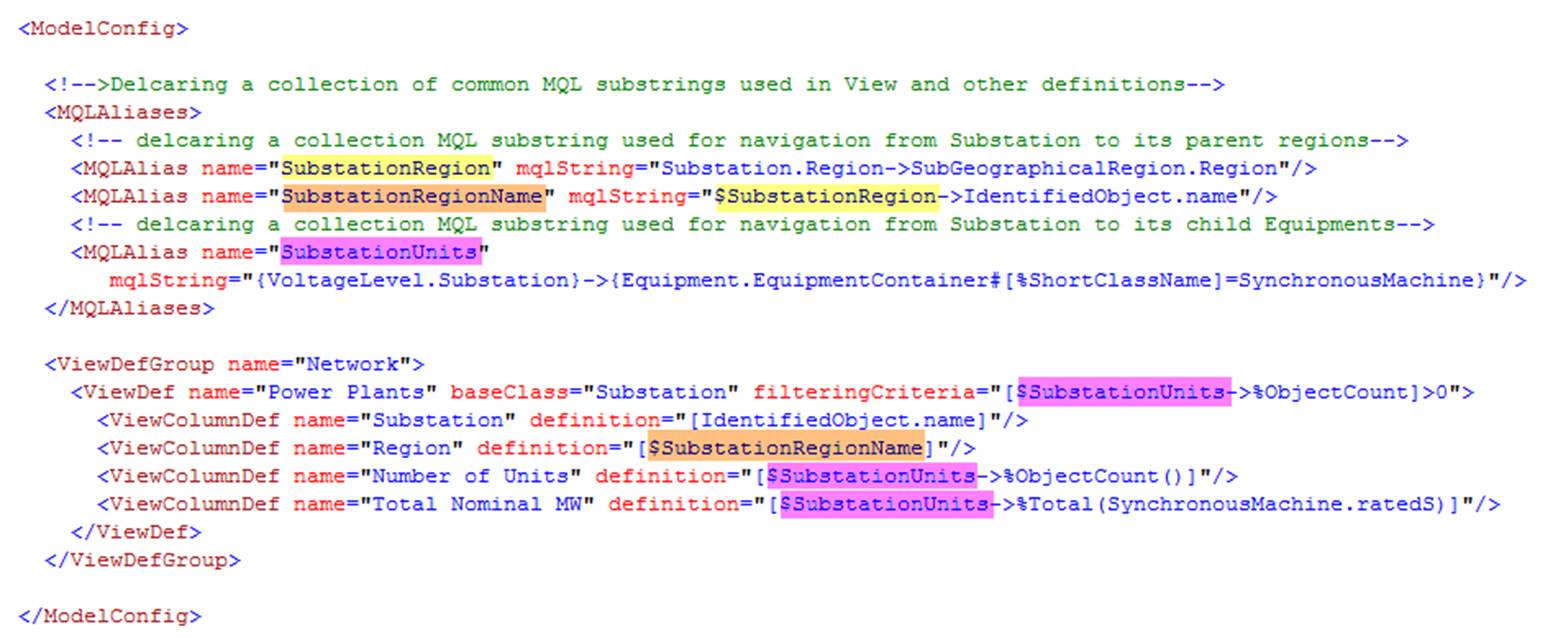
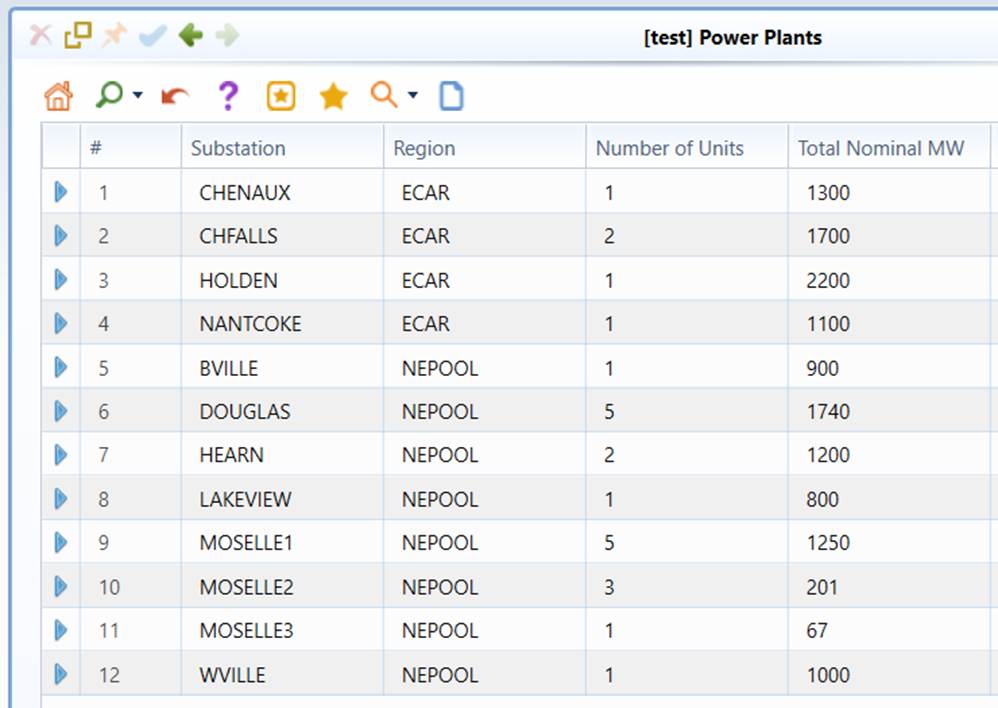
In comparison, without using MQL aliases, the same custom tabular display can be defined as follows:

In summary, use of the MQL aliases facilitates custom tabular design. Most importantly, it significantly promotes reuse of the model query.
Note
if an MQL query string is declared in an XML file, some of the above operators shall be encoded. For example, Operator ‘&&’ shall be encoded as ‘\&\&’. The following table lists five commonly used XML reserved characters and the corresponding character references.
| Character | Reference |
|---|---|
| < | \< |
| > | \> |
| & | \& |
| ' | \' |
| " | \" |
Diagram-Based Reporting
Users can also generate reports or charts directly from the Diagram. This feature allows users to graphically select an area in a line-station diagram, such as Geographical Diagrams and Neighborhood Diagrams, and generate reports or charts to intuitively analyze data, detect anomalies, and gain insights. Refer to Diagram-Based Exploratory Data Analysis for details.
Examples
See Custom Report Samples.