Usage and Customization of Rich Data Visualization
This article helps users understand how to use and customize Rich Data Visualization.
Set Active Dynamical Data
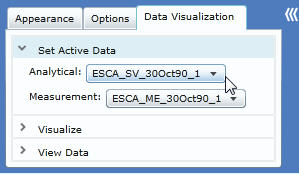
Multiple dynamical data models, such as analytic results and field measurements, can be applied to a base model containing equipment and topological connections. The Tool will automatically detect if there are any associated dynamical models and apply it to the base model when the models are loaded. Users can always load different dynamical models and apply them manually using Set Active Data menus.
- Launch User Menu and select Data Visualization tab. The default expanded section is Set Active Data. Users can click on the dropdown menu to apply Analytical (SV) or Measurement (ME) model. The diagram will be auto reloaded to apply the new data.
Understand Perceptual Visualization and Quantitative Data View
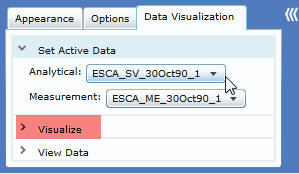
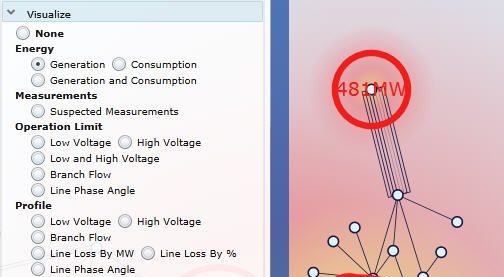
Graphical presentations, such as colors, shapes, and animations, help users recognize and analyze visual information much more quickly than they can do with numerical information. The rich data visualization features are designed to present raw data as easy-to-understand visual elements to promote the communication and interpretation, enhance the recognition of patterns, and enable users to perceptually monitor a large number of events. These perceptual visualization features are grouped under the Visualize section. Click on the section title to expand this section.
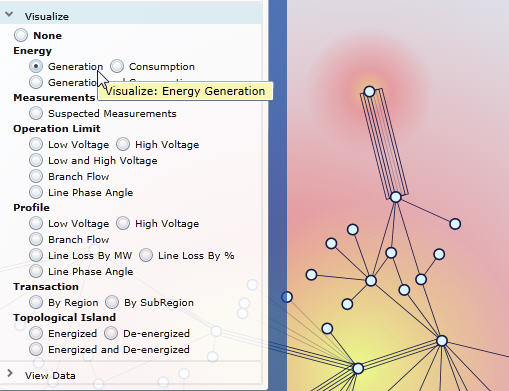
- In this sample diagram, the Energy: Generation data can be visualized by color and size of the heat map. The “hotter” and larger the influence at a station, the higher the generation output.
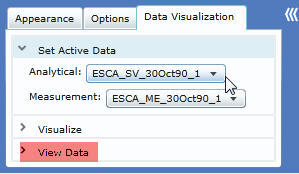
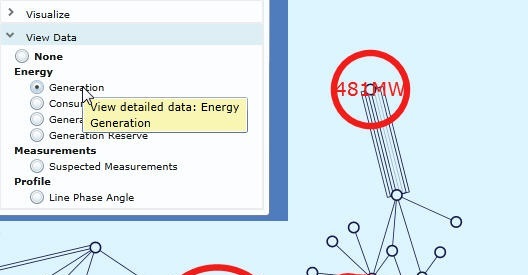
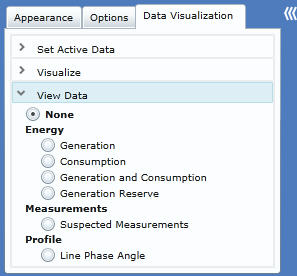
Although graphical presentations give users quick ways to interpret and “feel” the data patterns and grid conditions, users often need more accurate numeric presentation to support decision making in many cases. The rich data visualization also includes a View Data section to provide quantitative data view on top of perceptual visualization. Click on the section title to expand this section.
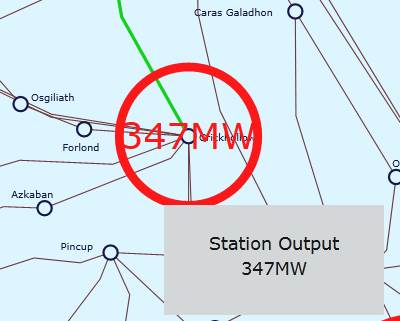
- In this sample diagram, the generation data is presented by numeric visualization technique. Users can receive both visual (the size of the circle) and quantitative (the actual MW output) information at the same time.
Users can overlap perceptual “Visualize” and quantitative “View Data” views at the same time by selecting correlated options from both sections.
Visualize Dynamical Data Perceptually
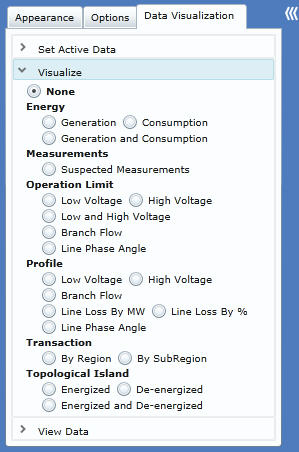
The Visualize section has the following features for various diagram types:
- Geographical/Neighborhood Diagram – for geographical and neighborhood diagram the following visualization features are supported:
- Energy: Generation – visualize energy generation output data at substation locations with the heat map. The “hotness” in color and the size of the influence is proportional to the generation output.
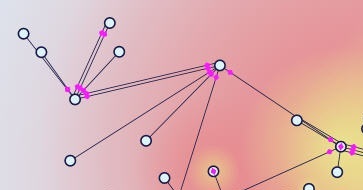
- Energy: Consumption – visualize energy consumption data at substation locations with the heat map. Instead of red-hot color, a dark-blue-cold color is used to simulate power drain. The larger and darker the influence, the bigger the consumption.
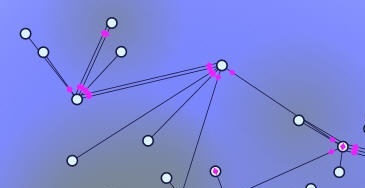
- Energy: Generation and Consumption – visualize both energy generation and consumption at the same time.
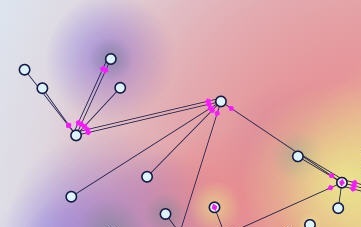
- Measurements: Suspected Measurements – visualize the intensity of bad (suspected) measurements (by comparing measurement with state estimation results) with the heat map. Similar to Energy Generation, the hotter and bigger the influence, the higher the bad measurement count.
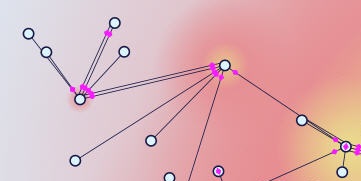
- Operation Limit: Low Voltage – visualize substations below the low voltage limit with the heat map. The severity or heat map intensity is proportional to the absolute margin value over the limit.
- Operation Limit: High Voltage – visualize substations above the high voltage limit with the heat map. The severity or heat map intensity is proportional to the absolute margin value over the limit.
- Operation Limit: Low and High Voltage – visualize a combination of over-limit substations.
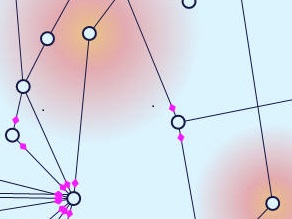
- Operation Limit: Branch Flow – visualize over-limit ratio of line apparent power over power limit, or current amp over current amp rating. Over-limit lines will be highlighted with red color.
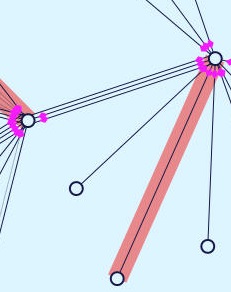
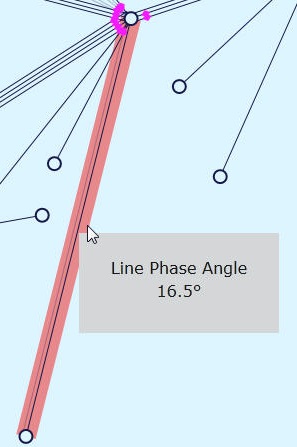
- Operation Limit: Line Phase Angle – visualize over-limit line phase angle. Over-limit lines will be highlighted with red color. Mouse over will display the angle value.
- Profile: Low Voltage – visualize system health related to low voltage limit at substation locations using fuzzy visualization technique. Three colors (green - healthy, yellow - warning, and red - alarming) are blended with user-defined profile settings from configuration. More red color means the voltage is closer to the low limit and more green color means the voltage is normal and further away from the limit. Mouse over the colored area will display numeric data.
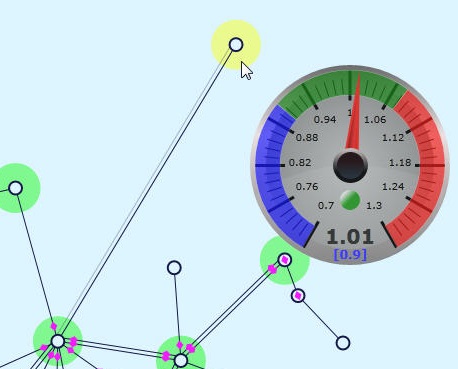
- Profile: High Voltage – visualize system health related to high voltage limit at substation locations using fuzzy visualization technique. Three colors (green - healthy, yellow - warning, and red - alarming) are blended with user-defined profile settings from configuration. More red color means the voltage is closer to the high limit and more green color means the voltage is normal and further away from the limit. Mouse over the colored area will display numeric data.
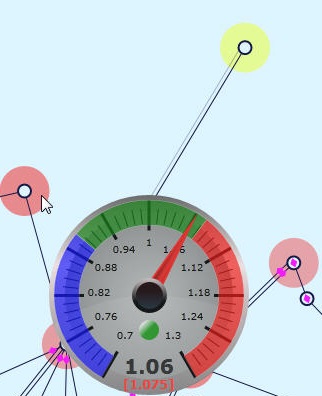
- Profile: Branch Flow – visualize system health related to the ratio of either line apparent power over power limit or current amp over current amp rating using fuzzy visualization technique. Three colors (green - healthy, yellow - warning, and red - alarming) are blended with user-defined profile settings from configuration. More red color means the line is operating closer to the power or current limit and more green color means the power or current is normal and further away from the limit. Mouse over the colored area will display numeric data.
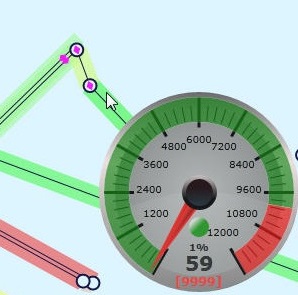
- Profile: Line Loss By MW – visualize line loss in absolute MW value using fuzzy visualization technique. Three colors (green - normal, yellow - warning, and red - alarming) are blended with user-defined profile settings from configuration. More red color means the loss is higher and more green color means the loss is lower. Mouse over the colored area will display numeric data.
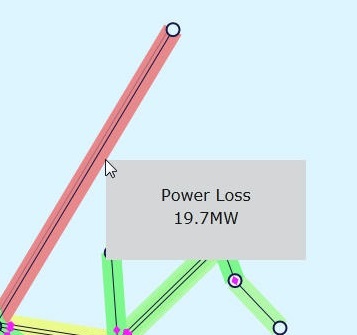
- Profile: Line Loss By % – visualize line loss ratio over power rating using fuzzy visualization technique. Three colors (green - normal, yellow - warning, and red - alarming) are blended with user-defined profile settings from configuration. More red color means the loss ratio is higher and more green color means the loss ratio is lower. Mouse over the colored area will display numeric data.
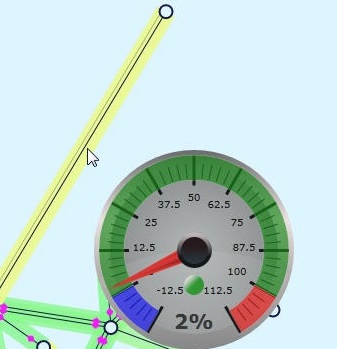
- Profile: Line Phase Angle – visualize line phase angle in degree using fuzzy visualization technique. Three colors (green - normal, yellow - warning, and red - alarming) are blended with user-defined profile settings from configuration. More red color means the phase angle is bigger and more green color means the phase angle is smaller. Mouse over the colored area will display numeric data.
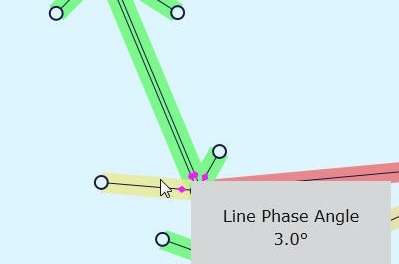
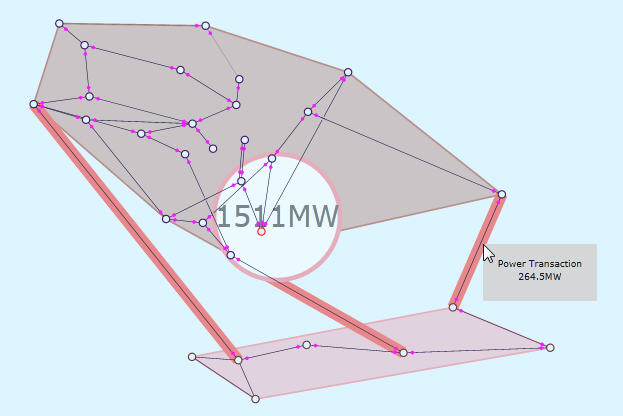
- Transaction: By Region – visualize regional boundaries, tie-lines and power transaction data among regions through animation. Mouse over tie-lines will display numeric transactional data for the selected tie-line.
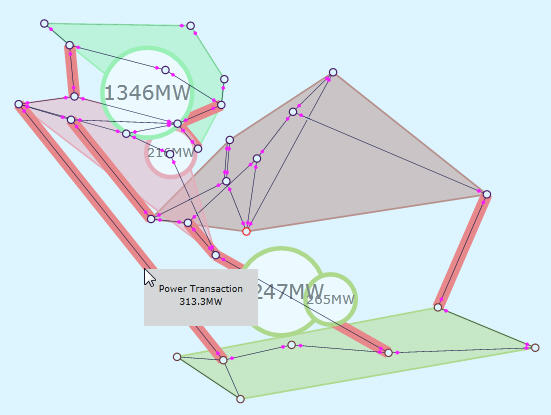
- Transaction: By SubRegion – visualize sub-regional boundaries, tie-lines and power transaction data among sub-regions through animation, similarly to transaction by region.
- Topological Island: Energized – visualize topological island boundaries containing energized substations.
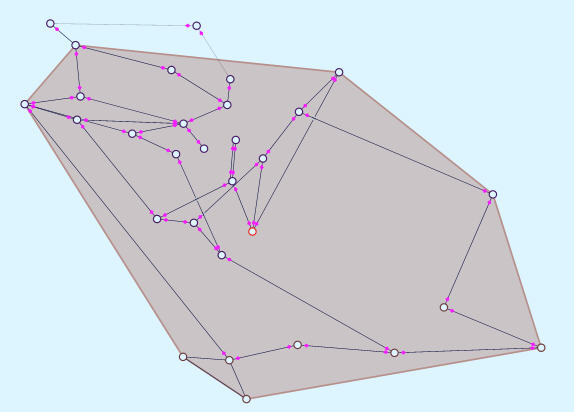
- Topological Island: De-energized – visualize topological island boundaries containing de-energized substations.
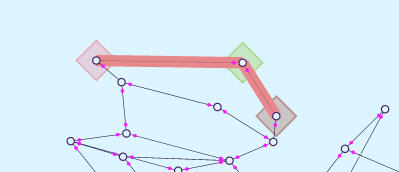
- Topological Island: Energized and De-energized – visualize both energized and de-energized topological island boundaries.
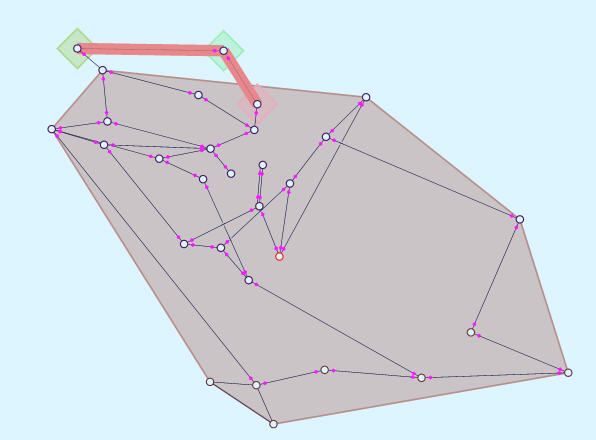
- Substation/Equipment Diagram – for substation and equipment diagram the following visualization features are supported:
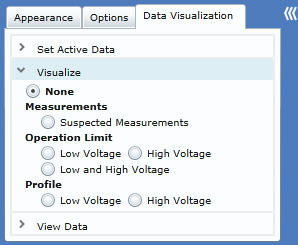
- Measurements: Suspected Measurements – visualize the measurement locations of bad measurements (by comparing measurement with state estimation results) with a fixed-size heat map highlight. Users must turn on measurement location display in user menu.
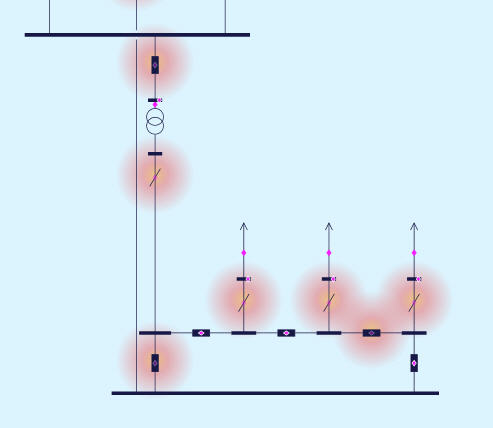
- Operation Limit: Low Voltage – visualize equipment with voltage below the low limit with the heat map at the center of the equipment. The severity or heat map intensity is proportional to the absolute margin value over the limit.
- Operation Limit: High Voltage – visualize equipment with voltage above the high voltage limit with the heat map at the center of the equipment. The severity or heat map intensity is proportional to the absolute margin value over the limit.
- Operation Limit: Low and High Voltage – visualize a combination of equipment with voltage below the low voltage limit or above the high voltage limit in the same diagram.
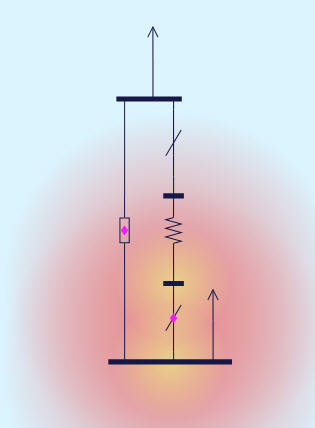
- Profile: Low Voltage – visualize system health related to low voltage limit at the center of the equipment using fuzzy visualization technique. Three colors (green - healthy, yellow - warning, and red - alarming) are blended with user-defined profile settings from configuration. More red color means the voltage is closer to the low limit and more green color means the voltage is normal and further away from the limit. Mouse over the colored area will display numeric data.
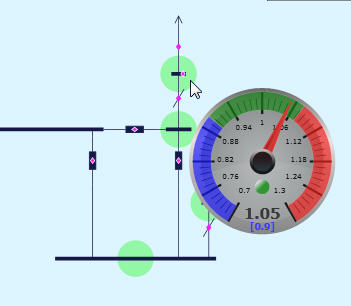
- Profile: High Voltage – visualize system health related to high voltage limit at the center of the equipment using fuzzy visualization technique. Three colors (green - healthy, yellow - warning, and red - alarming) are blended with user-defined profile settings from configuration. More red color means the voltage is closer to the high limit and more green color means the voltage is normal and further away from the limit. Mouse over the colored area will display numeric data.
Visualize Dynamical Data Quantitatively
Let’s look at the View Data section in details.
- Geographical/Neighborhood Diagram – for geographical and neighborhood diagram the following quantitative visualization features are supported:
- Energy: Generation – visualize energy generation output data at substation locations with numeric value in red circle. Size of the circle is proportional to the numeric value. Mouse over will display value in clear text.
- Energy: Consumption – visualize energy consumption data at substation locations with numeric value in blue circle. Size of the circle is proportional to the numeric value. Mouse over will display value in clear text.
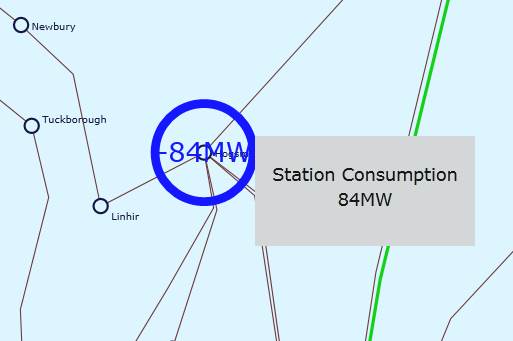
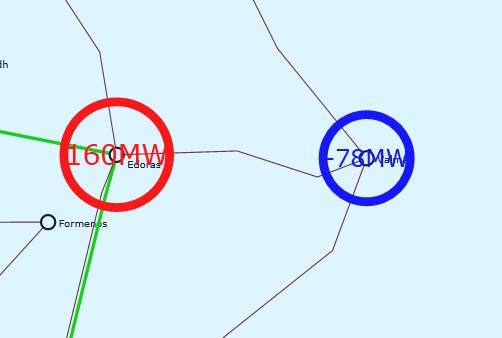
- Energy: Generation and Consumption – visualize both energy generation and consumption numeric presentation at the same time.
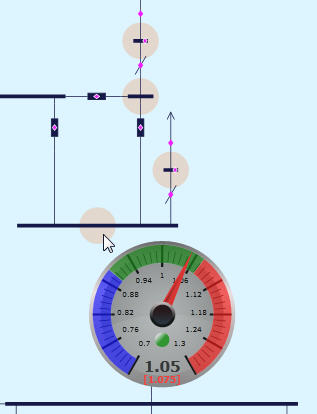
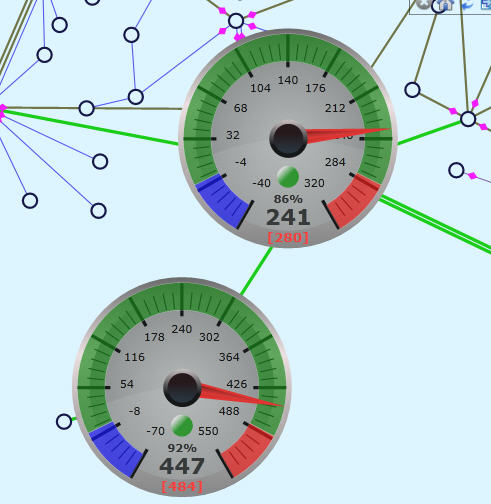
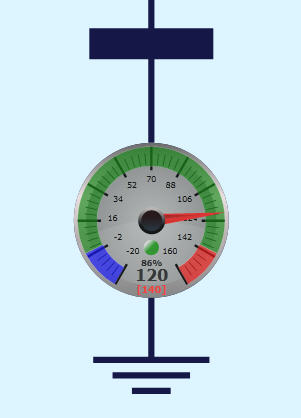
- Energy: Generation Reserve – visualize energy generation output data with respect to capacity limit at substation locations in a speedo meter, showing user-defined ranges. Meter displays both analog and digital value and limits. Mouse over will hide the meter and show the station underneath.
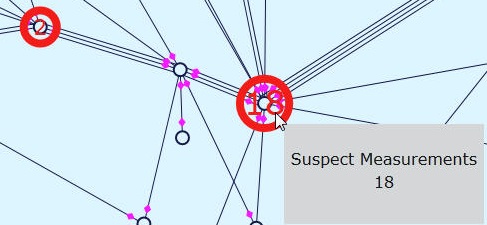
- Measurements: Suspected Measurements – visualize the number of bad measurements (by comparing measurement with state estimation results) at substation locations. Mouse over will display numeric value in clear text.
- Profile: Line Phase Angle – visualize numeric line phase angle value in degree with red highlighted background. The size of the text block is proportional to the numeric value.
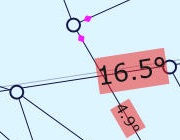
- Substation/Equipment Diagram – for substation and equipment diagram the following quantitative visualization features are supported:
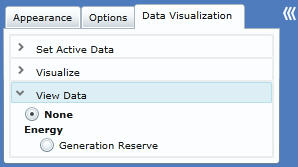
- Energy: Generation Reserve – visualize energy generation output data with respect to capacity limit at center of the generator equipment in a speedo meter, showing user-defined ranges. Meter displays both analog and digital value and limits.
Customize Rich Data Visualization
Rich data visualization uses various graphical visualization techniques including: heat map, fuzzy color and graphical text presentations, to help grid operators to understand the system conditions and alarming events. The system characteristics regarding normal, warning, alarming levels, for example, are different from one utility to another. There are no one-size-fit-all settings. Users are given flexibility to customize visualization settings to fit their own needs. This is accomplished by changing Presentation Style under RichDataVisStyle >> RichDataVisualization. In RichDataVisualization section, there are a few visualization type elements: HeatMap, TextDataLine, MeterGauge, and ColorMap. They are applied to each visualization feature with applyTo attribute. In most cases, users should only change the attributes of the child setting elements, such as NumberOfPointsShown -> value, Color -> hex, or Color -> cutoffMaxInclusive. Let’s look at each visualization type in details.
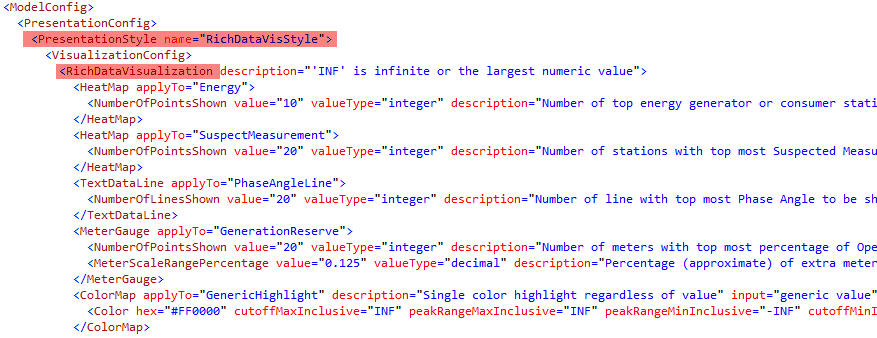
- HeatMap – HeatMap is used in a few visualization features. In Energy (both generation and consumption) and Measurement: Suspected Measurement, there are often too many HeatMap points to be clearly displayed in the diagram. Users could set the maximum number of points (NumberOfPointsShown) to be displayed at the same time. The points with the highest intensity (generation output or bad measurement count) will be displayed first. The default value is 10 and 20 respectively.
- Note: the respective Quantitative Data Views for Energy and Bad Measurement are also governed by these settings. The number of circles with numeric value is the same as that of the HeatMap points.

- TextDataLine – TextDataLine is used in Quantitative Data View of Profile: Line Phase Angle, the phase angle value displayed in text along the line. Users could set the maximum number of lines (NumberOfLinesShown) whose phase angels will be displayed at the same time. The largest phase angles will be displayed first. The default value is 20.

- MeterGauge – MeterGauge (Speedo Meter display) is used in a few visualization features. For displaying Quantitative Data View of Energy: Generation Reserve, there can be too many meters to be clearly displayed in the diagram at the same time. Users could set the maximum number of meters (NumberOfPointsShown) to be displayed at the same time. The highest generation output will be displayed first. The default value is 20. Optionally, users could also set the ratio of extra scale range beyond the limit (MeterScaleRangePercentage). This extra range is used to display over-limit value. If not defined, the default value is 0.125 or 12.5%.

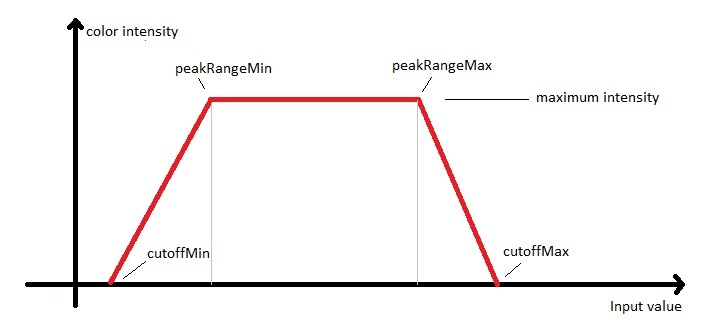
- ColorMap – ColorMap is used in all color visualization features, including simple highlighting and fuzzy color presentation. It can be applied to either points or lines. Within ColorMap, one or more Color elements can be defined. A fuzzy color presentation will take the blended effects from all color components. Take a example of the LineLossMW color definition shown below: the alarming red color takes full effect above 10MW loss. From 10MW to 5MW, it gradually loses effect. The warning yellow color takes the opposite trend in the range. There is no red alarming effect after 5MW. Warning yellow takes full effect between 5MW and 3MW and loses effect after that. The normal green starts to take effect from 3MW and reaches maximum effect between 1MW and 0MW. All negative losses, excluding 0MW, are shown with out-of-range blue color.

- Color Element – Each Color element controls a color component. The Color element has 5 user defined attributes. (Use INF for the positive largest value and -INF for the negative largest value)
- hex – the standard color RGB definition is hex value.
- cutoffMaxInclusive or cutoffMaxExclusive – the upper limit of the input value range. If input value is larger than this value, this color will have no effect in the fuzzy color blend. Inclusive and Exclusive decides if this cutoff value is part of the range, which is important for color highlight.
- peakRangeMaxInclusive or peakRangeMaxExclusive – peak range is the range of input value, where the color has the maximum effect in the fuzzy color blend. peakRangeMax defines the upper bound of this range. Similarly Inclusive and Exclusive decides if this value is part of the range.
- peakRangeMinInclusive or peakRangeMinExclusive – defines the lower bound of the peak range, beyond that the color loses maximum effect. Similarly Inclusive and Exclusive decides if this value is part of the range.
- cutoffMinInclusive or cutoffMinExclusive – the lower limit of the input value range, beyond that the color will have no effect in the fuzzy color blend. Similarly Inclusive and Exclusive decides if this value is part of the range.
- Single Color Highlight – for highlighting either a point or a line, only one Color component is needed. Normally, a limit is defined by both cut-off and peak-range value. Any input value greater or smaller than the limit will be highlighted in color. In the following LineAngleLimit example: the line will be highlighted in red color if the angle value is larger than 15 degree.

- Supported Visualization Features:
- GenericHighlight – no upper or lower limit. Point or line will always be highlighted if applied. Used on transaction tie-lines.
- LowKVMargin – define fuzzy color profile for low voltage.
- HighKVMargin – define fuzzy color profile for high voltage.
- LinePowerLimit – highlight lines with over-limit power.
- LinePower – define fuzzy color profile for line power ratio over rating limit.
- LineLossMW – define fuzzy color profile for line loss in MW.
- LineLossPercentage – define fuzzy color profile for line loss in percentage ratio over rating limit.
- LineAngleLimit – highlight lines with over-limit phase angle.
- LineAngle – define fuzzy color profile for line phase angle.