Choosing What to Display
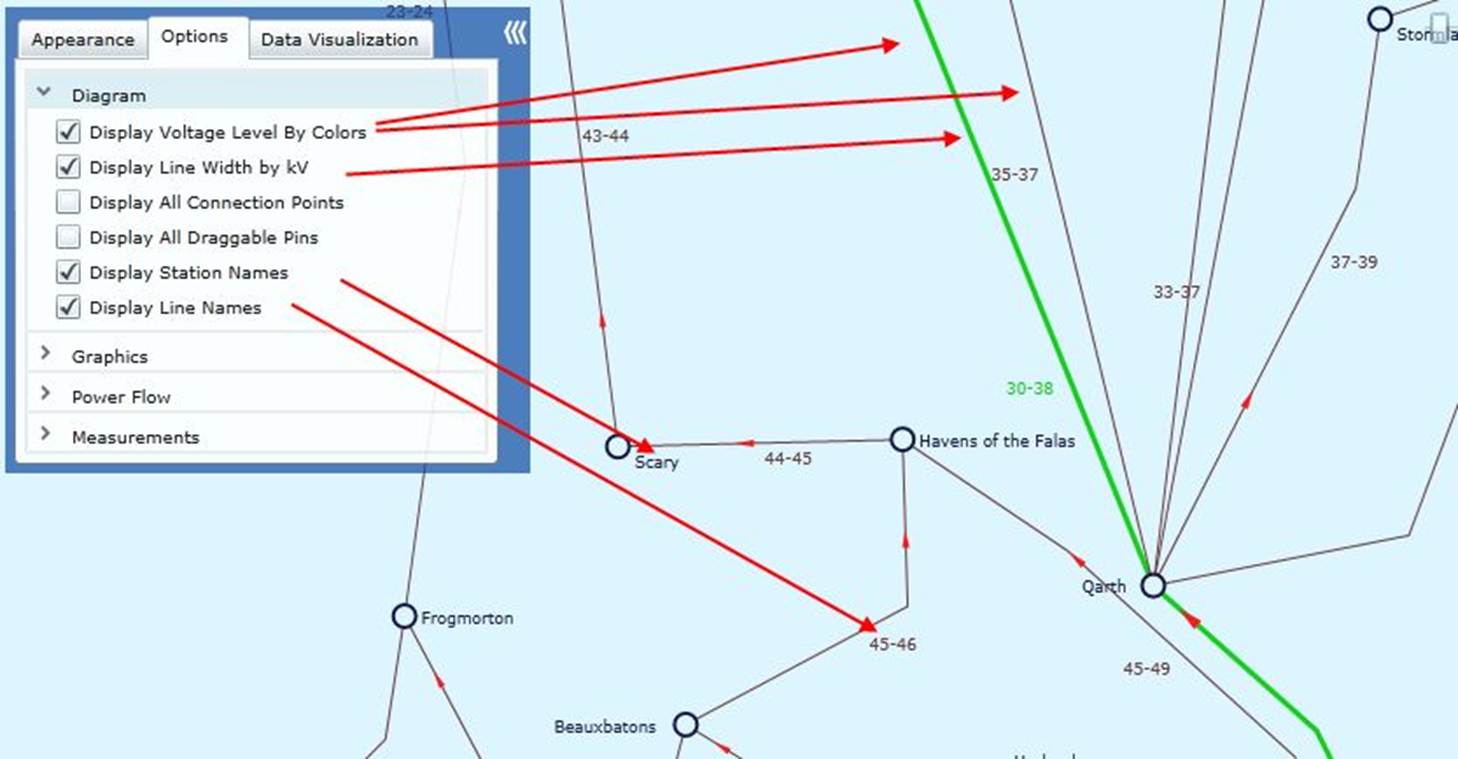
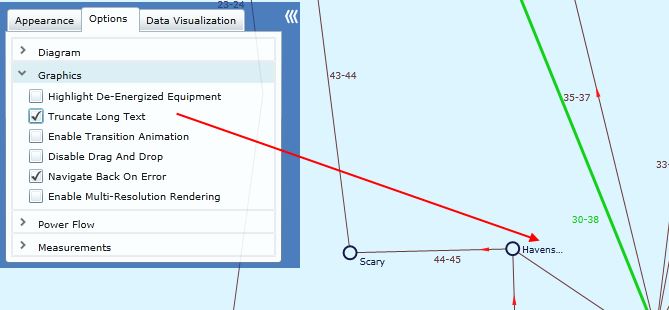
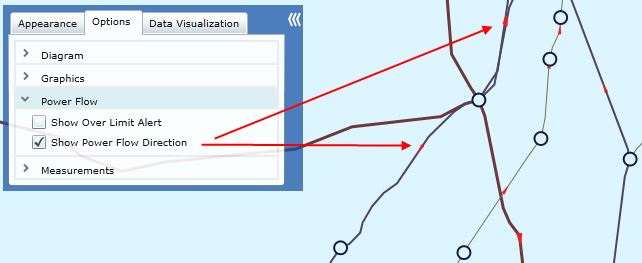
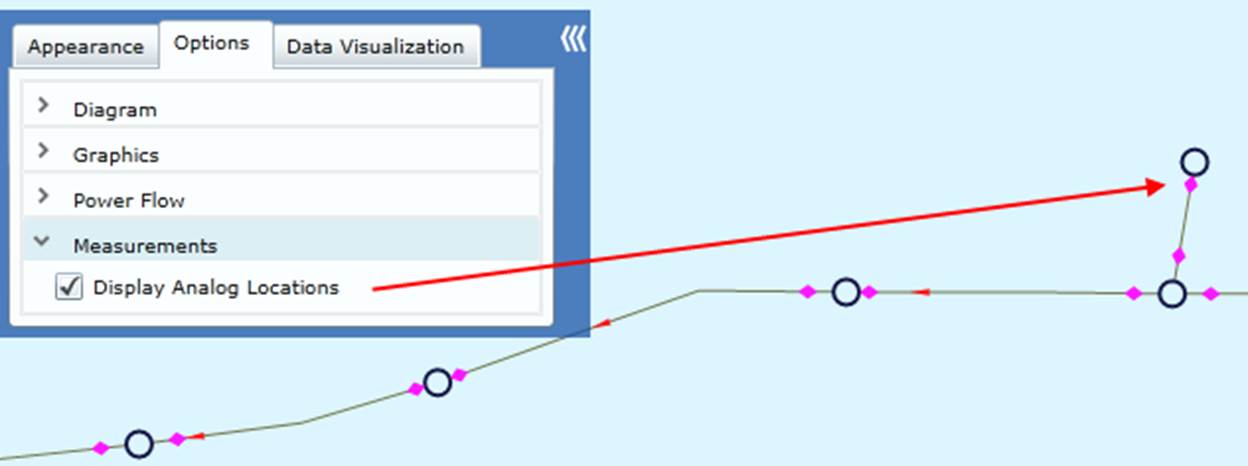
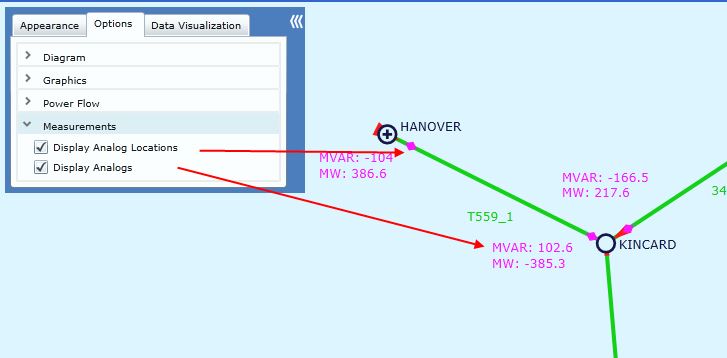
Presenting all of the information in one visual display at once will result in “information overload”. The Tool provides a variety of options to prevent information from being overloaded while still enabling users to find highly detailed information when needed. By selecting what information to display from the Option tab in the diagram control panel, as illustrated below, users can optimize the generated diagram to meet their specific needs.
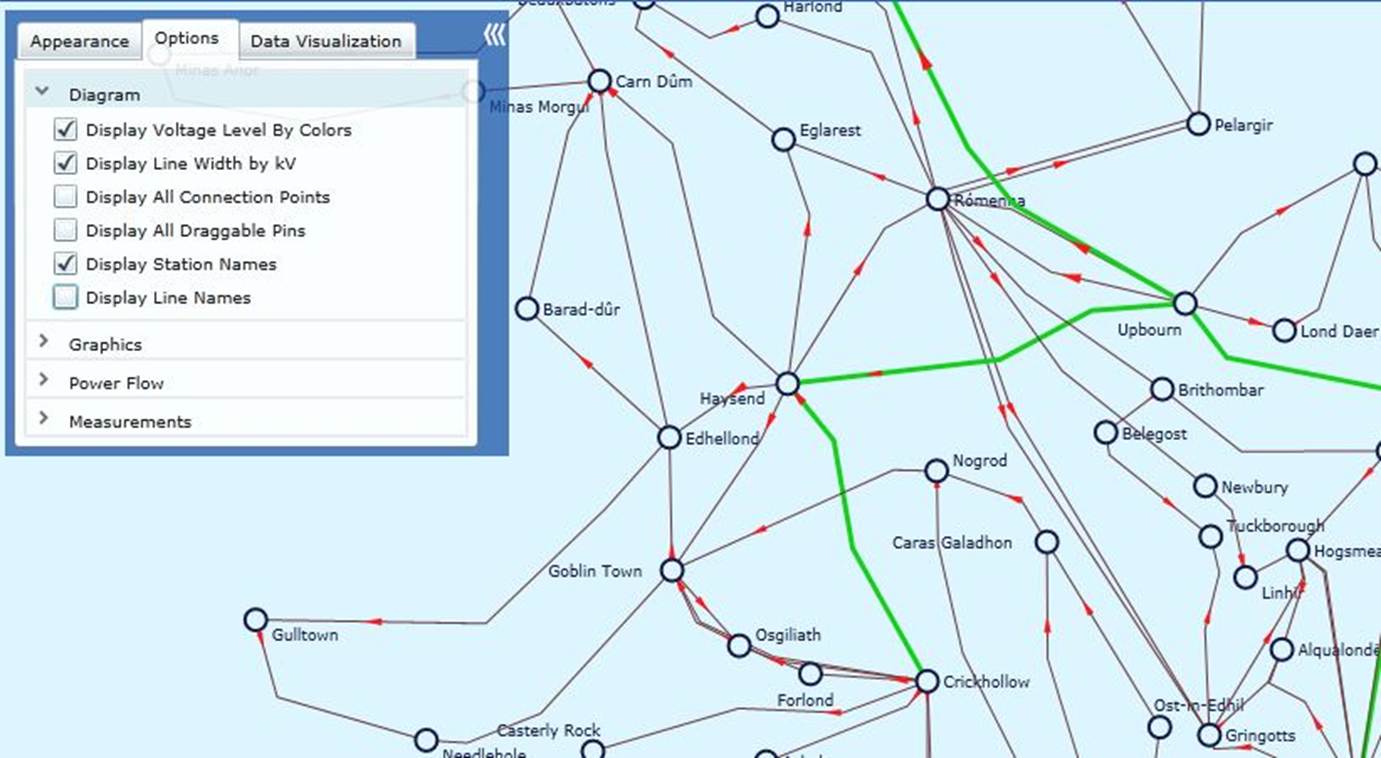
The display options supported are classified into four groups:
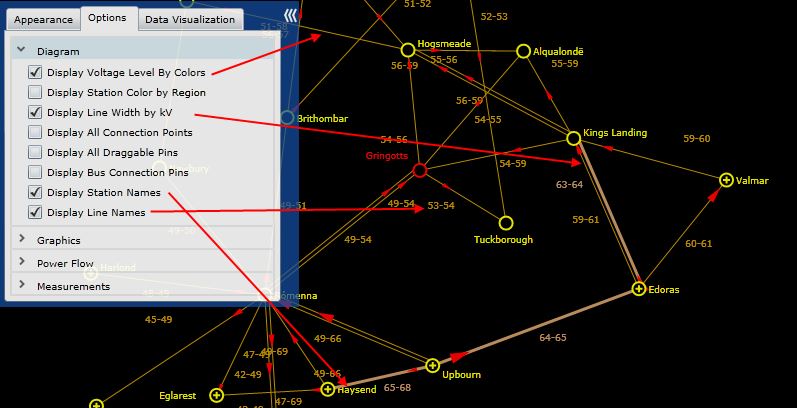
- Diagram: This group contains the display options for static equipment model.
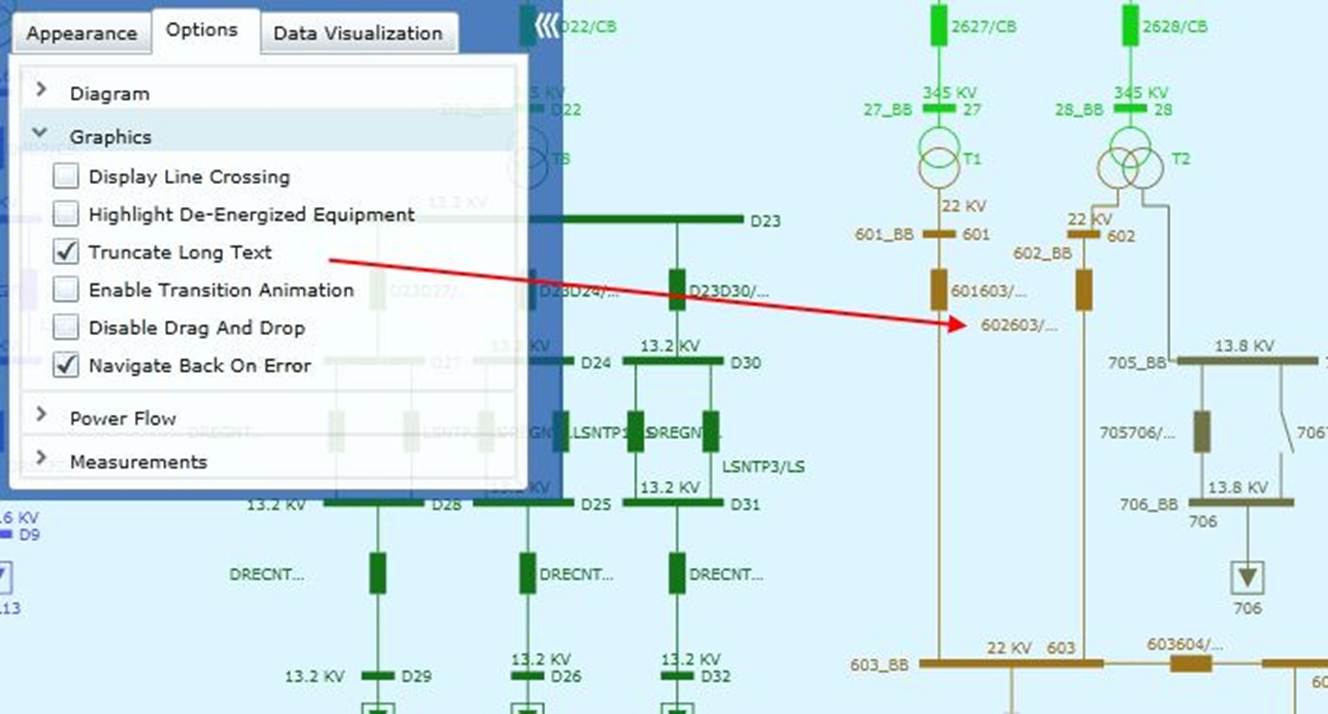
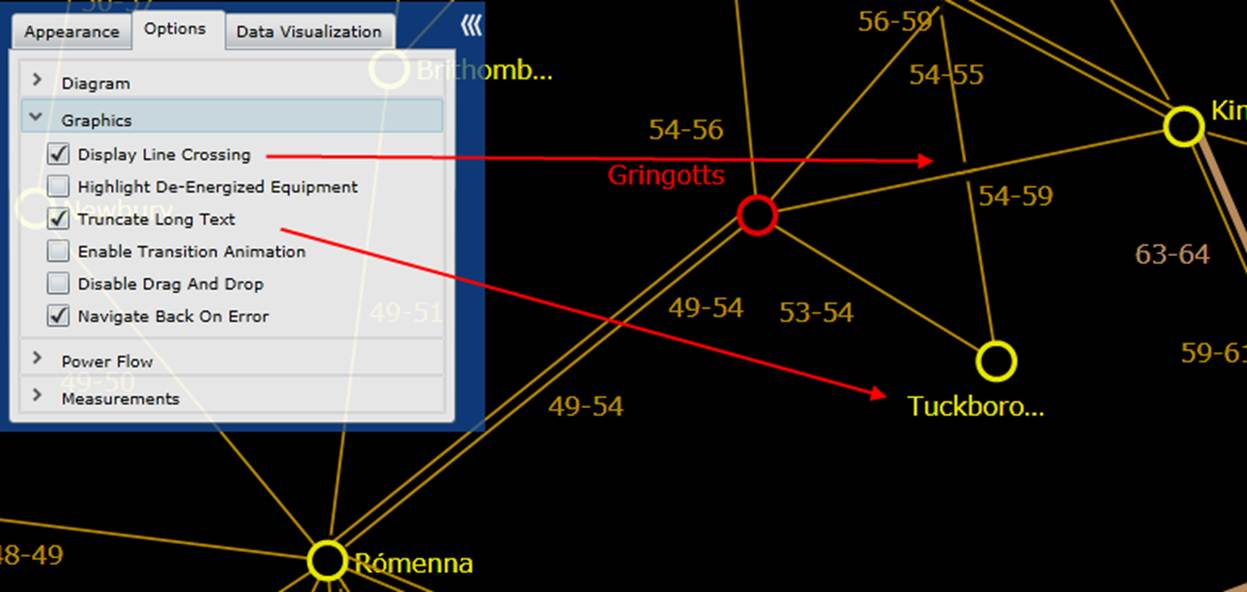
- Graphics: This group contains additional options mainly for graphical behavior.
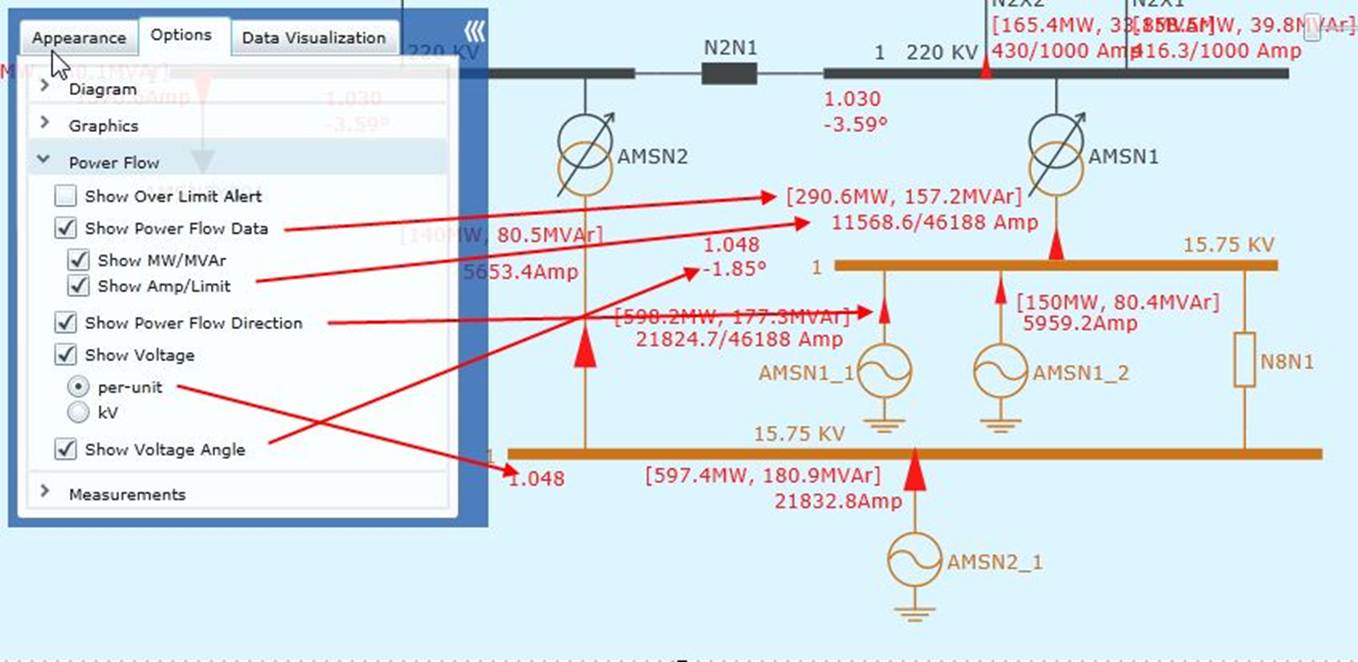
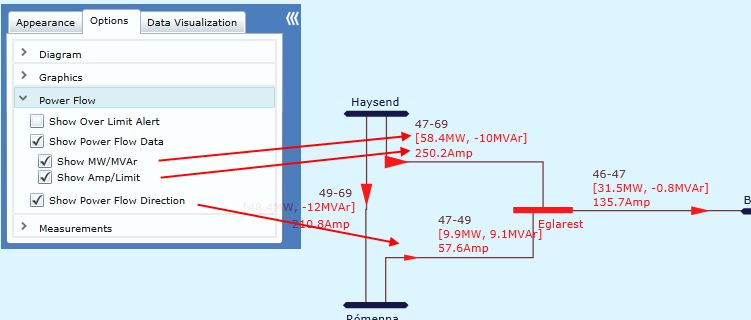
- Power Flow: This group contains the options for displaying power flow results if available.
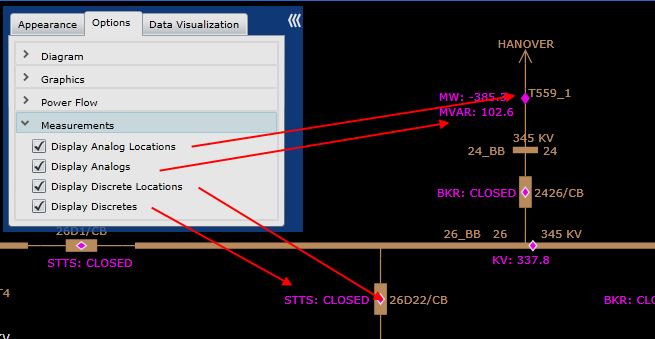
- Measurements: This group contains the options for displaying measurements (if available) on top of the generated diagrams.
The display options are context-sensitive. Depending on the type of the current diagram, the controllable display options may vary.
The following section uses the screenshots to illustrate the display options for various types of diagrams.
Substation/Equipment Diagram
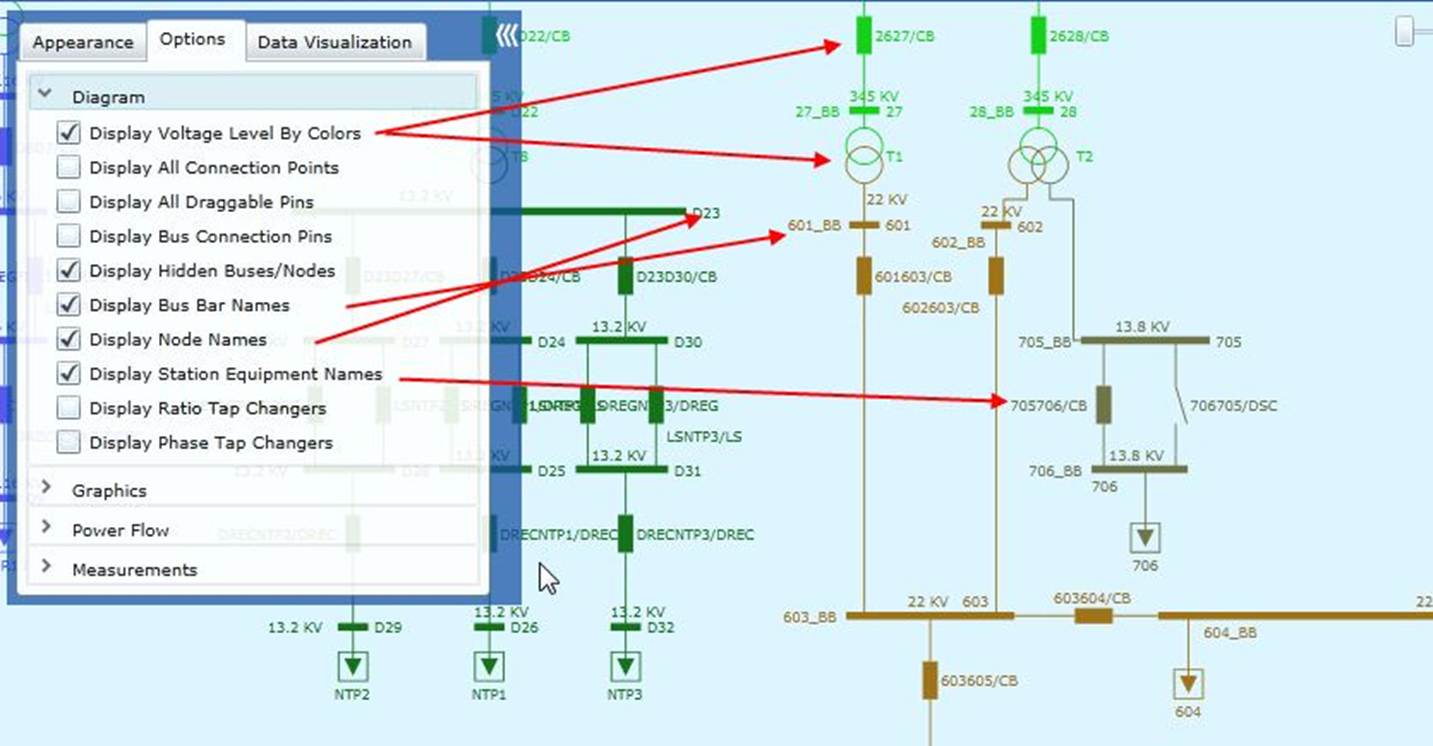
Newly added display options are “Display Hidden Buses/Nodes”, “Display Bus Bar Name” and “Display Node Names”. When checked, “Display Hidden Buses/Nodes” displays all connectivity nodes in the diagram. Users also can view their names by checking “Display Node Names”. “Display Bus Bar Name” is used to display the names of the bus bars that are associated to the connectivity nodes.
Neighborhood Diagram
Geographical Diagram