Power Flow Reporting
This feature is designed to report power flow results from different perspectives and support visual data mining.
Hands-On (Required)
Take Hands-on Lab 6 from Power Flow Tutorial.
Displaying Power Flow Reports
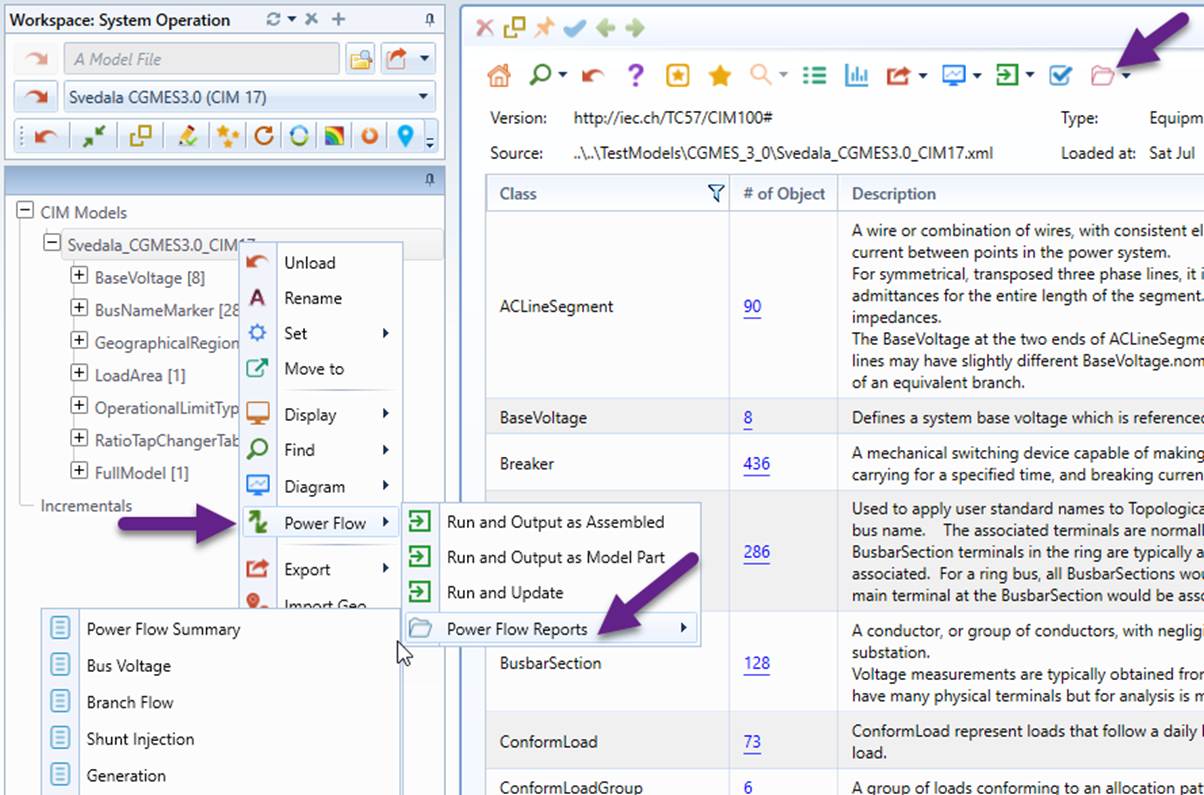
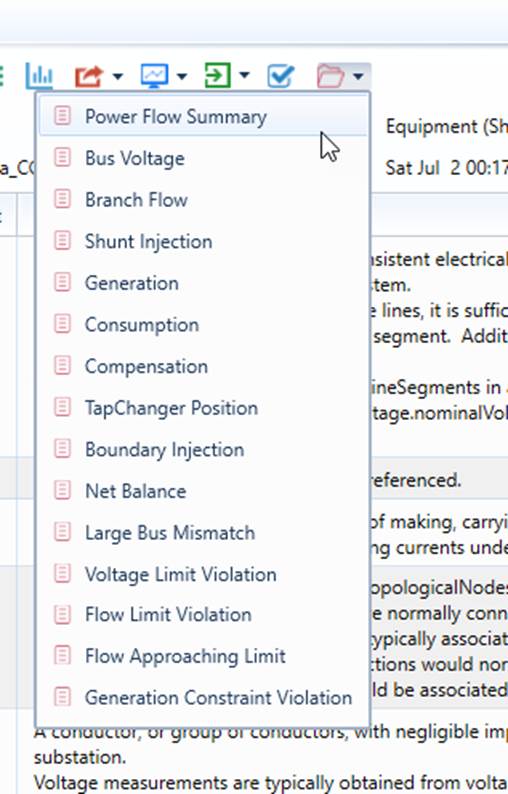
Power flow reports can be called either from the context menu associated with the model tree node or icon dropdown in the model Summary.
Note
the corresponding context menu and icon dropdown are only available for an assembled model that contains Equipment (EQ), Topology (TP), and State Variable (SV) model contents.
About Power Flow Reports
Power flow reports are designed to
- Report power flow results from different perspectives, such as bus, voltage, branch flow, shunt injection, and interchange with neighbors…
- Measure the power flow solution quality, such as net balance, max bus mismatch, etc., These KPIs are designed to measure how successful/accurate the power flow solution is;
- Alert users for any limit violations, inconsistencies, and/or suspicious results, such as voltage/flow/generation limit violation, negative branch loss, etc.
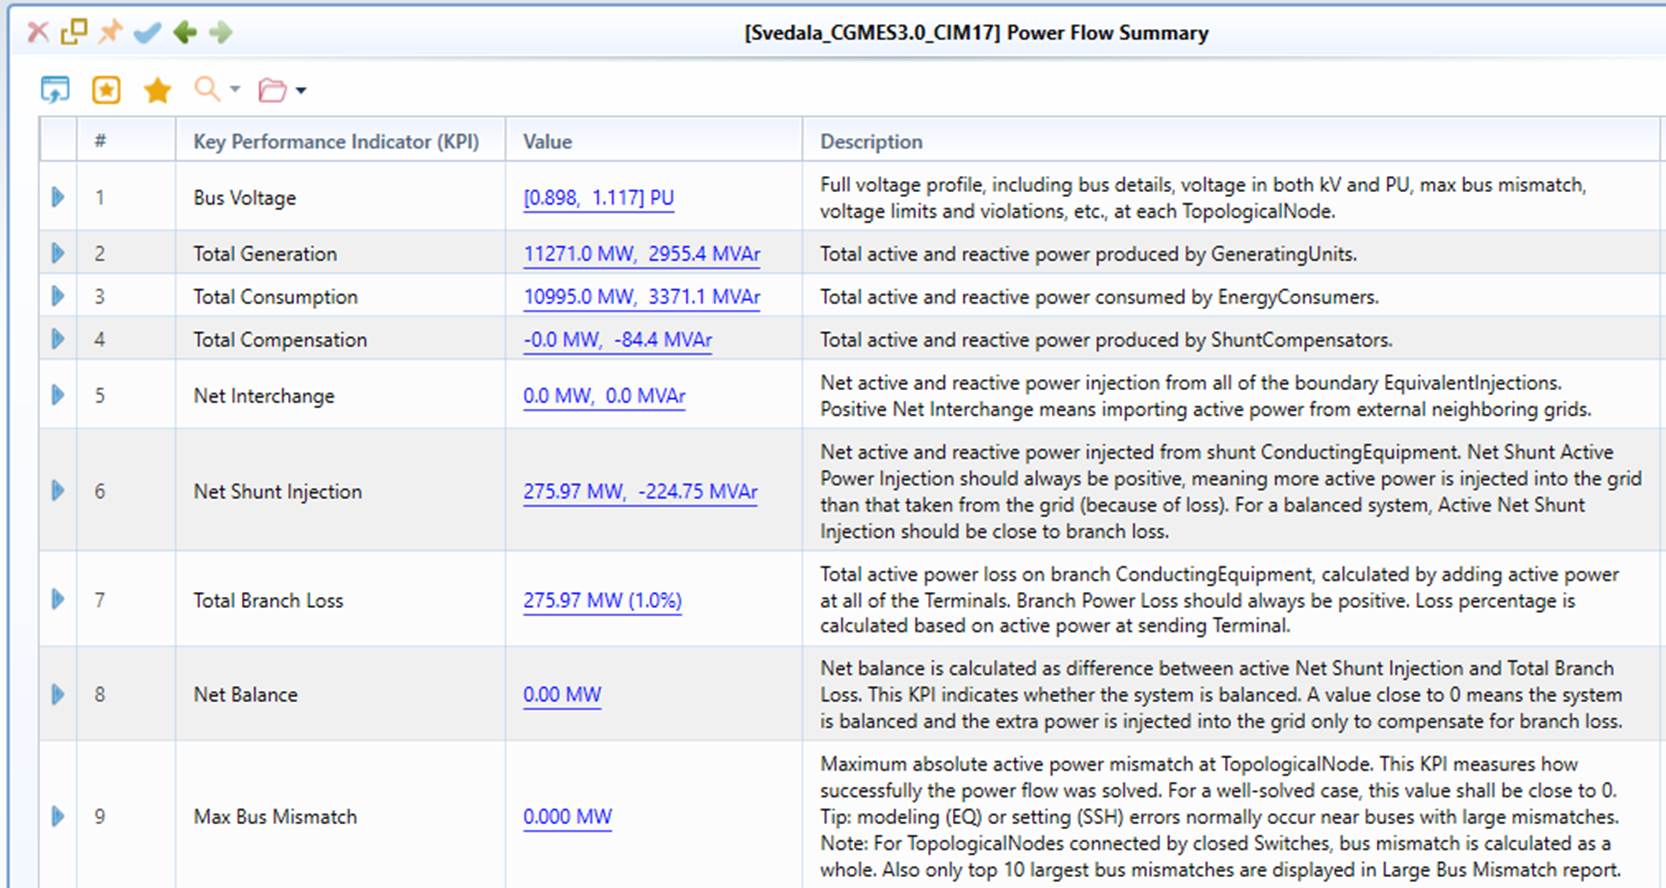
The most important power flow report is the Power Flow Summary report. This report, as illustrated below, is designed to provide an overall picture for the power flow solution, enabling users to capture the most important at a glance. Each Key Performance Indicator (KPI) in the Power Flow Summary Report is associated with a detailed report providing more details about the calculated KPI. The detailed report can be easily called from the hyper-link in the Value column.
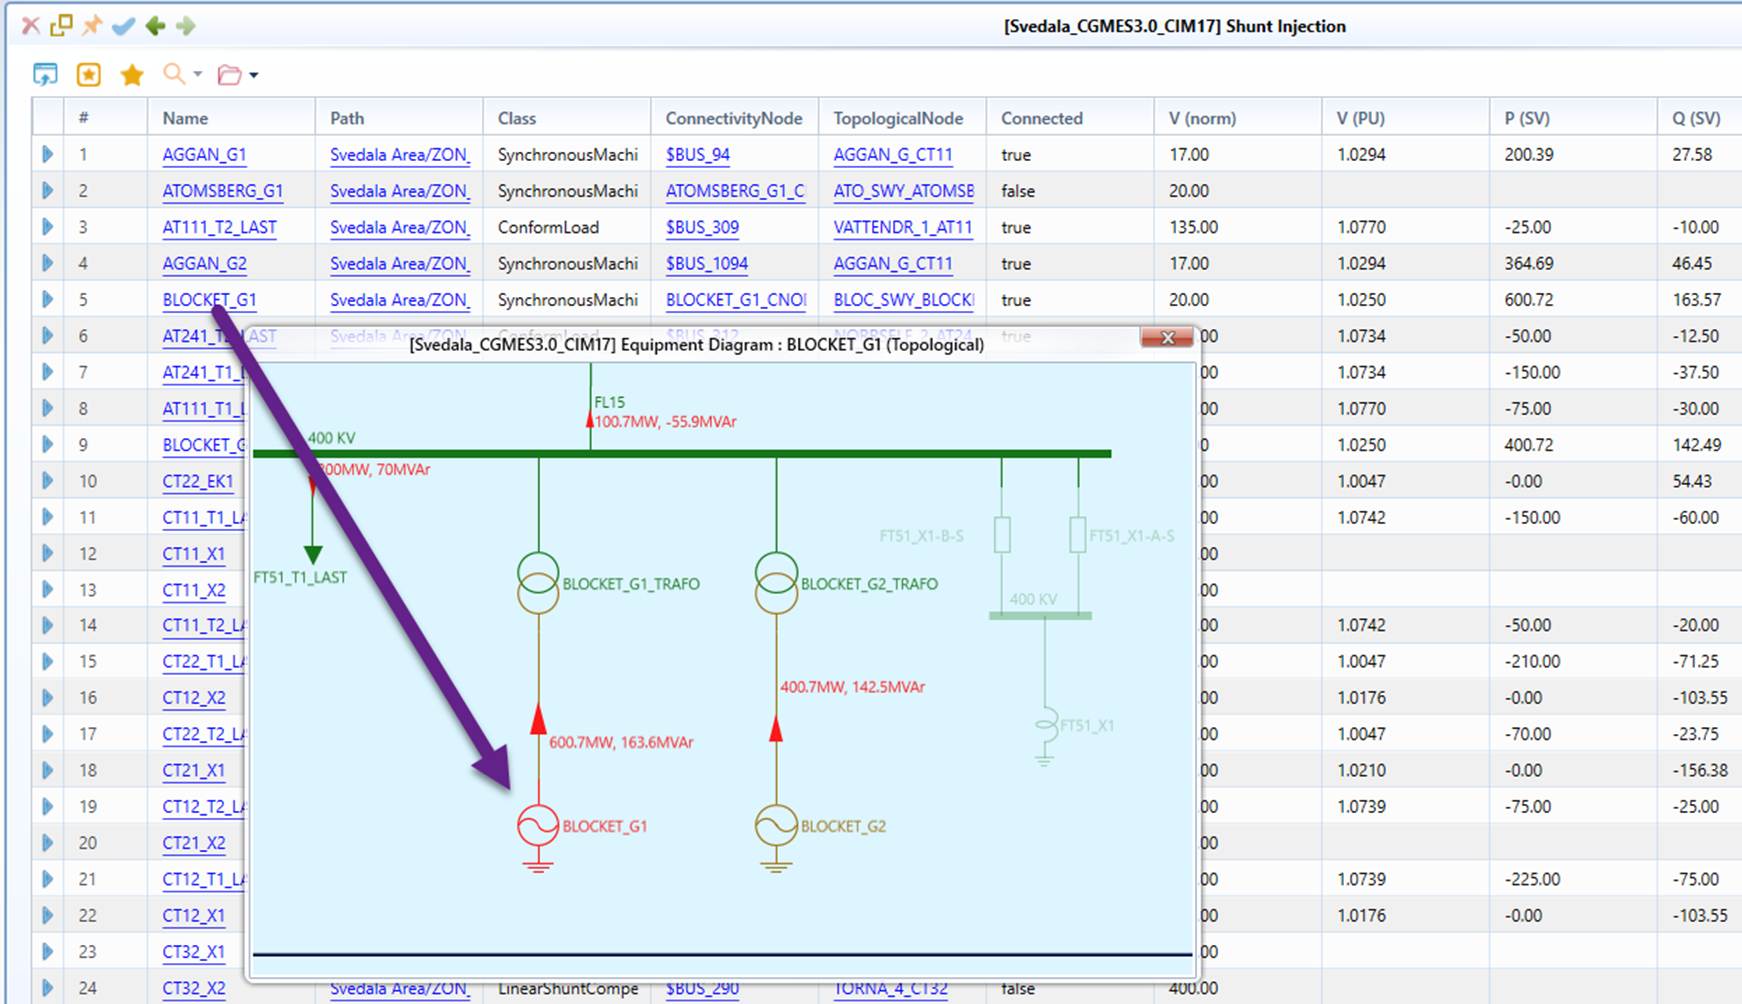
The detailed report provides much more detailed information, with KPI calculated in the last row. The detailed reports also contain hyper-links that enable users to call the diagrams, expend tree, etc., as illustrated below.
Additionally, the detailed report also highlights any violations of the operating constraints. As an example, the follow bus voltage report highlights one low-voltage violation and one high-voltage violation.
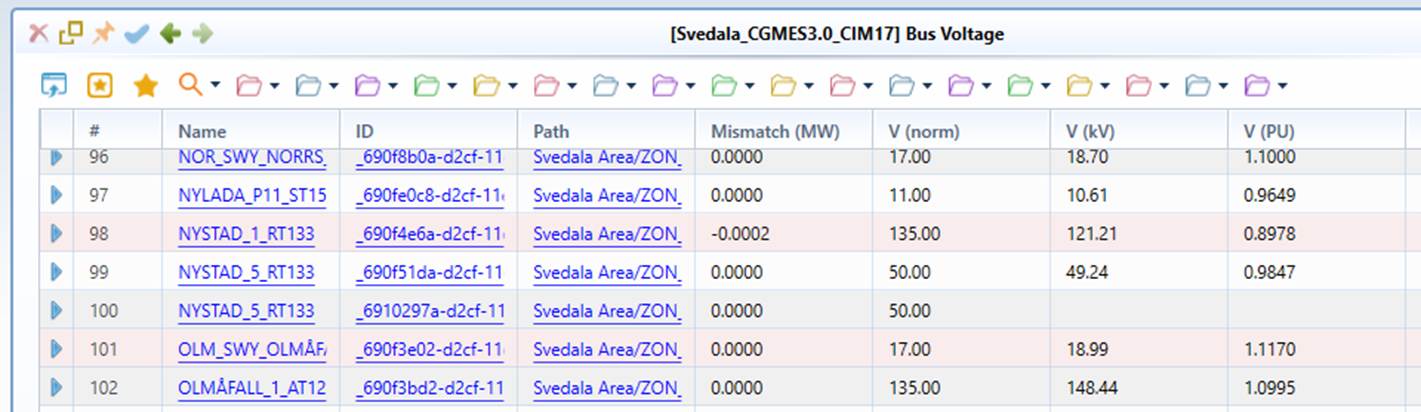
The following table summarizes each KPI in the Power Flow Summary report as well as the corresponding Detailed Report.
| Key Performance Indicator (KPI) | Sample Value | KPI Description | Detailed Report | Description of Detailed Report |
|---|---|---|---|---|
| Bus Voltage | [0.898, 1.117] PU | Full voltage profile, including bus details, voltage in both kV and PU, max bus mismatch, voltage limits and violations, etc., at each TopologicalNode. | Bus Voltage | Full voltage profile, including bus details, voltage in both kV and PU, max bus mismatch, voltage limits and violations, etc., at each TopologicalNode |
| Total Generation | 11271.0 MW, 2955.4 MVAr | Total active and reactive power produced by GeneratingUnits. | Generation | Displaying detailed information of GeneratingUnits, including input (SSH) and output (SV) power injections, generation constraints, and constraint violations |
| Total Consumption | 10995.0 MW, 3371.1 MVAr | Total active and reactive power consumed by EnergyConsumers. | Consumption | Displaying detailed information of EnergyConsumers, including input (SSH) and output (SV) power injections |
| Total Compensation | -0.0 MW, -84.4 MVAr | Total active and reactive power produced by ShuntCompensators. | Compensation | Displaying detailed information of ShuntCompensators, including output (SV) power injections and sections |
| Net Interchange | 0.0 MW, 0.0 MVAr | Net active and reactive power injection from all of the boundary EquivalentInjections. Positive Net Interchange means importing active power from external neighboring grids. | Boundary Injection | Displaying detailed information of boundary EquivalentInjections, including connected boundary nodes, tie-lines, and output (SV) power injections |
| Net Shunt Injection | 275.97 MW, -224.75 MVAr | Net active and reactive power injected from shunt ConductingEquipment. Net Shunt Active Power Injection should always be positive, meaning more active power is injected into the grid than that taken from the grid (because of loss). For a balanced system, Active Net Shunt Injection should be close to branch loss. | Shunt Injection | Displaying detailed information of shunt ConductingEquipment, including output (SV) power injections. Positive flow is injected into grid. |
| Total Distribution | -66.8 MW (-0.6%) | Total active power distributed to generators. The value is the difference between the total generation output (from SV) and the total generation input (from SSH). A value close to 0 means that the generation inputs are generally respected. | Generation | Displaying detailed information of GeneratingUnits, including input (SSH) and output (SV) power injections, and generation difference between SV and SSH. |
| Total Branch Loss | 275.97 MW (1.0%) | Total active power loss on branch ConductingEquipment, calculated by adding active power at all of the Terminals. Branch Power Loss should always be positive. Loss percentage is relative to the total active power injected into the grid. | Branch Flow | Displaying detailed information of branch ConductingEquipment, including power flow and limits at both Terminals, and limit violations |
| Net Balance | 0.00 MW | Net balance is calculated as difference between active Net Shunt Injection and Total Branch Loss. This KPI indicates whether the system is balanced. A value close to 0 means the system is balanced and the extra power is injected into the grid only to compensate for branch loss. | Net Balance | Displaying Net Shunt Injection, Total Branch Loss, and difference between them |
| Max Bus Mismatch | 0.000 MW | Maximum absolute active power mismatch at TopologicalNode. This KPI measures how successfully the power flow was solved. For a well-solved case, this value shall be close to 0. Tip: modeling (EQ) or setting (SSH) errors normally occur near buses with large mismatches. Note: For TopologicalNodes connected by closed Switches, bus mismatch is calculated as a whole. Also only top 10 largest bus mismatches are displayed in Large Bus Mismatch report. | Large Bus Mismatch | Displaying up to 10 buses with large bus mismatches |
| Suspicious Branch Flow | 0 | Number of branches with large loss (> 10%) or negative loss. This KPI is used to identify potential modeling issues, such as unrealistic line parameters. | Suspicious Branch Flow | Filtered report of Branch Flow, displaying only those with large loss ( greater than 10%) and negative loss |
| Generation Constraint Violation | 0 | Number of the GeneratingUnits with at least one of the operation constraints (i.e. Pmin, Pmax, Qmin, Qmax) violated. This KPI indicates whether generation operation constraints were respected during power flow computation. The perfect number is 0, meaning generation operation constraints were fully respected. Note: Qmin and Qmax are from ReactiveCapabilityCurve if the curve provided, otherwise from minQ and maxQ of the associated SynchronousMachine. | Generation Constraint Violation | Filtered report of Generation, displaying only those with at least one generation constraint violated |
| Suspicious or Violated ShuntCompensator | 0 | Number of the ShuntCompensators with section limit violated or the calculated section inconsistent with the calculated reactive power injection or the input sections. This KPI ensures the calculated section of ShuntCompensator doesn't exceed the maximum sections, is consistent with the calculated reactive power injection, and is the same as the input sections when regulation control is disabled. | Suspicious or Violated ShuntCompensator | Filtered report of Compensation, displaying only those with section limit violated or the calculated section inconsistent with the calculated reactive power injection or the input sections |
| Suspicious or Violated TapChanger | 0 | Number of the TapChangers with step limit violated. This KPI indicates whether the calculated position of TapChanger is within the allowable range and the same as the input step if regulation control is disabled. | Suspicious or Violated TapChanger | Filtered report of TapChanger Positions, displaying only those with inconsistent or violated positions |
| Voltage Limit Violation | 2 | Number of the TopologicalNodes with at least one (high or low) voltage limit violated. This KPI measures the quality of voltage profile. Note: If voltage limits are not provided for TopologicalNodes and VoltageLevels, default low limits (i.e. 0.9, 0.85, 0.8 PU), and default high limits (i.e. 1.1, 1.15, and 1.2 PU) are used. | Voltage Limit Violation | Filtered report of Bus Voltage, displaying only those with at least one voltage limit violated |
| Flow Limit Violation | 47 | Number of the Branches with at least one CurrentLimit or ApparentPowerLimit violated, a key KPI for evaluating grid operation security constraints | Flow Limit Violation | Filtered report of Branch Flow, displaying only those with at least one limit violated |
| Flow Approaching Limit | 4 | Number of the Branches with at least one CurrentLimit or ApparentPowerLimit close to be violated, i.e. the current or apparent power is greater than 95% of the corresponding limit. | Flow Approaching Limit | Filtered report of Branch Flow, displaying only those with flow approaching at least one limit (greater than 95%) |
| TapChanger Position | Displaying detailed information of TapChangers, including input (SSH) and output (SV) positions and violations |