Interactive User Experience
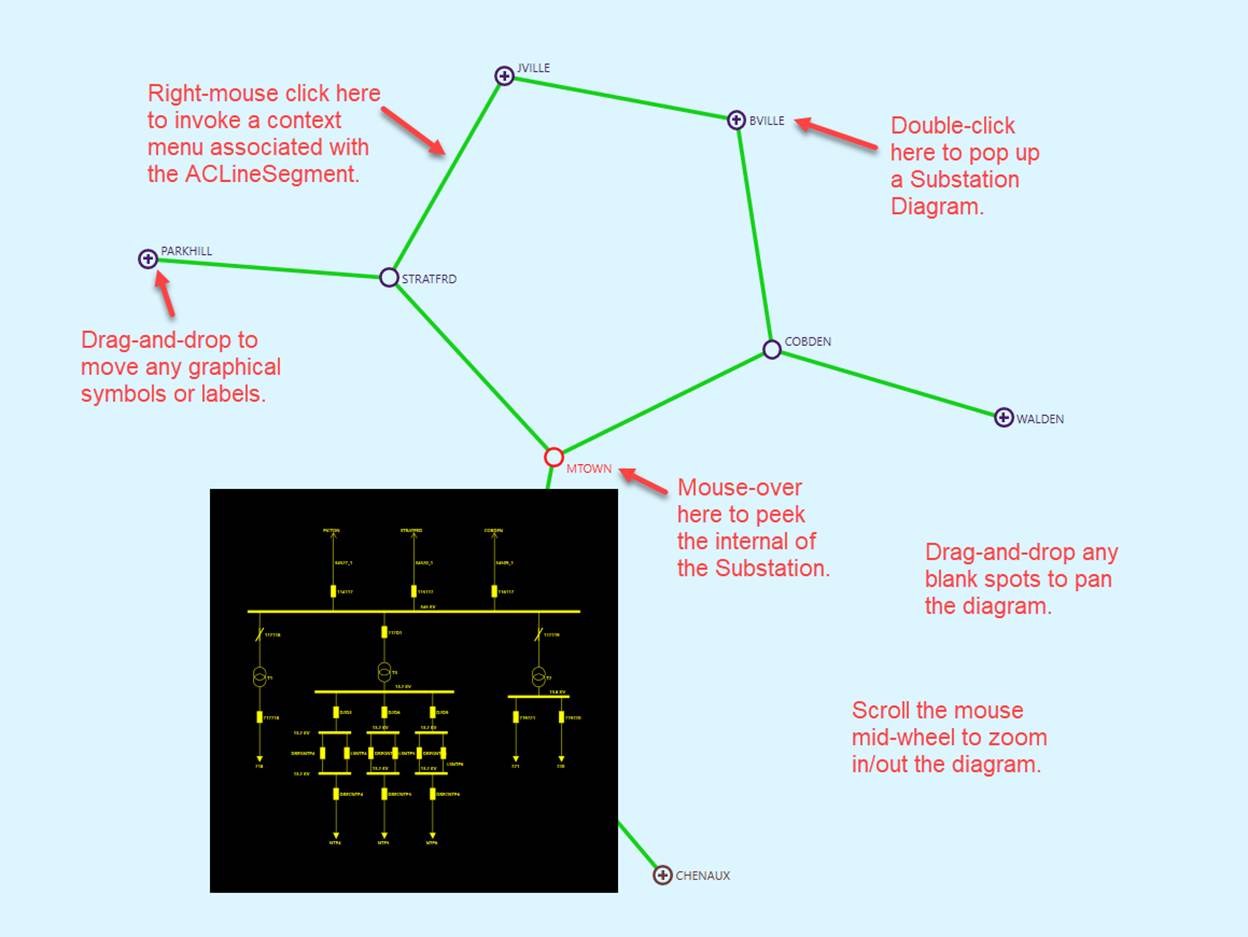
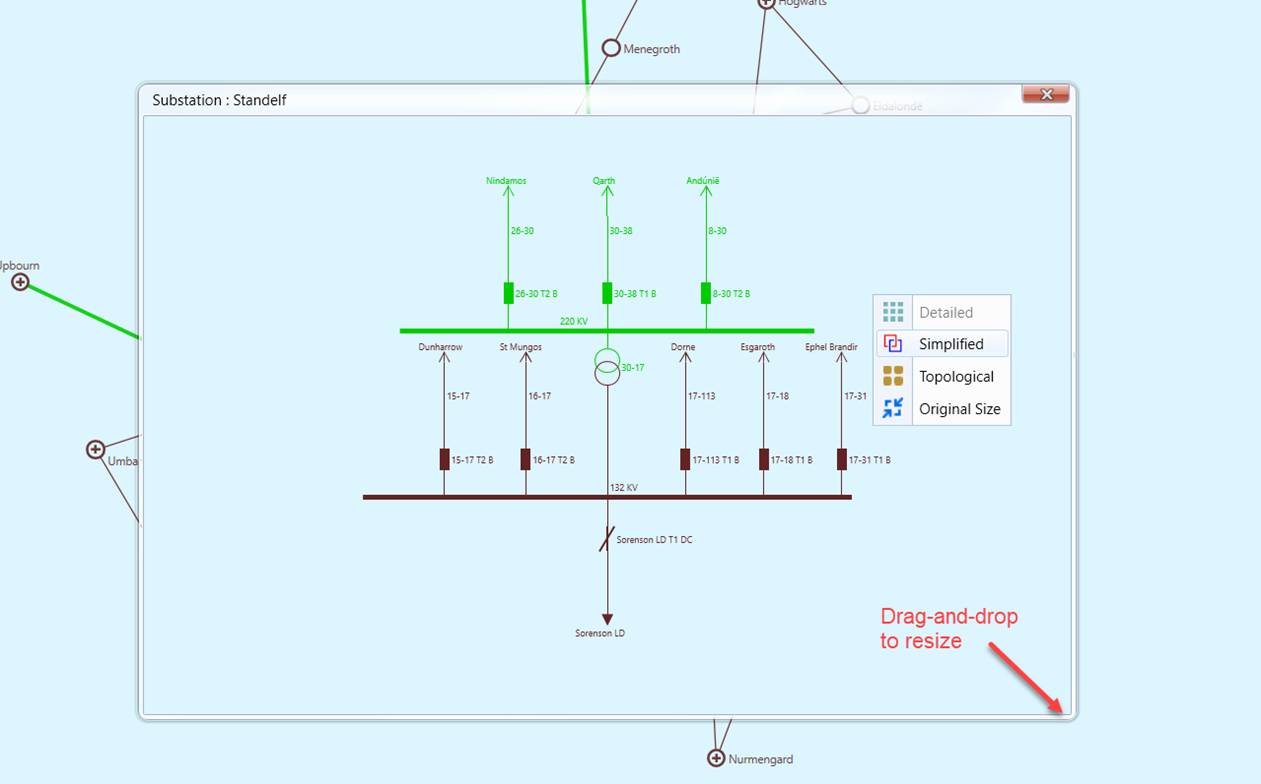
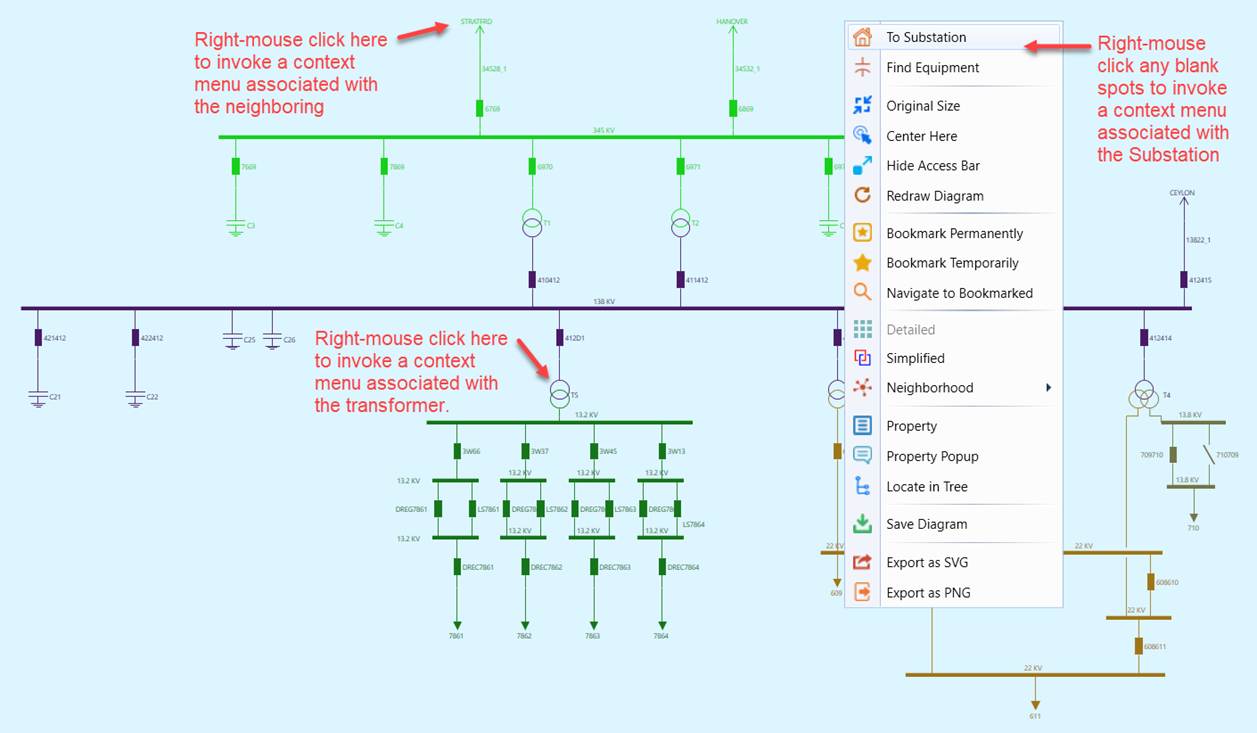
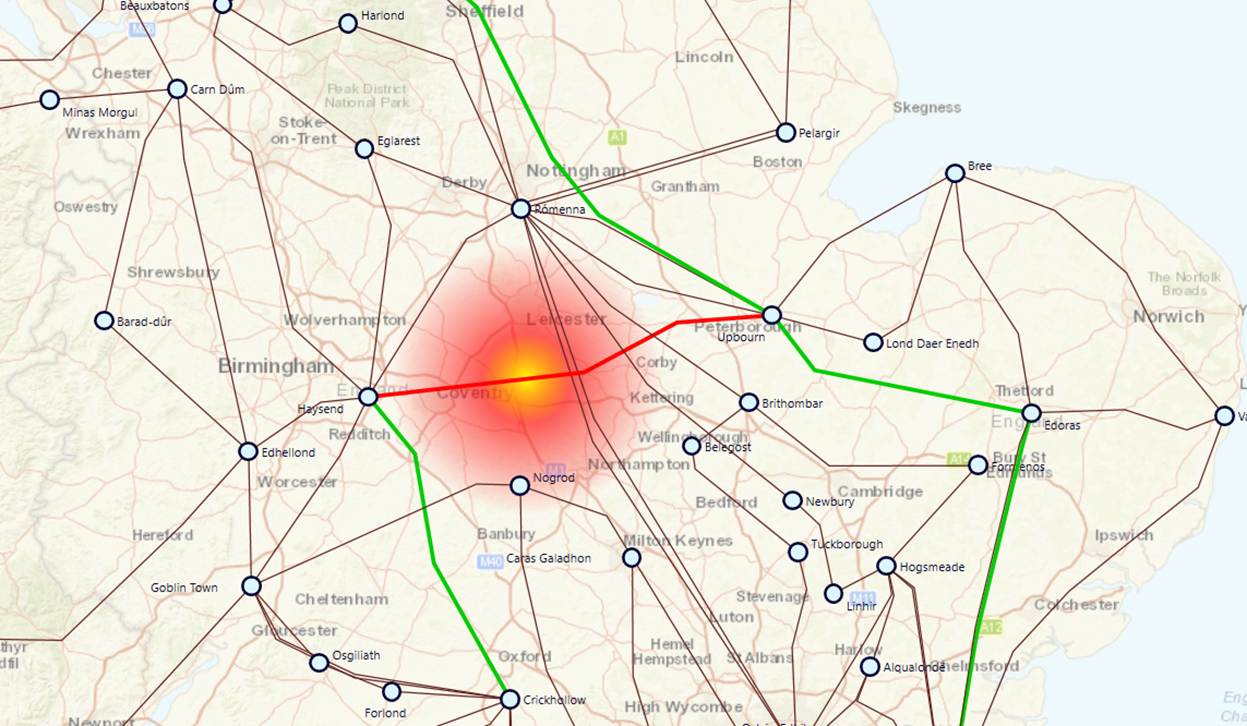
The Tool provides various interactive graphical presentation features, shifting users’ focus on the “interesting data”. Some of these features are summarized as follows and illustrated in the screenshot.
- Graphical Navigations – Users are able to navigate through the diagram by zooming in/out and panning the diagram, viewing the diagram at different resolutions. The animated zooming and panning features distinguish this tool from any other power grid visualization tools in the market.
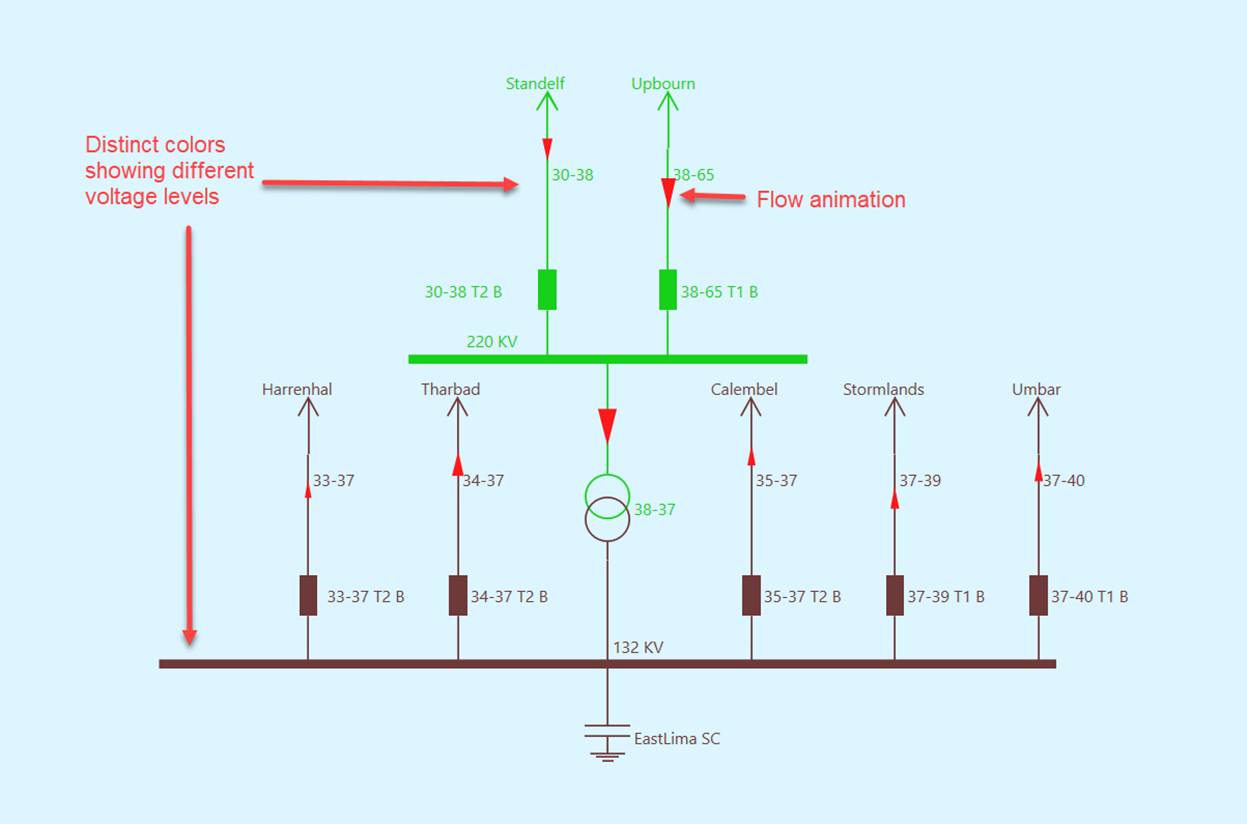
- Color Themes – The tool provides two rich color themes to present the data illustratively. For example, colors are used to mark different voltage levels. Users can also easily switch between two color themes and customize them.
- Animations– Various animation techniques, such as flow animation and blinking, are used to present the data intuitively.
- Highlighting – “interesting data” are always highlighted with colors, animations, symbol variation, etc.
- Graphical Manipulation – Users can always manipulate the auto-generated diagrams for better look and feel. For example, users can adjust the diagram by dragging and dropping the graphical symbols and annotations freely.