Substation Diagram
In response to users’ request, the Tool auto-generates Substation diagrams to graphically describe the network components and their physical/electrical connections within a Substation where electric equipments are physically located and interconnected.
Understanding Substation Diagram
While Neighborhood Diagrams describe the network connection among Substations, Substation Diagrams and the derived Equipment Diagrams are designed to graphically display the network physical/electrical connections inside a Substation. Substation Diagrams are just one-line diagrams of a Substation. A one-line diagram is a simplified notation for representing a three-phase power system. It is used to graphically describe the network components and their physical/electrical connections.
Depending on the availability of the data, the Tool can be used to generate 3 types of Substation Diagrams:
- Detailed Diagram – graphically describing the Substation physical configuration as it is. A Detailed Diagram matches well with EMS node/breaker representation of network connectivity. All of the equipments including switching devices are retained in the diagram, describing how a Substation is physically connected and configured.
- Simplified Diagram – graphically describing the Substation configuration using a simplified bus/branch representation. A Simplified Diagram is derived from Detailed Diagram. It represents a simplified bus/branch model where closed or normally-closed switching devices are removed and the ConnectivityNodes that connect these switching devices are consolidated. For a reality-based substation, the simplified bus-branch diagram significantly enhances the clarity of generated diagram. It is also suitable for displaying the analytical results, since it matches well with the analytical model.
- Topological Diagram – graphically describing the Substation electrical configuration using a bus/branch representation. A Topological Diagram is quite similar to Simplified Diagram, except the diagram is directly generated using the topological information (specified by the Topology profile) in the model, rather than using the information derived from the model. The topological information is normally provided by a planning tool where networks are represented using a bus/branch model.
The following screenshots compare Detailed Diagram with Simplified Diagram auto-generated from the same Substation.
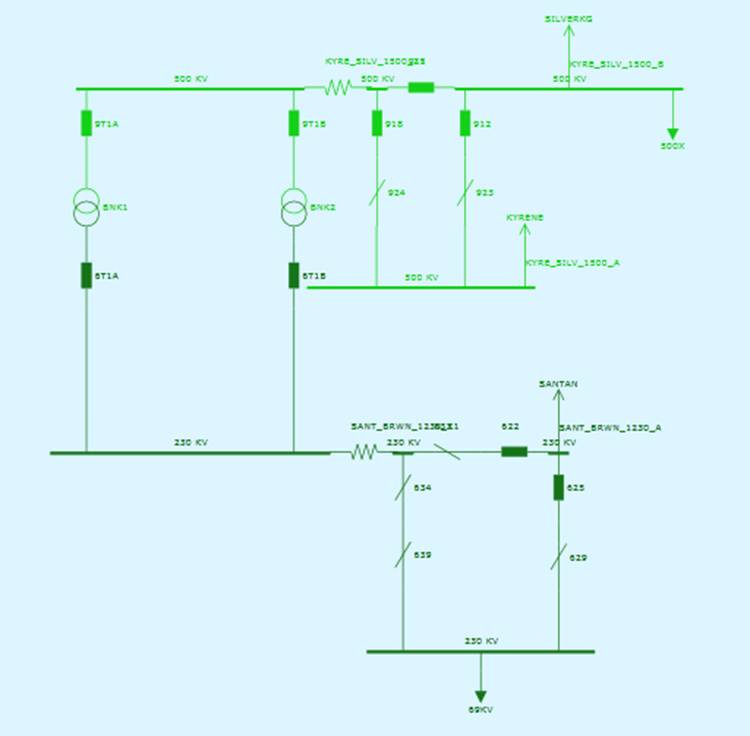
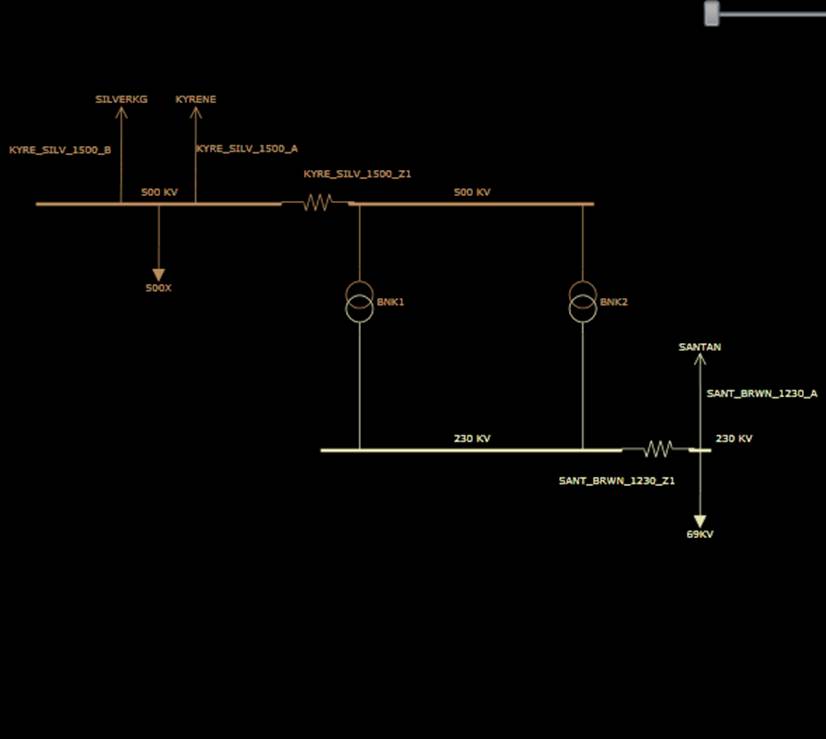
However, in most cases, not all of the above three diagrams are available. The Tool has a built-in logic to determine what types of Substation Diagrams are available for a model and then create context menu or hyperlinks to allow users call them. More specifically, the following rules are used to determine whether a type of Substation Diagram is available for a certain model.
- Simplified Diagram is a derived from Detailed Diagram. It is always available for a Substation that has a Detailed Diagram.
- Detailed Diagram requires the static network connectivity information available. Static network connectivity is described using class ConnectivityNode and Terminal in the Equipment profile. A node/breaker type Equipment model, typically exported from EMS, contains such information. However, the bus/branch type Equipment model, typically exported from a planning tool, may not contain such information.
- Topological Diagram requires the network topological information to be available. Network topological information is described using class TopologicalNode (from the Topology profile) and class Terminal (from both Equipment and Topology profiles). Therefore Topological Diagrams are only available for a model merged from Equipment and Topology CIM/XML files.
In summary, Detailed Diagrams and the derived Simplified Diagrams, describing the physical configuration of a Substation, are available for a node/breaker Equipment model, typically exported from EMS. Topological Diagrams, describing the electrical configuration of a Substation, are available for a bus/branch model merged from Equipment and Topology data groups. If the model contains both the static network connectivity and the processed network topological information, all of the three types of Substation Diagrams are available. This is not quite common, though. In that case, users may find Simplified Diagrams and Topological Diagrams, both a bus/branch representation, may not be the exactly same. This is because Simplified Diagrams are created based on the static information such as normally-open status of switching devices, while Topological Diagrams are generated using the imported study case information produced by external applications. In a study case, a normally-open switch could be actually closed. Simplified Diagrams are generated by the Tool, mainly to enhance the clarity of a Detailed Diagram.
Calling a Substation Diagram
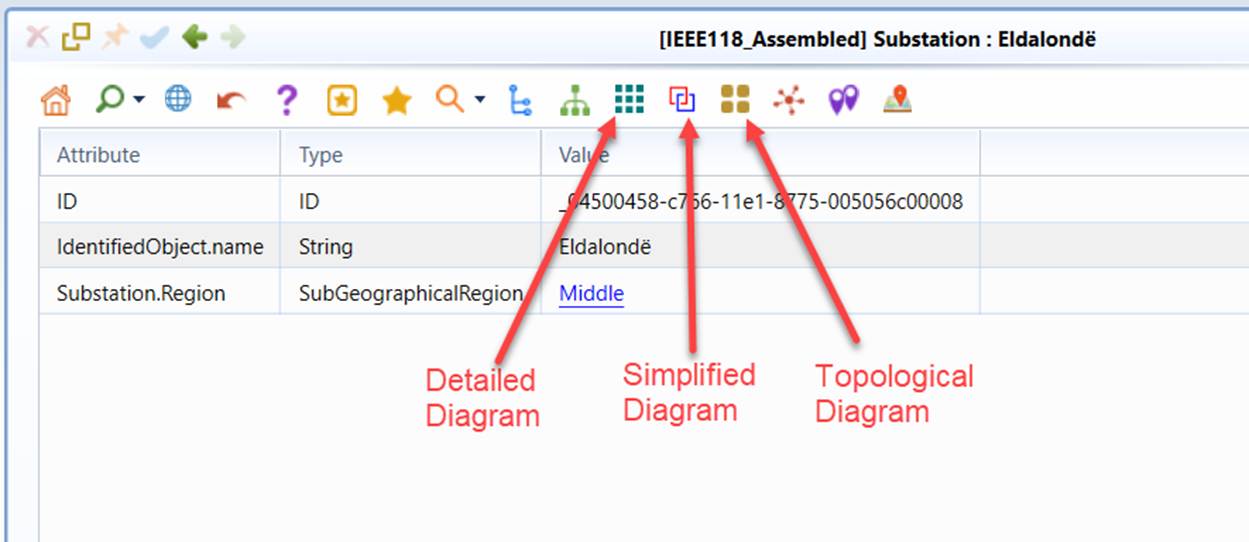
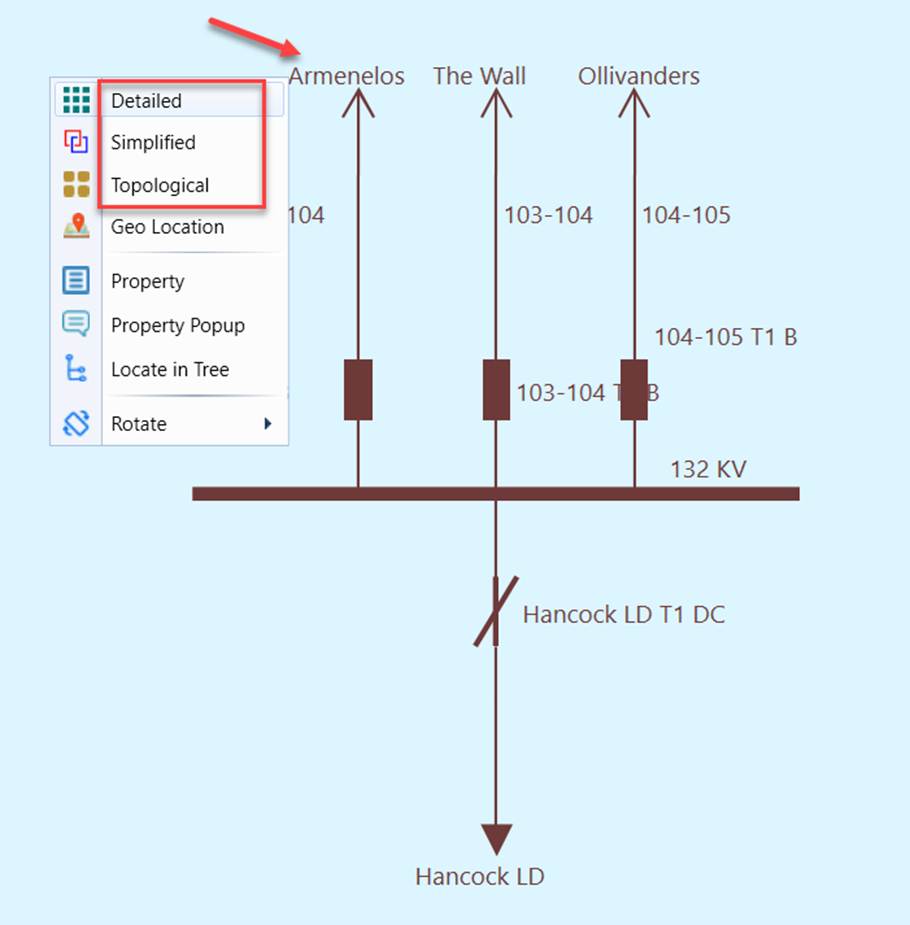
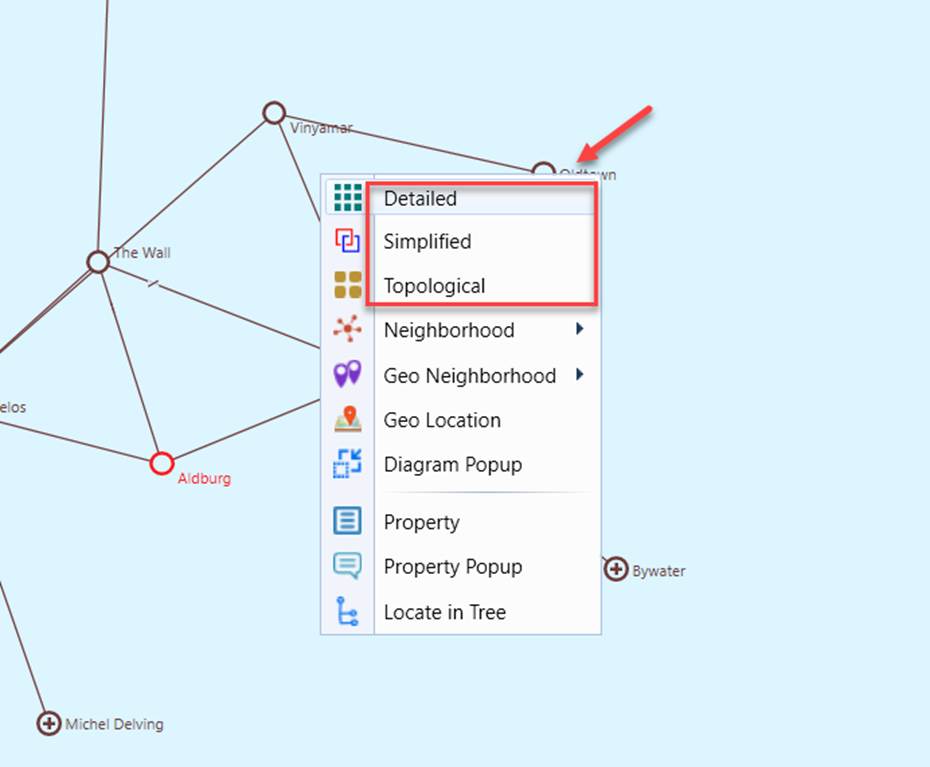
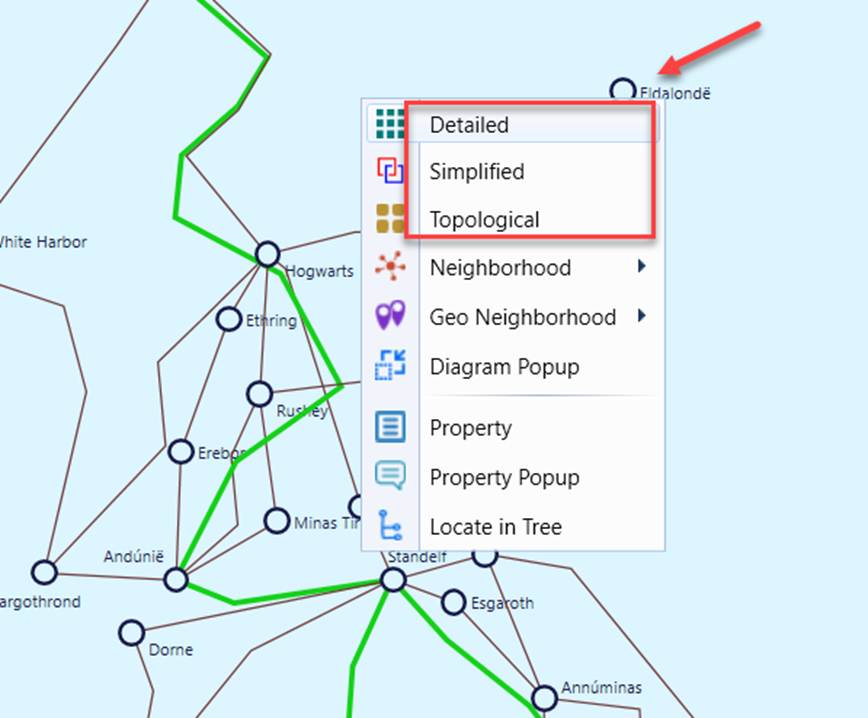
Substation Diagrams can be called in different ways:
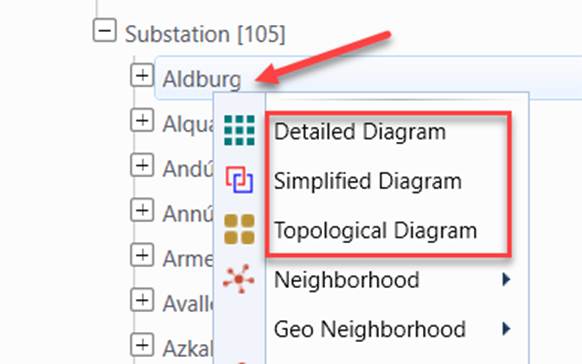
- Context menu associated with the Substation tree item in the Navigation Tree
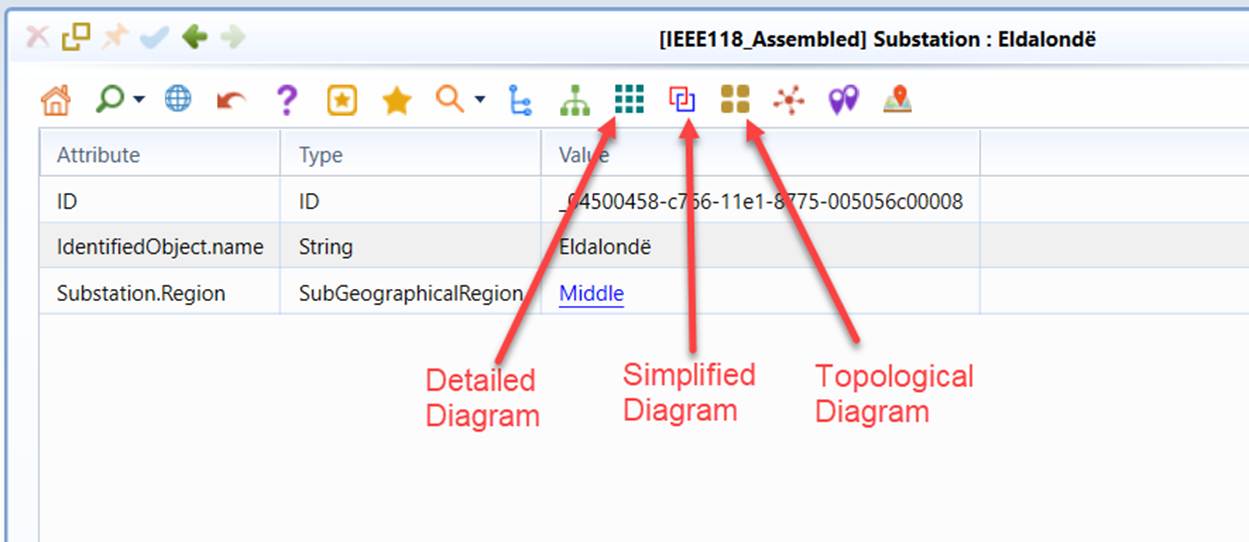
- Command Icons in the Substation Object Form
- Context menu in the neighboring Substation Diagram
- Context menu in Neighborhood Diagram
- Context menu in Geographical Diagram
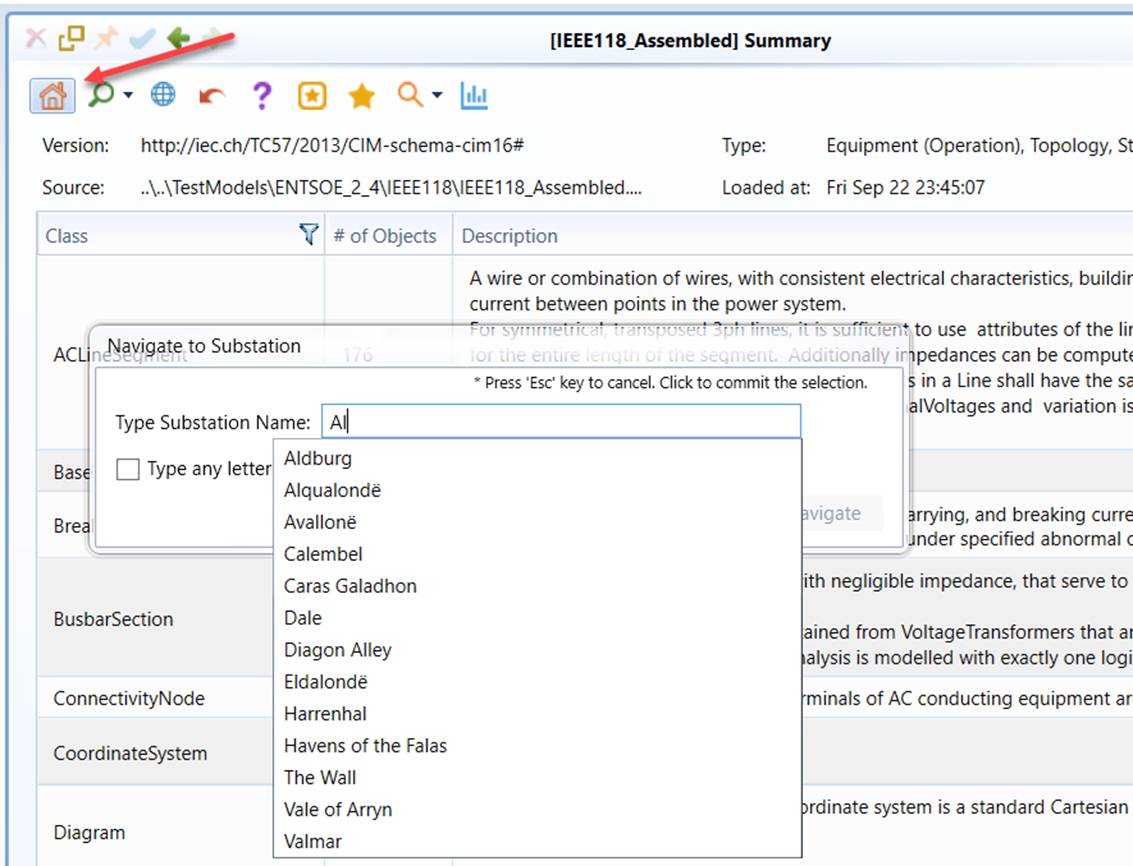
- Substation Navigation Wizard, a facility aimed to help users quickly navigate to a Substation Diagram. Users can invoke this Auto-Suggest Searching Wizard by right-mouse-clicking any blank spots and selecting the “To Substation” context menu item. An edit box will appear, prompting users to enter the substation names. While users type the names of substation, the tool will search for any substations whose names partially match the typed string and list them as hints for users to select. Typically, after users enter 2 or 3 characters, they can find the target substation from the hint list. Once the substation from the hint list is selected, it will automatically navigate to the station. No button click is required. If users want to cancel the wizard, just hit the “Esc” key in the keyboard.
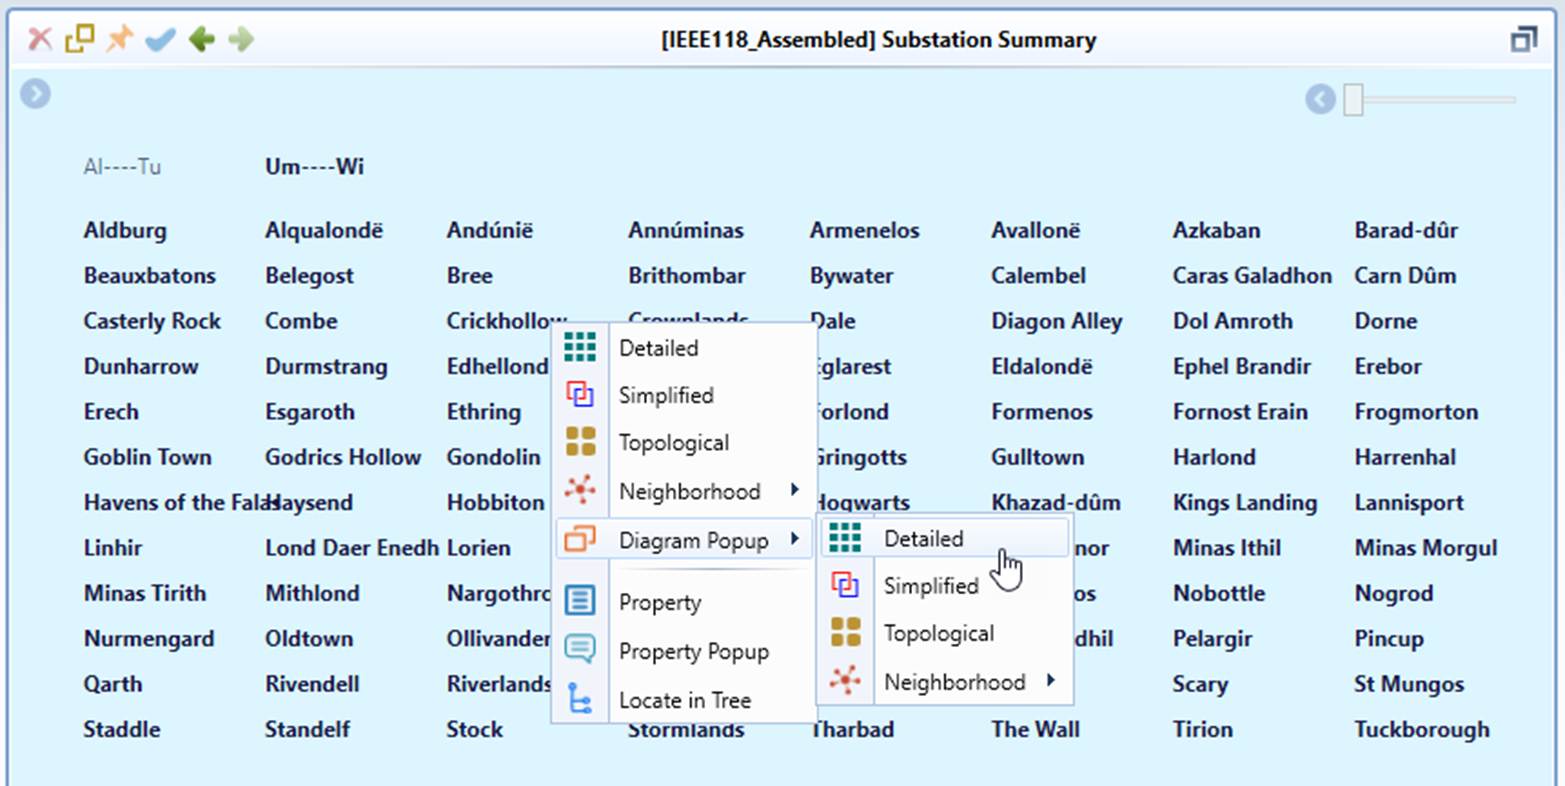
- Context menu or mouse clicking in Diagram Summary
Exploring in a Substation Diagram
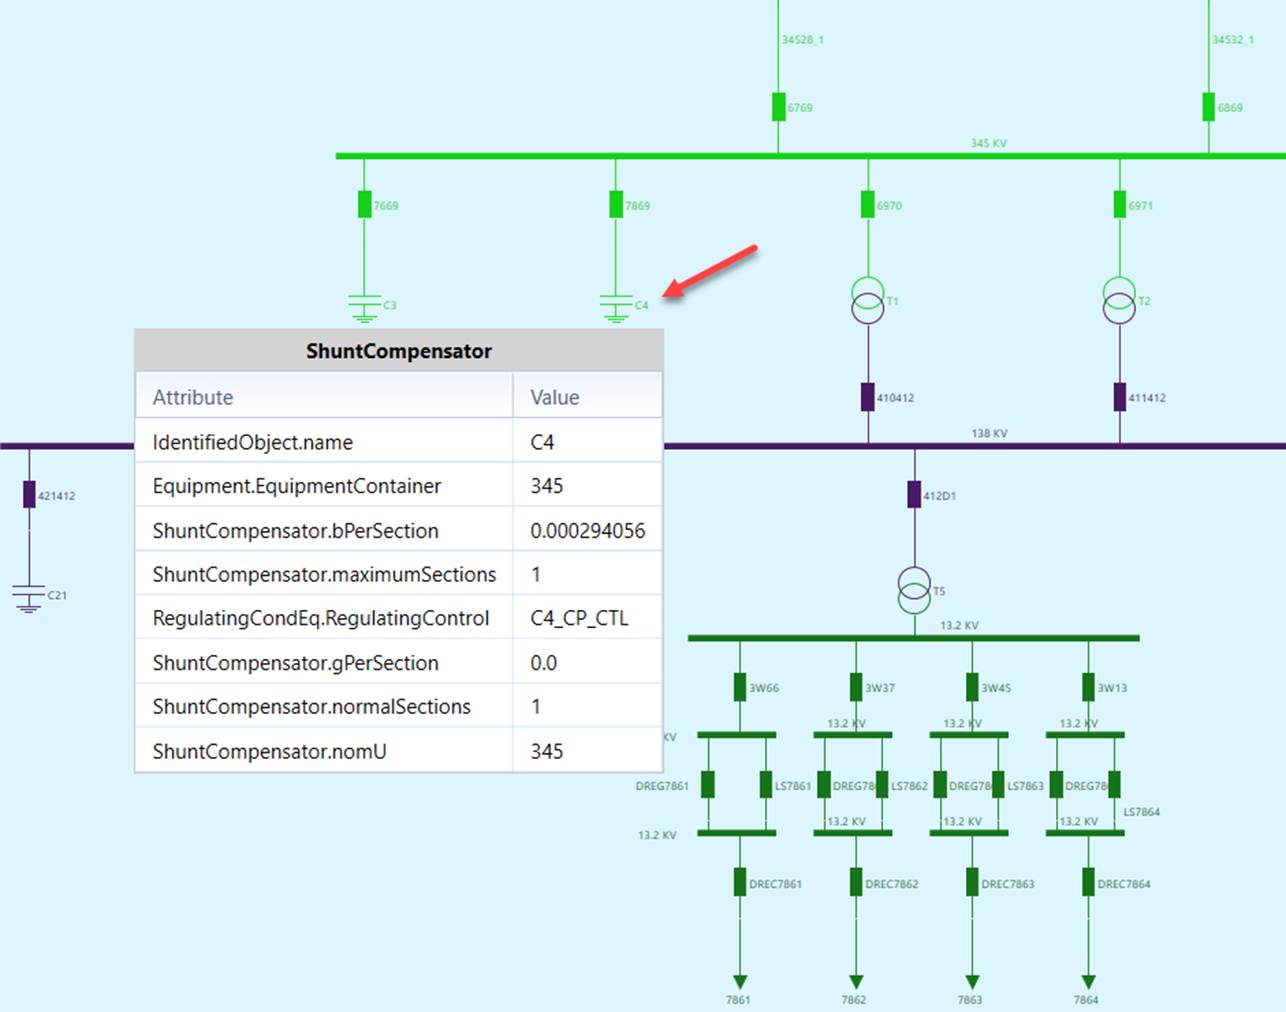
Once the diagram is generated, users can perform various tasks. The Tool provide a rich user experience for users to explore the model, including focusing on richly presented “interesting data” , seeking useful information using various interaction and navigation techniques, and customizing the displays for better look and feel. The following screenshot illustrates some of the model exploration features specific to Substation Diagram.
- Mouse-over a graphical symbol to view the property of the represented CIM object in the popup
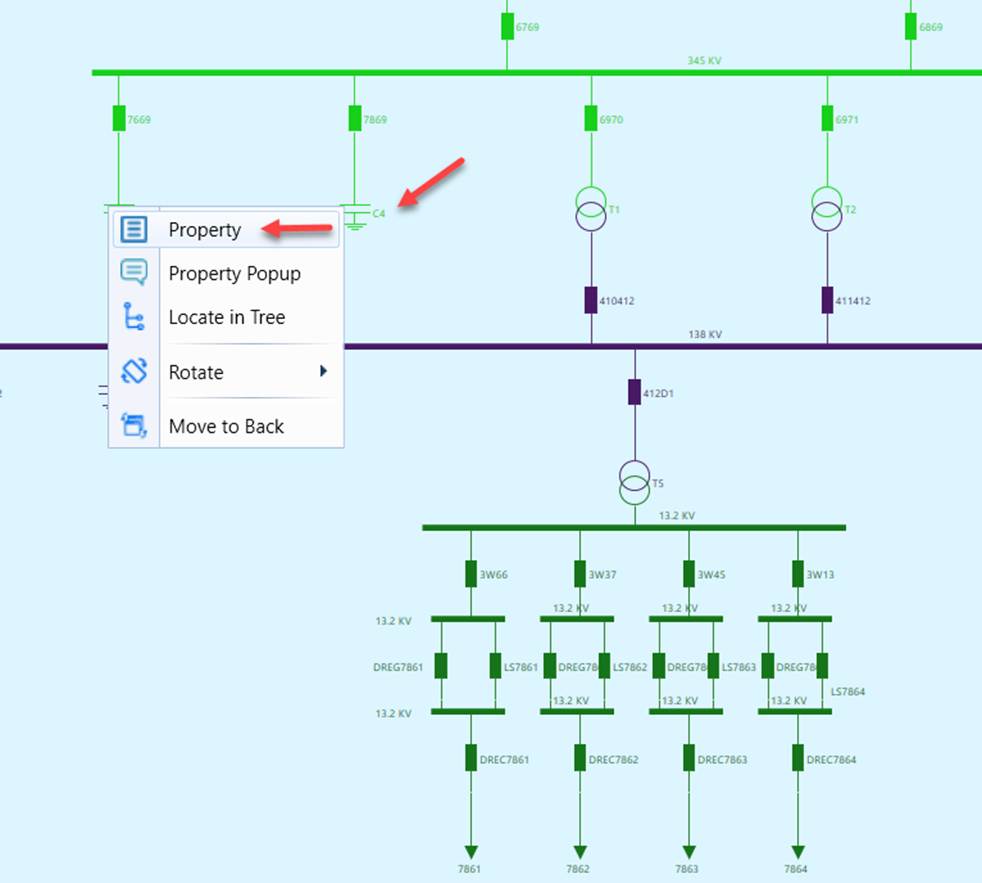
- Right-mouse click a graphical symbol or label (to invoke a context menu) to navigate to the represented CIM Object Form.
- Mouse-over a graphical symbol representing a neighboring Substation to peek the diagram of the selected neighboring substation in the popup
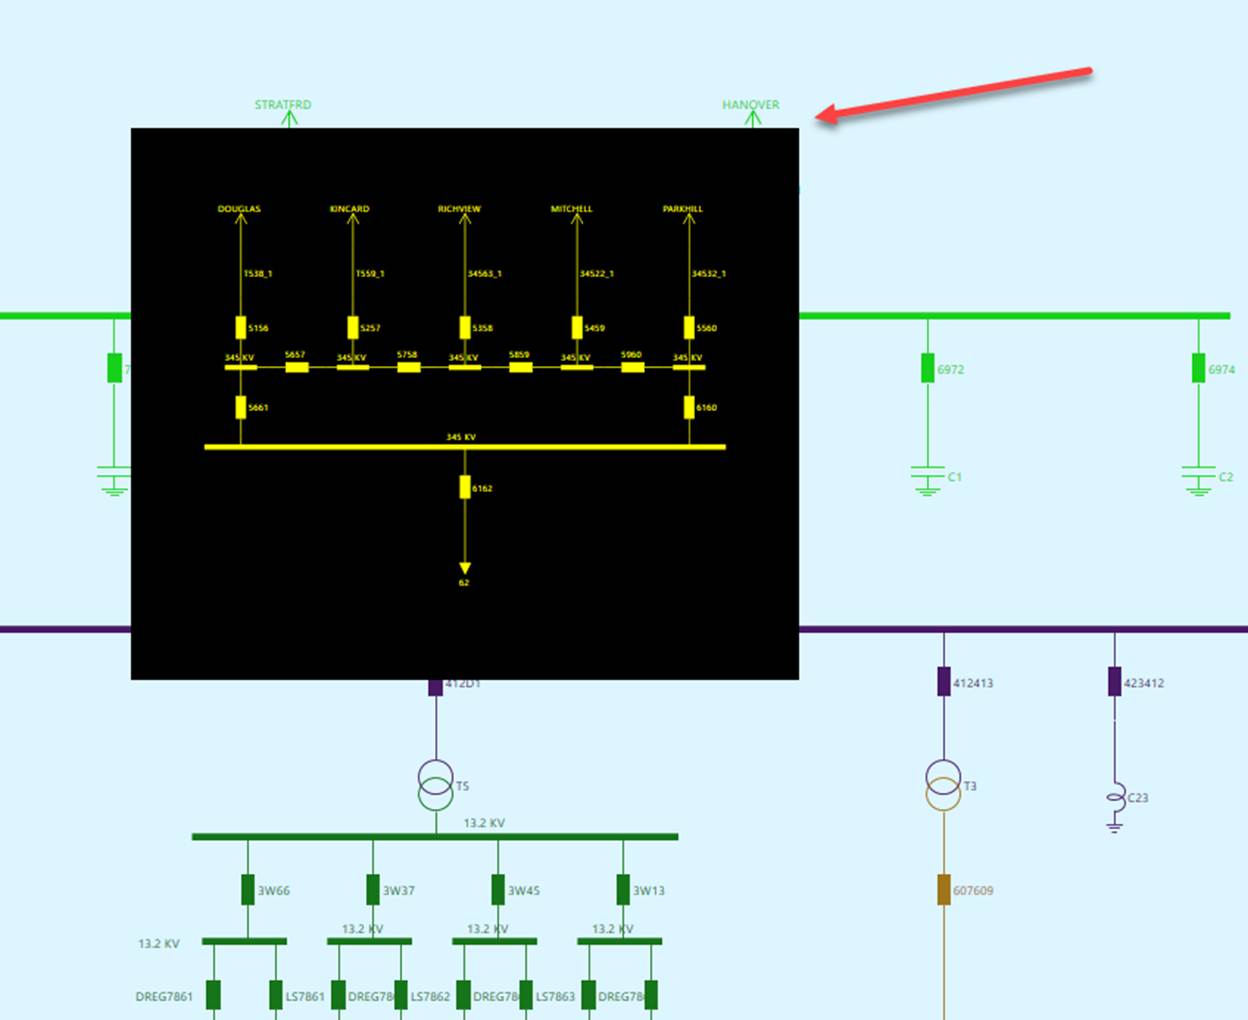
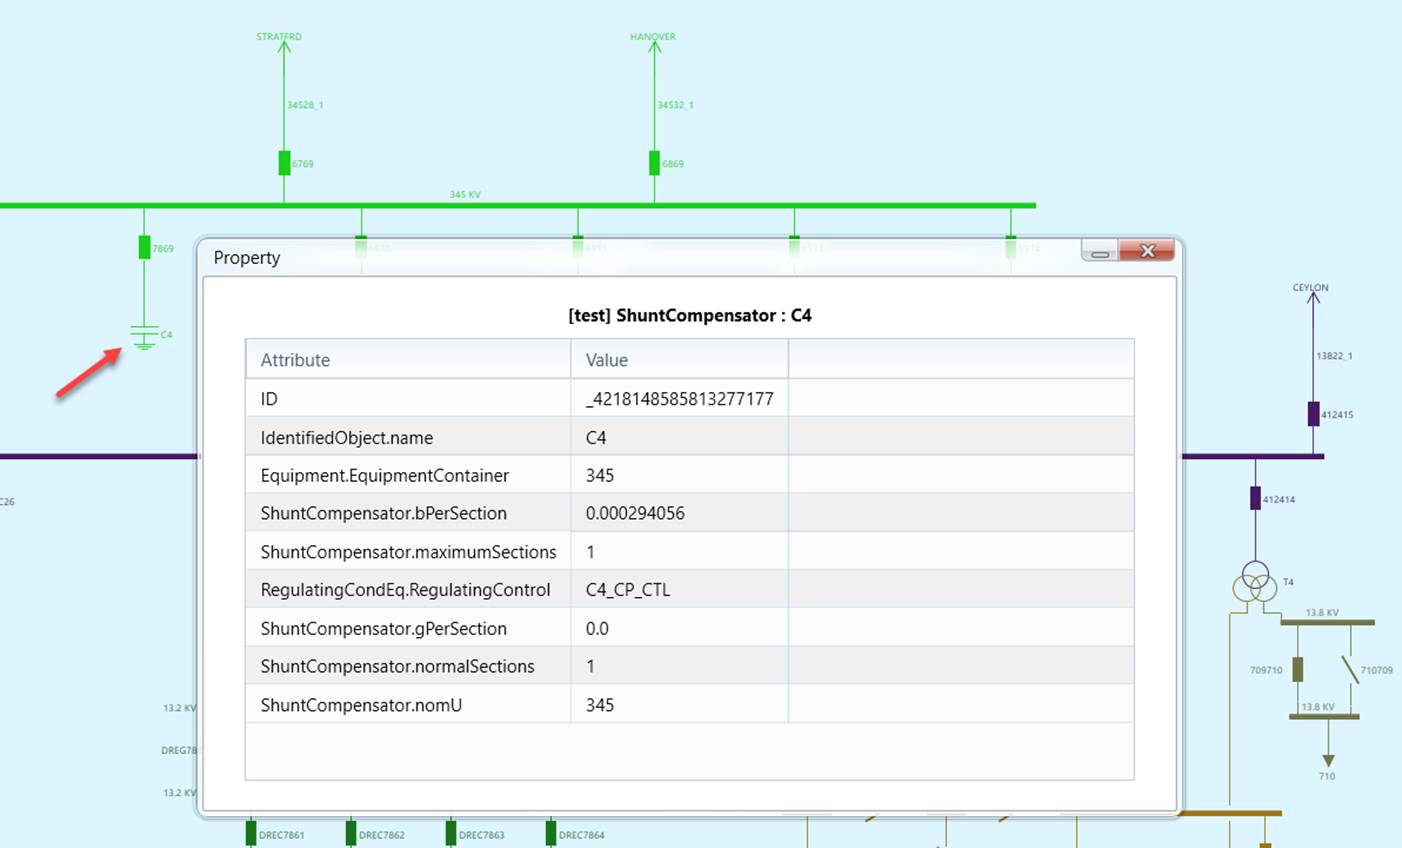
- Double click a graphical symbol or label associated with a network component (or via the associated context menu) to invoke a property popup, displaying the properties of the selected network component.
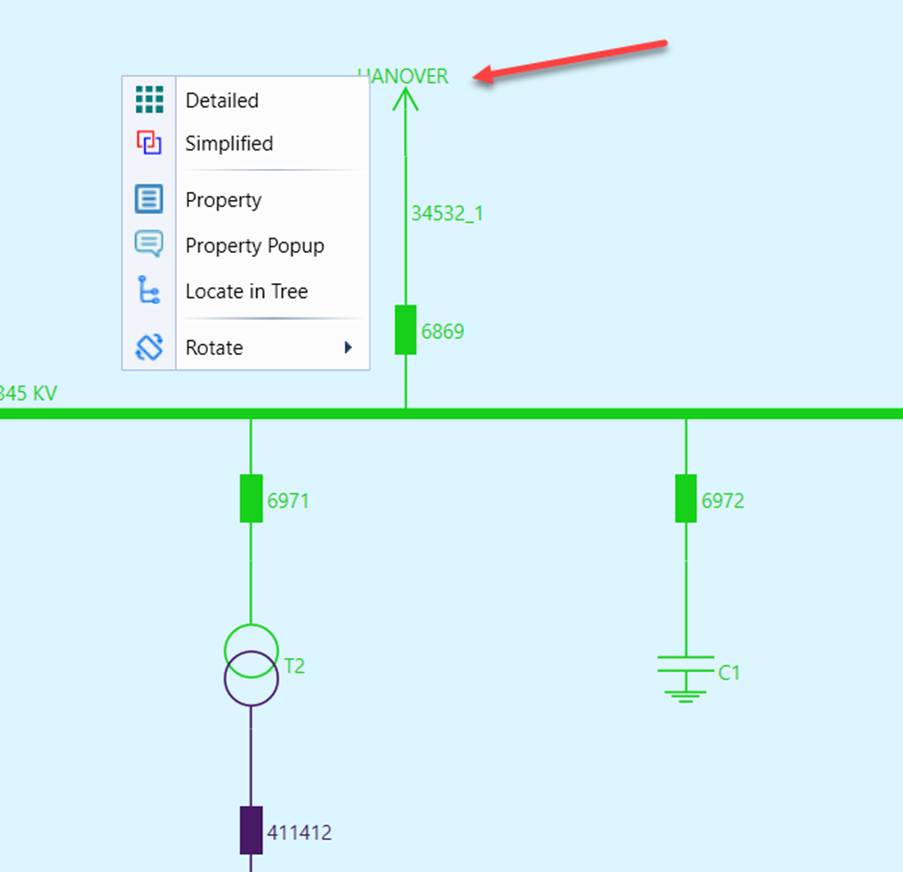
- Double click or Right-mouse click a graphical symbol representing a neighboring Substation to navigate to the diagram of the selected neighboring substation
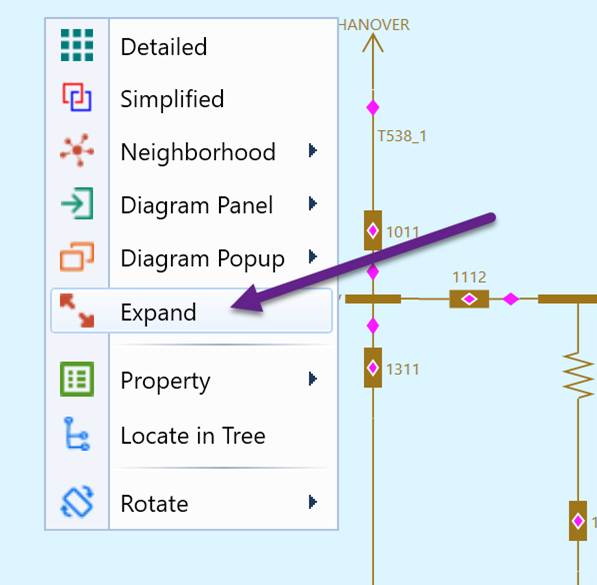
- Right-mouse click a graphical symbol representing a neighboring Substation to expand it into multi-station diagram as shown below:
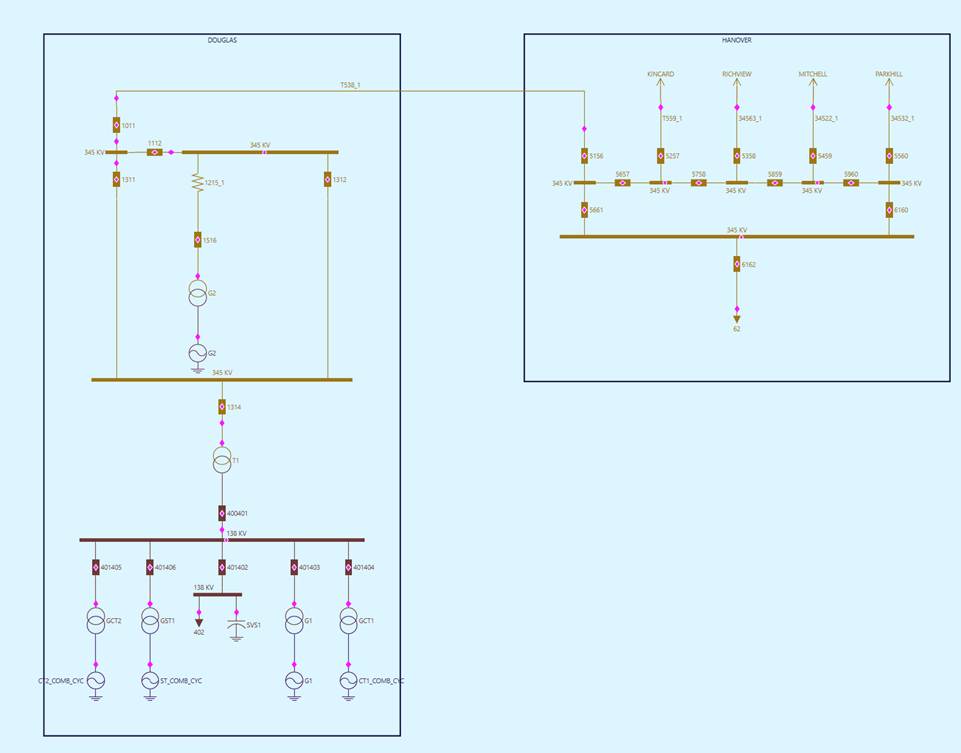
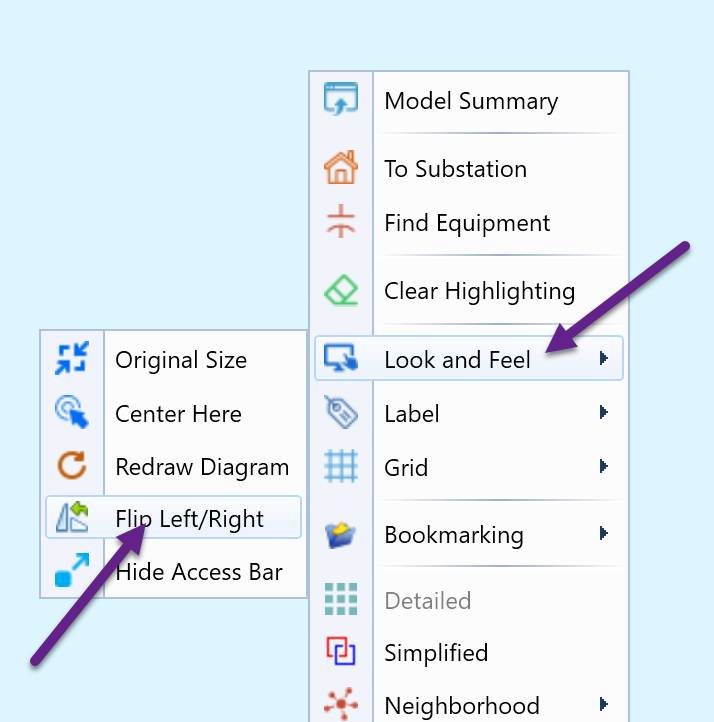
- Right-mouse click any blank spots to invoke a context menu associated with this Substation Diagram and flip the station for the layout.
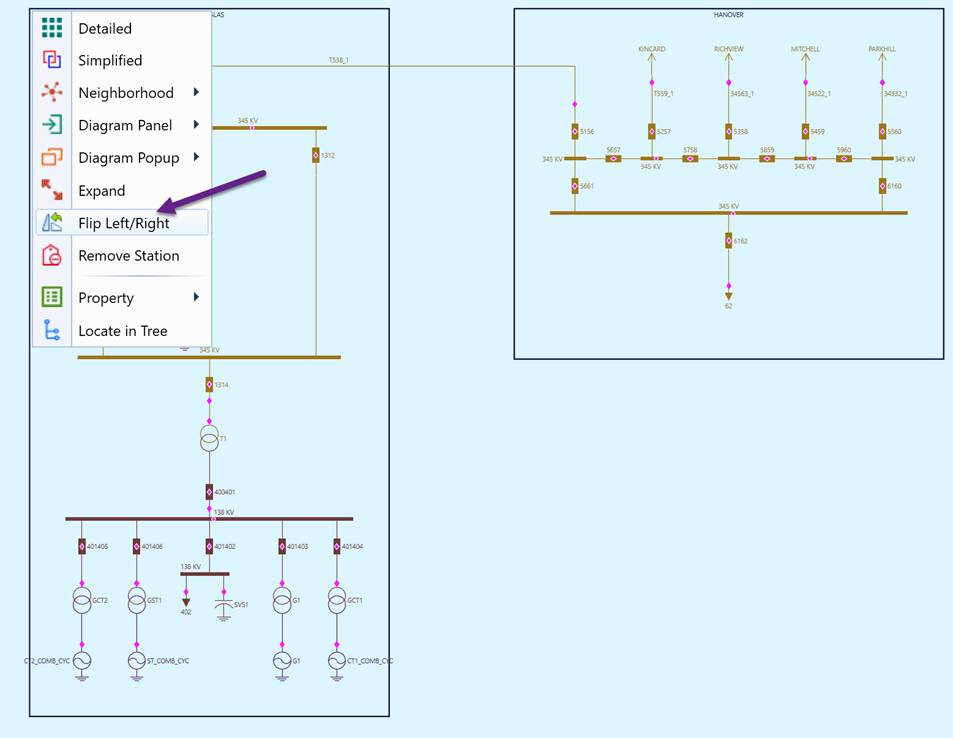
The same flip can be done in the multi-station diagram as well as shown below by right click on the a graphical symbol representing a Substation.
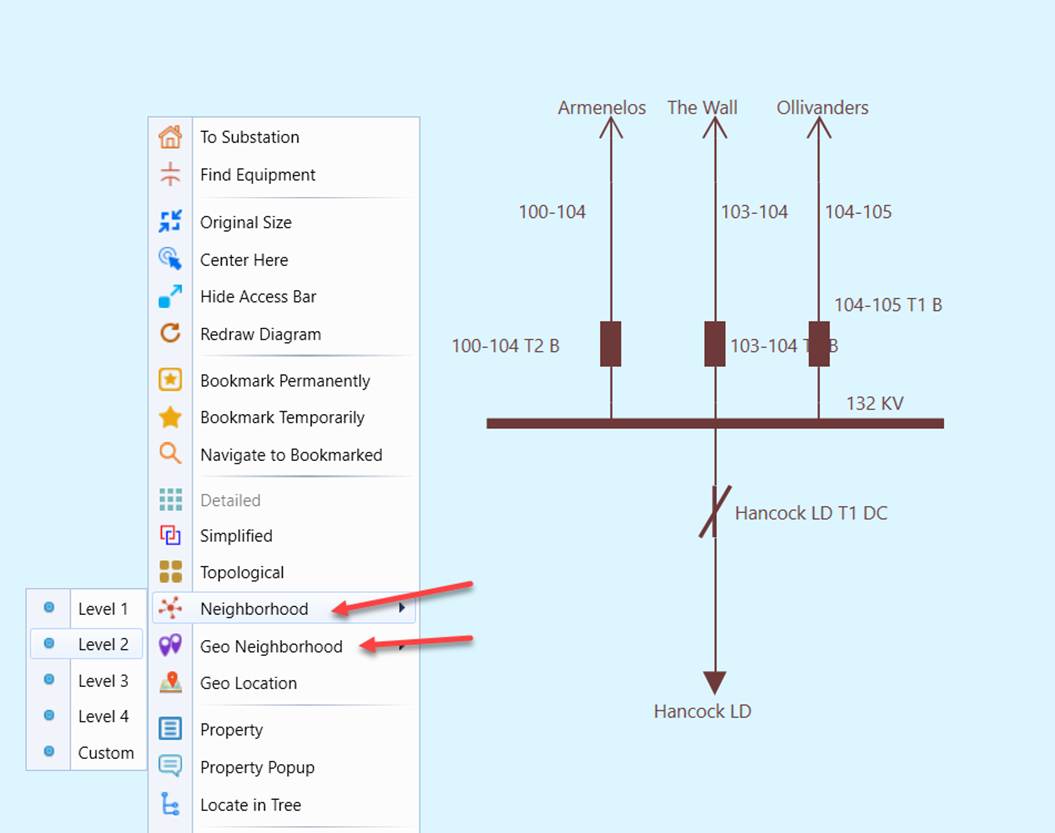
- Right-mouse click any blank spots to invoke a context menu associated with this Substation Diagram and perform various tasks, including calling a Neighborhood Diagram displaying the surrendering of the Substation.
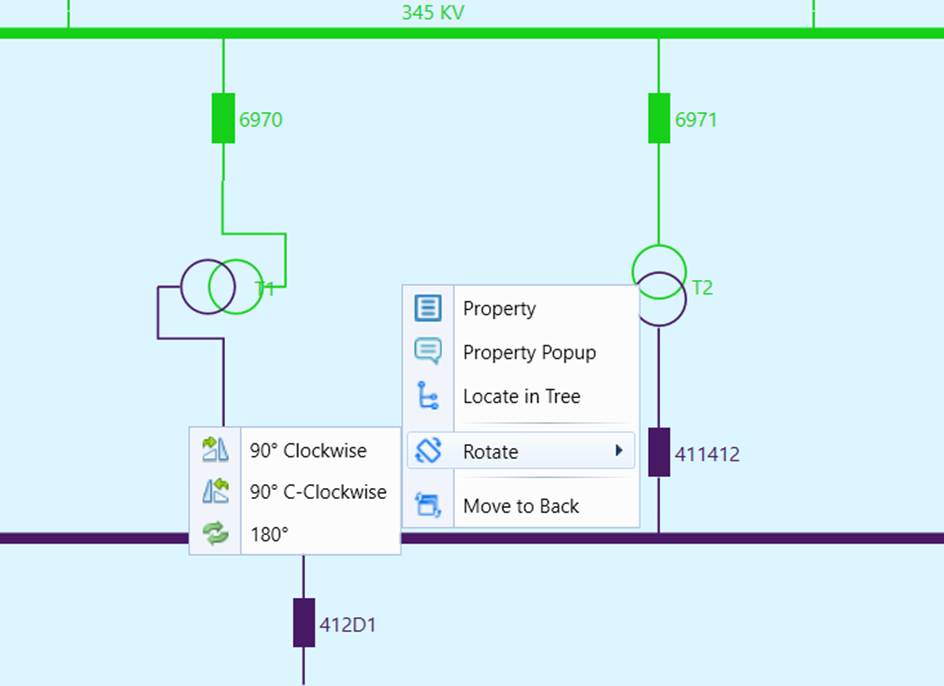
- Adjust the auto-generated diagram by dragging-and-dropping graphical symbols and text annotations, rotating the orientations, changing connection points, resizing buses….
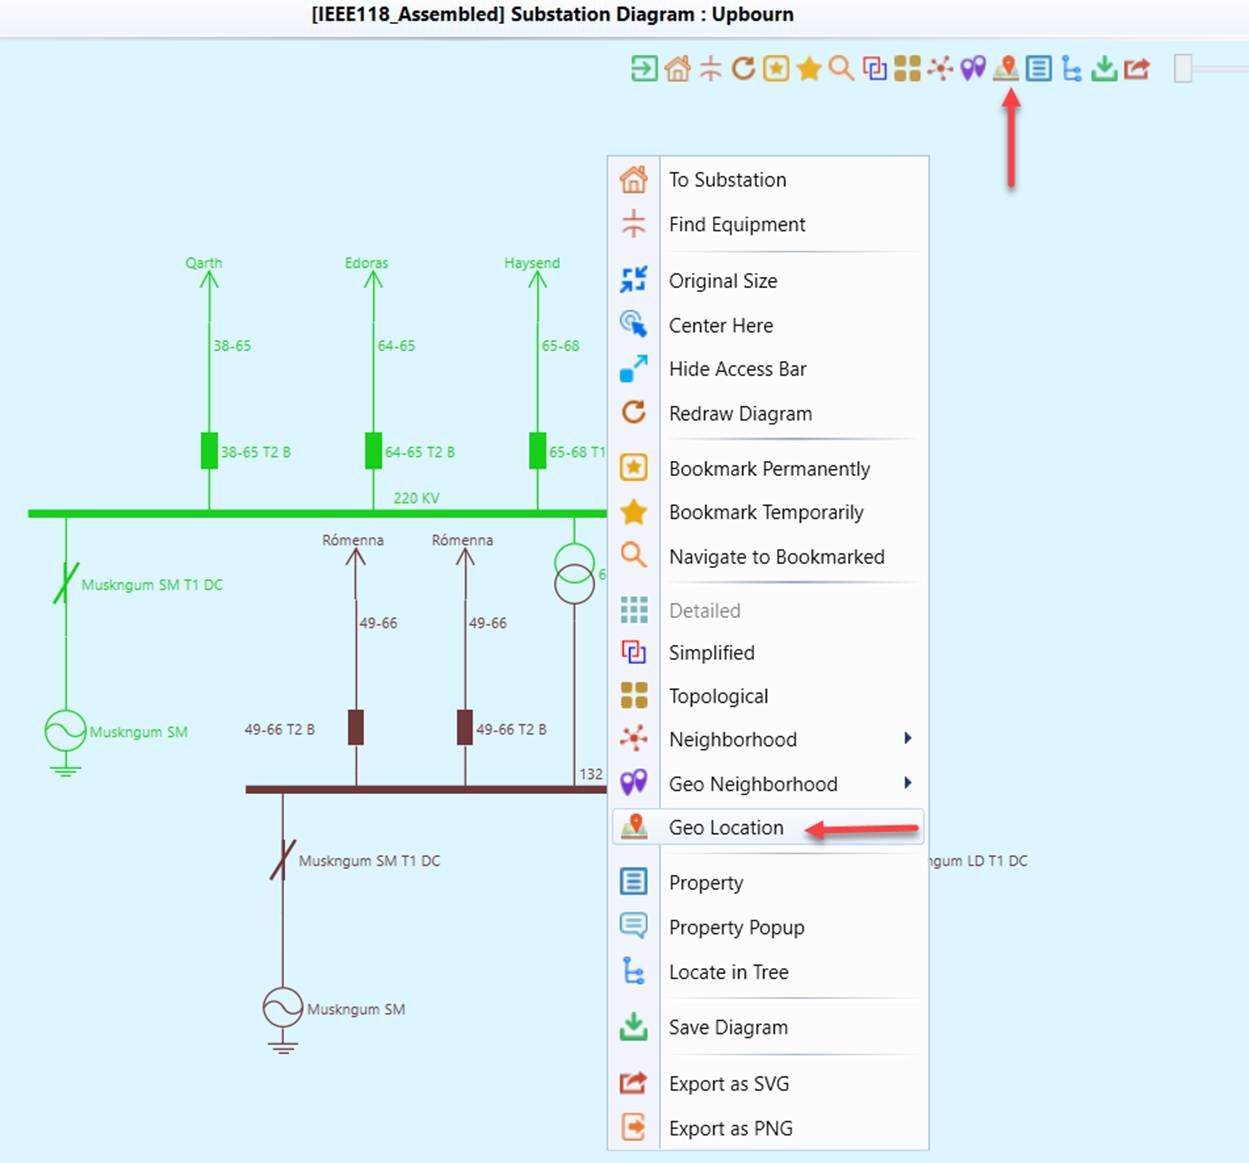
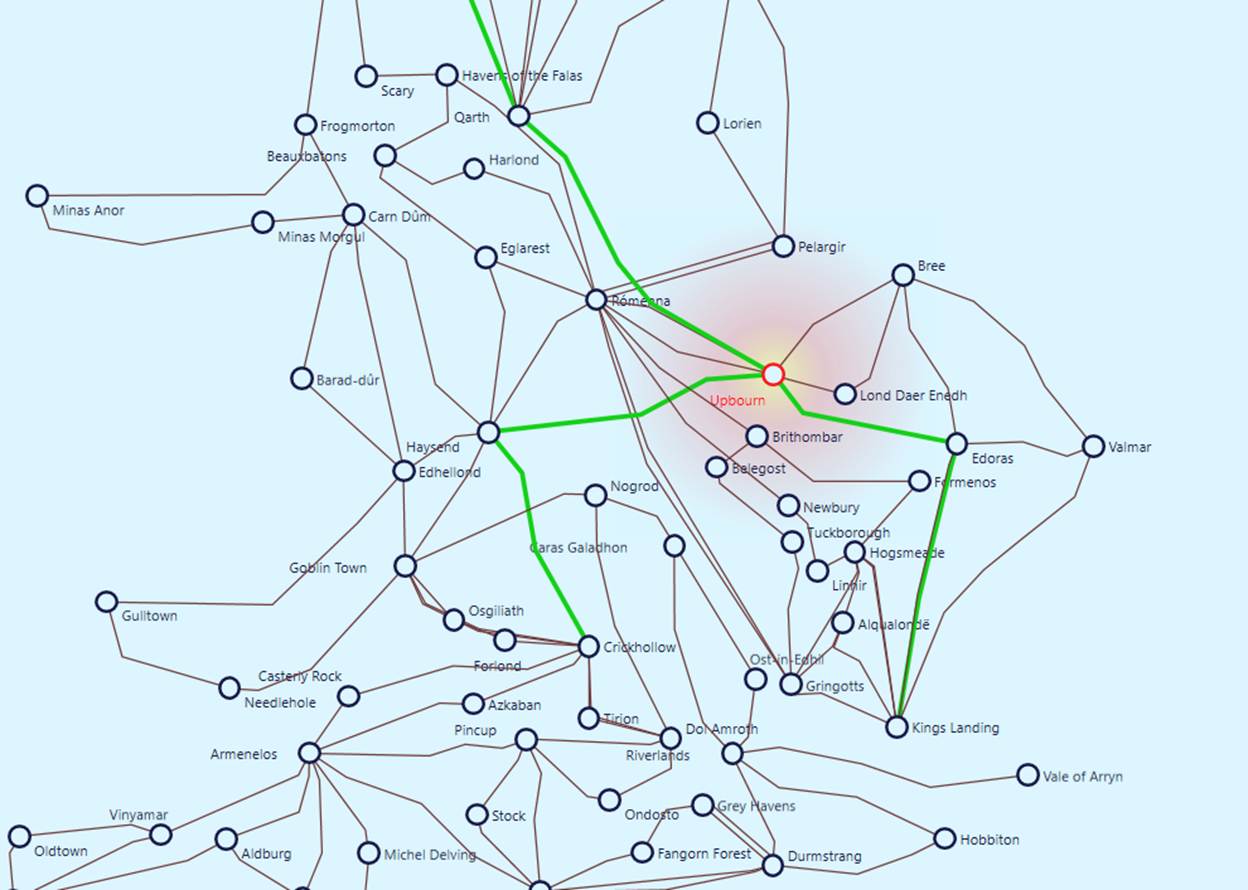
- Navigate to the corresponding Substation in a Geographical Diagram (if the geographical information is available)
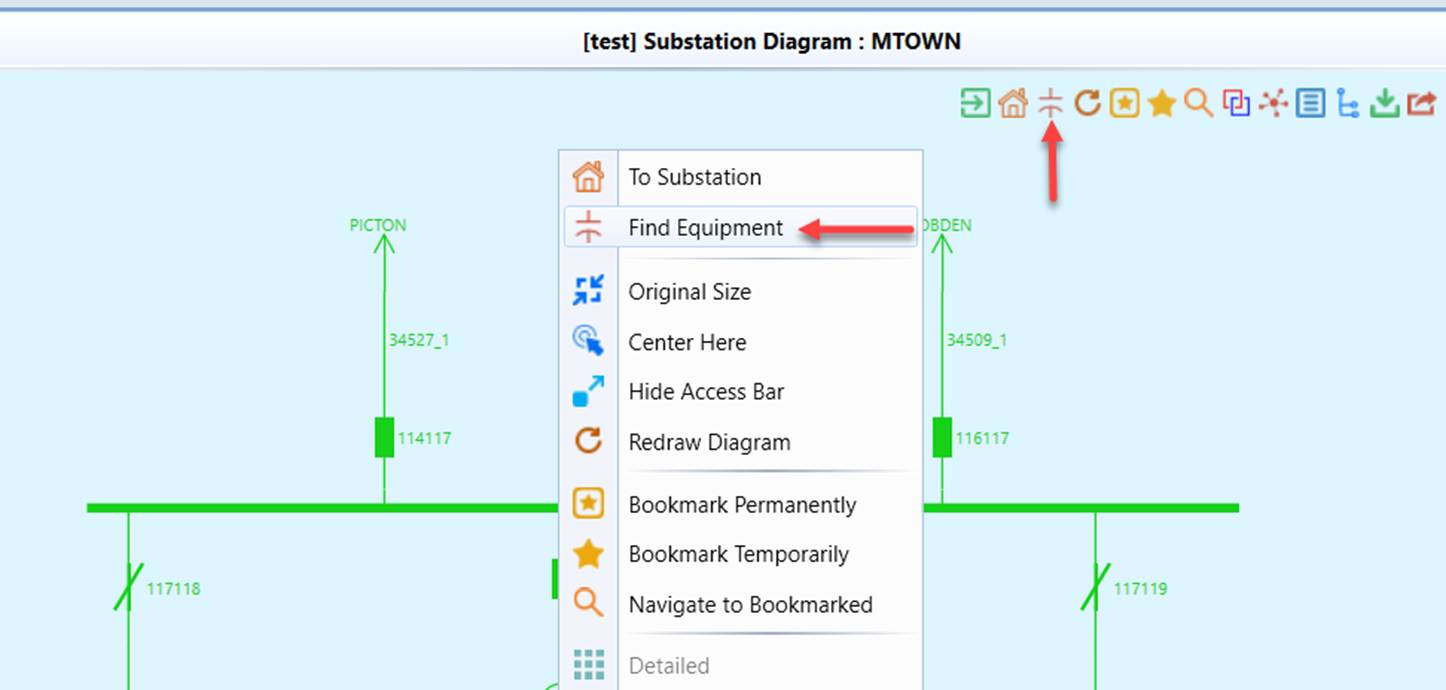
- The Tool provides a wizard to help users locate an equipment in a Substation Diagram. Some Substations contain many equipments. Finding an equipment many not be an easy task. While users can always find the equipment by navigating down in the Navigation Tree or through searching by names/IDs, it requires multiple manual steps, thus not convenient. The Equipment Location wizard provides an intuitive and convenient approach for users to locate an equipment in a Substation Diagram graphically.
- Navigate to a Substation Diagram and right-mouse click any blank spots and select the “Find Equipment” in the context menu item or click the corresponding command icon in the Quick Access Bar, as illustrated below.
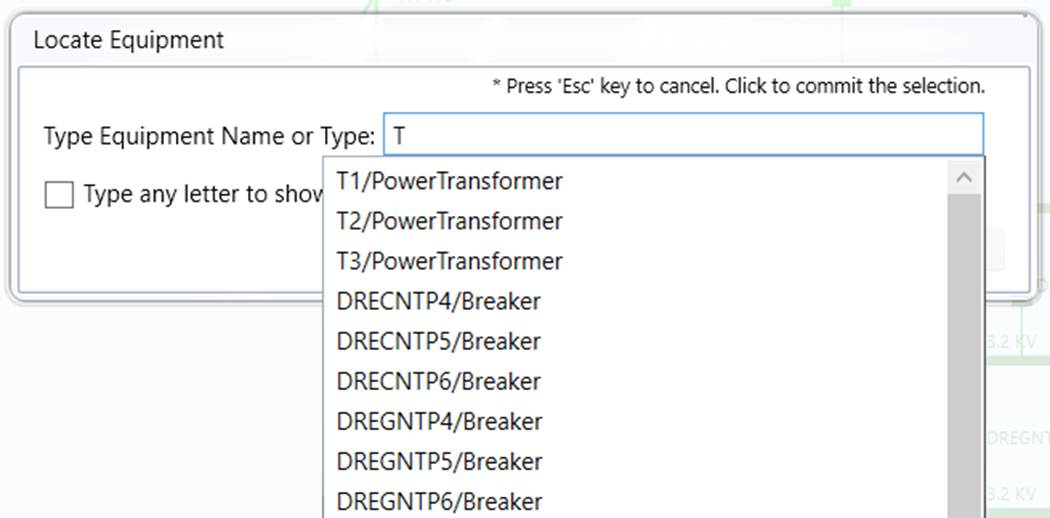
- The Equipment Location wizard will appear. Users need provide the clue to find the equipment (including ConnectivityNode). Typically, after users enter 2 to 3 letters, they shall be able to find the name/type pair from the hint list. Users can also simply enter 2 to 3 letters the equipment type, such as “Bre” or “Con”, the hint list shall list all of the equipments of that type, as illustrated below
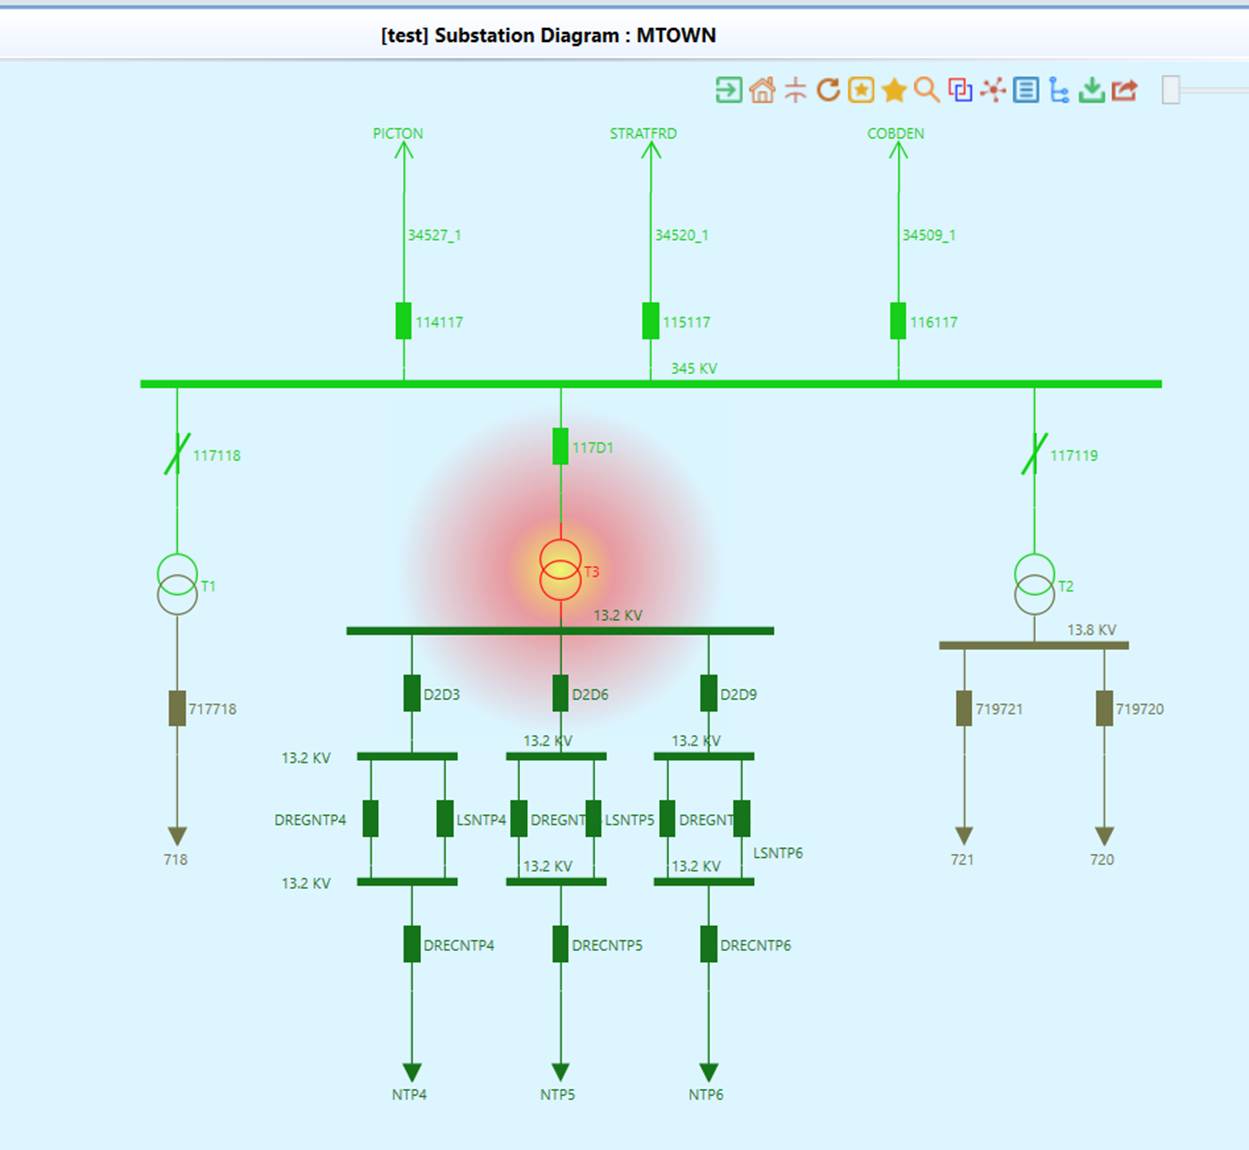
- Once users select an identified equipment from the hint list, the diagram will be panned/zoomed with the identified equipment shown in the centered and highlighted in red.
- Visualize all of the Substations in the model or belonging to a selected SubgeographicalRegion with one mouse clicking. See Auto Play for more details.
Note
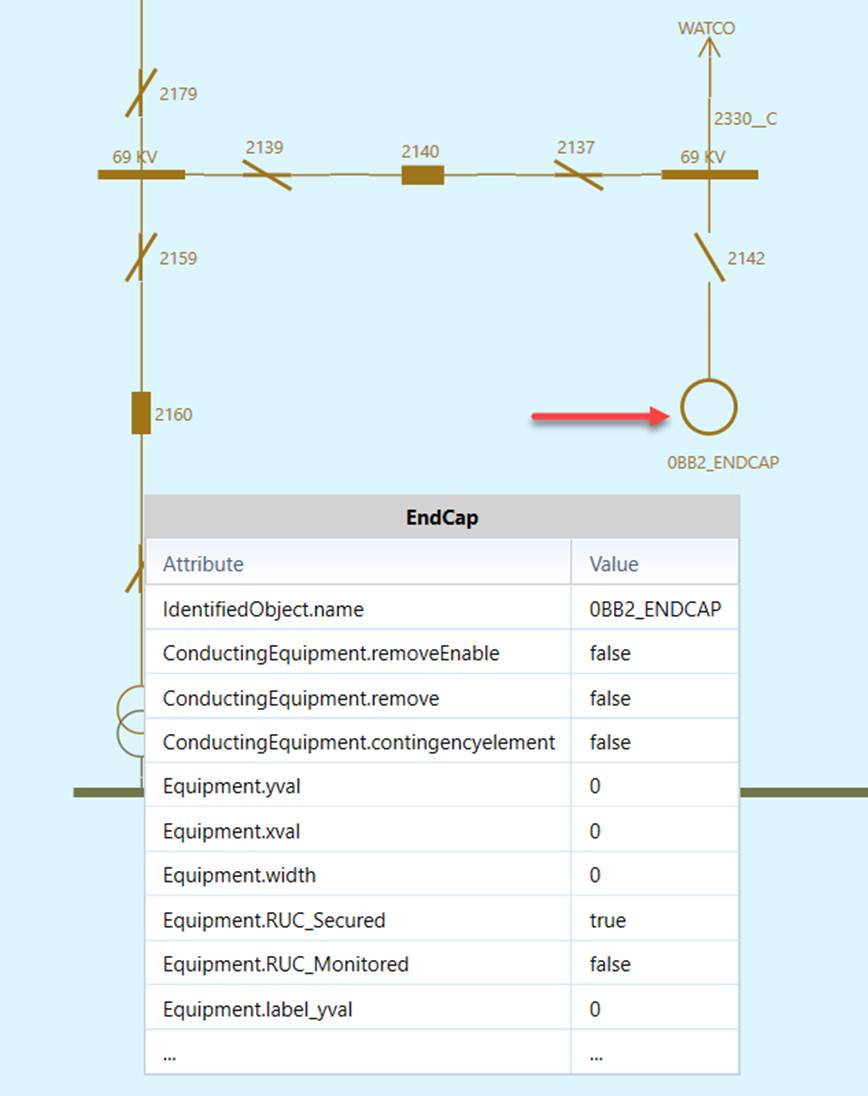
In the Substation Diagram, if the equipment is a ConductingEquipment not defined in the CPSM/ENTSO-E Equipment profile, it will be displayed as a generic equipment represented as a circle. For example, GroundDisconnector is a ConductingEquipment, but not defined in CPSM/ENTSO-E profile. It is displayed as a generic equipment as shown in the following diagram. In other words, any ConductingEquipments unknown to the Tool will be displayed as generic equipments.
Display Options
The Tool provides a variety of options, enabling users to display/hide the information in a Substation Diagram. The following screenshots illustrate what display options are available for a Substation Diagram.
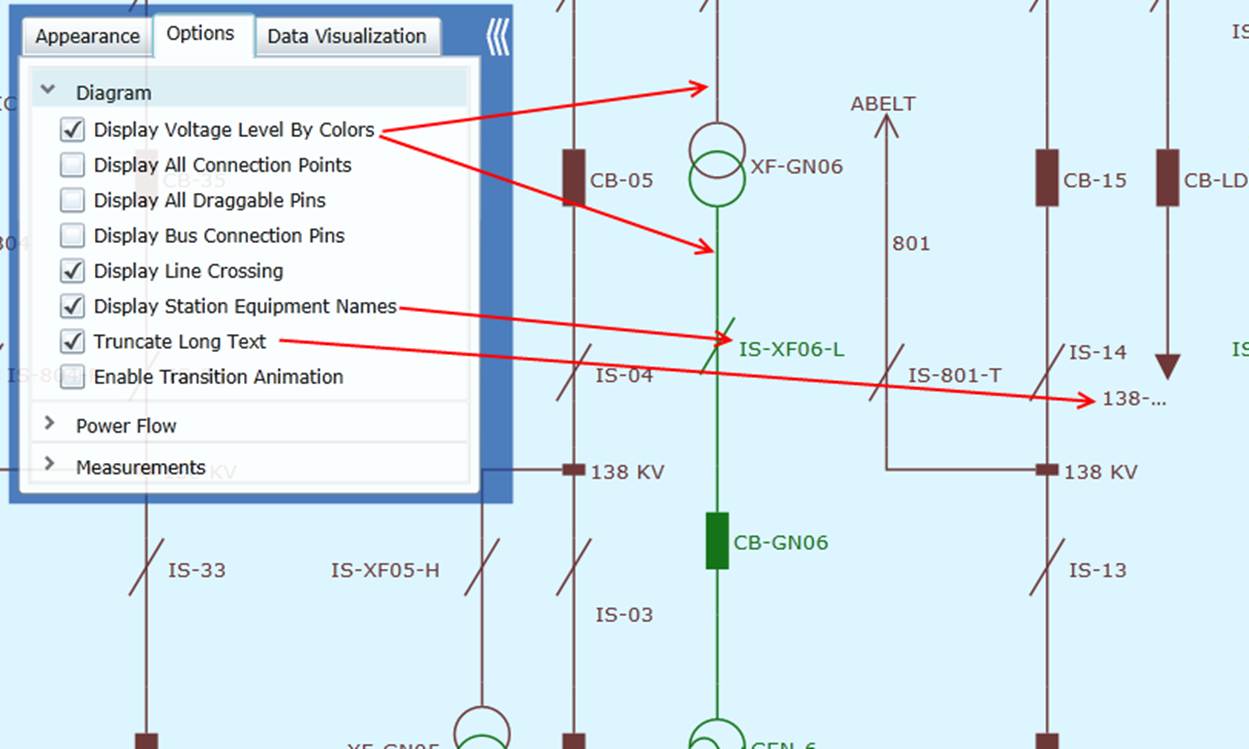
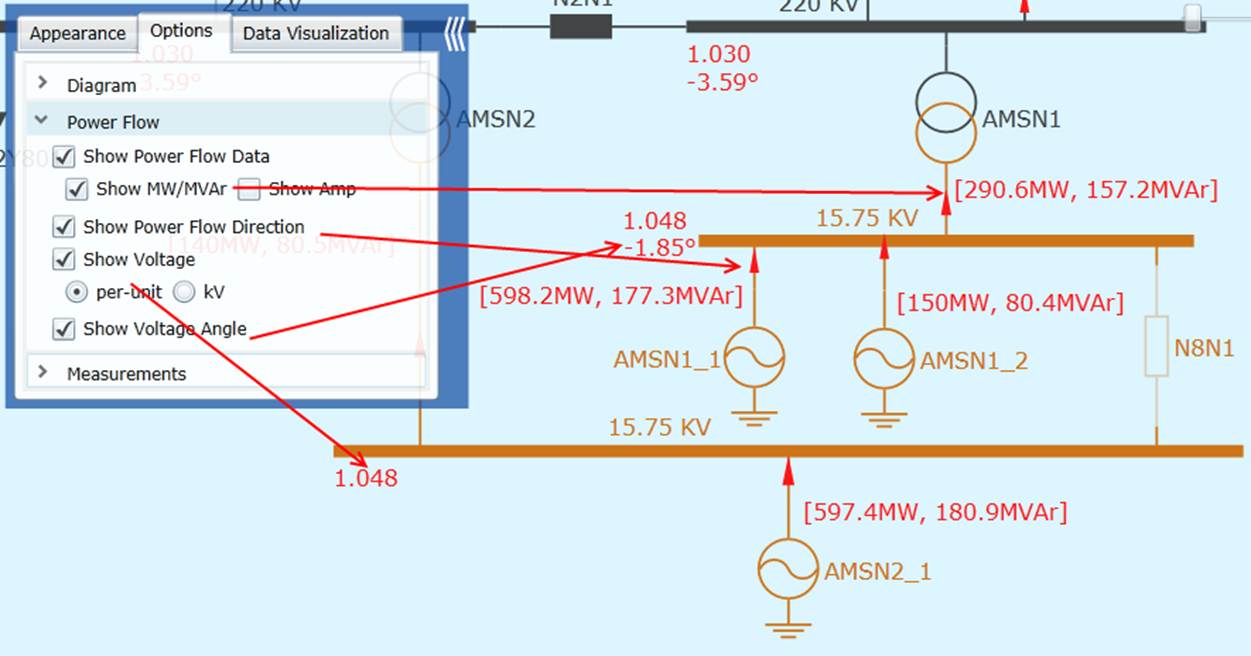
If the transformer flow is not included in the SV profile, it will not be shown on the diagram by default. Users can set the configuration below to enable the calculation of power flow on transformers. But keep in mind that the calculation may not be accurate for transformers with tap changer or phase shifter.
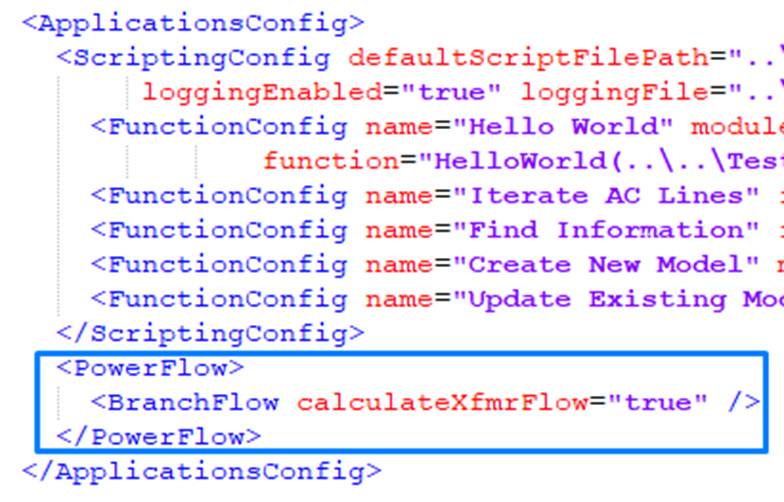
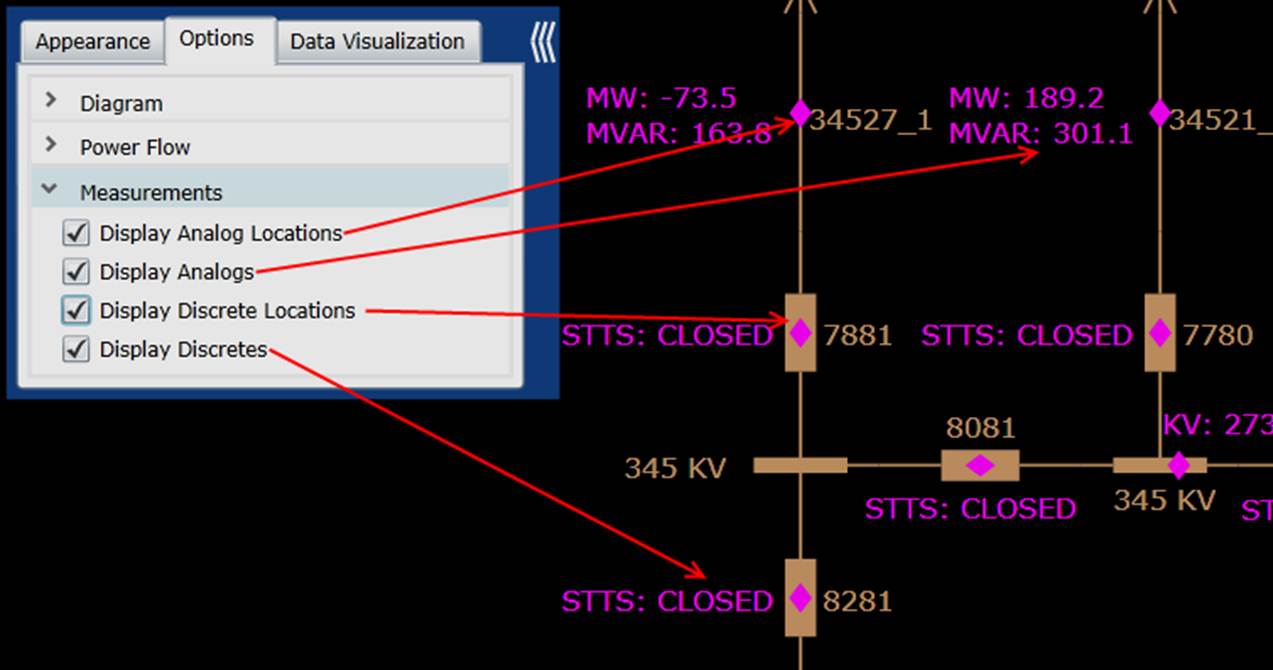
Diagram Adjustment
Users can adjust the Substation Diagram auto-generated for clarity and better look-and-feel.
Diagram Saving
Users can save the auto-generated or adjusted Substation Diagram and export it for future use or sharing with other applications.