Diagram Summary
Diagram Summary is a special kind of display. It is mainly designed to support Auto Play. When users run Auto Play to export the Substation Diagrams to a collection of SVG files, the Diagram Summary, which is auto-generated as a SVG file during the Auto Play process, provides an entry point for calling exported Substation Diagrams.
While mainly designed to support SVG Export, Diagram Summary provides an alternative way to call graphical displays.
Overview of Diagram Summary
A Diagram Summary simply lists names of a certain type of modeling entities alphabetically in a multiple page table. From the listed name labels, users call various types of graphical displays related to the selected modeling entity, as illustrated below. The selected display can be invoked by clicking the selected name label (for navigation) or via context menu associated with the selected name label. Diagram popup is also supported.
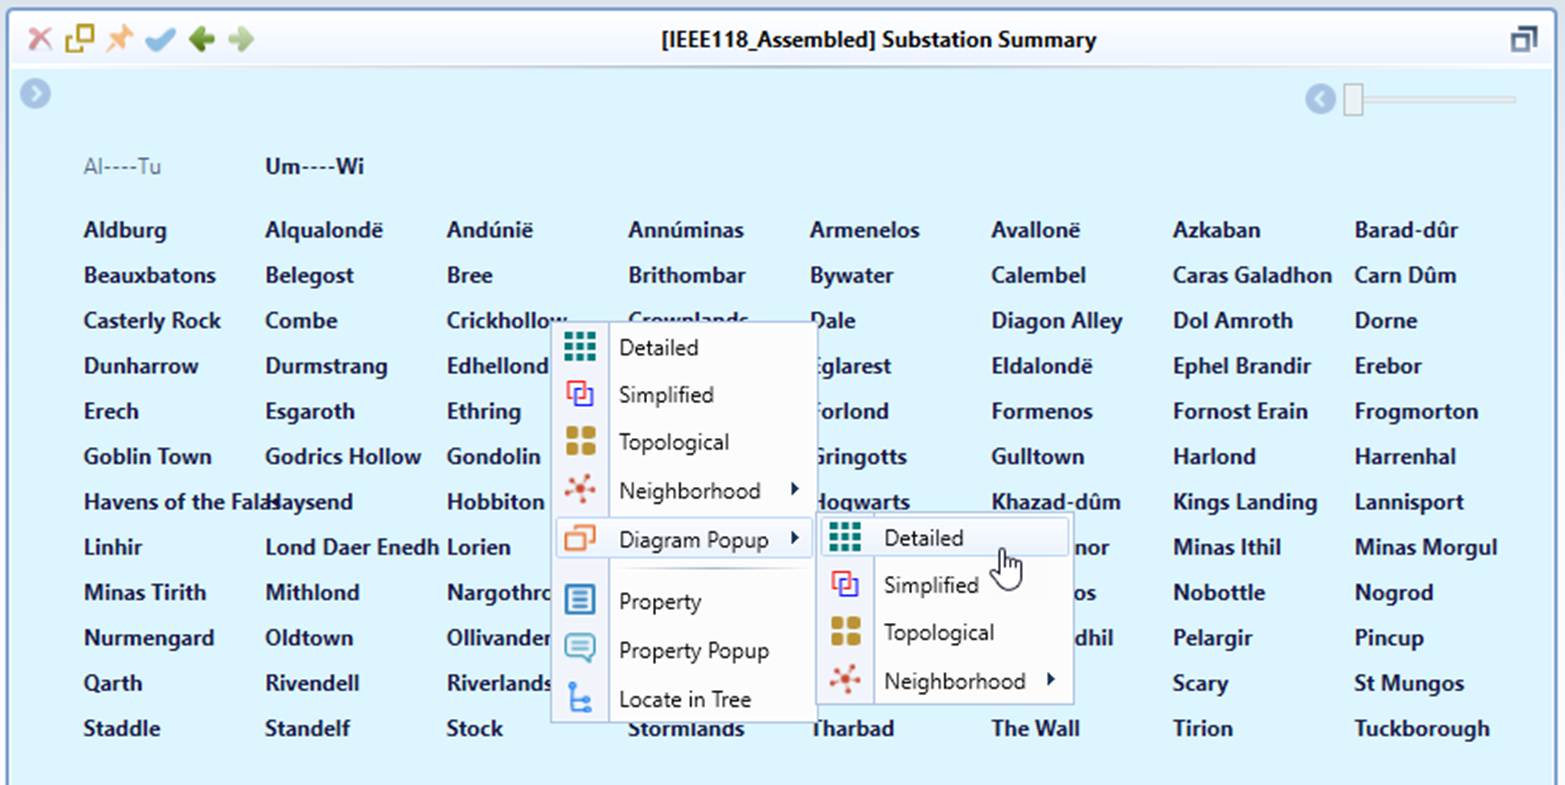
Diagram Summary is available for
- Substations
- Equipment
- ConnectivityNodes/TopologicalNodes
- Diagrams (saved or imported)
Generation of Diagram Summary
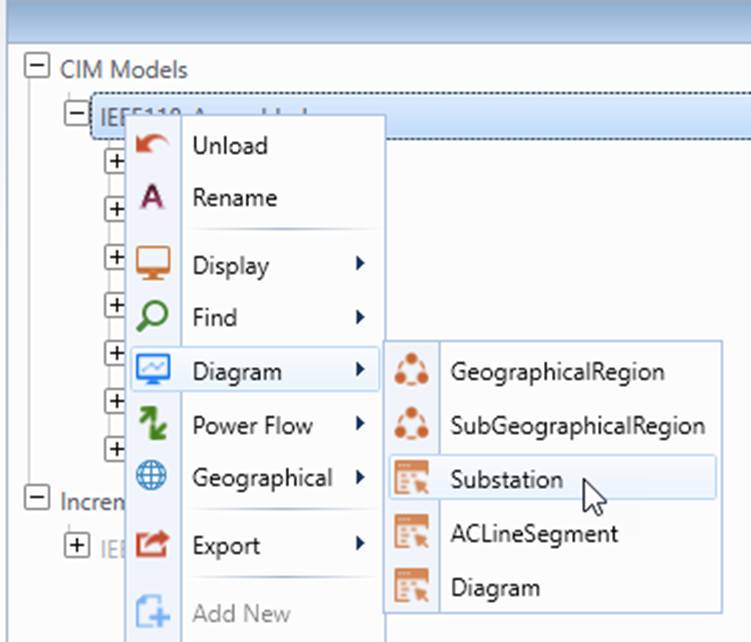
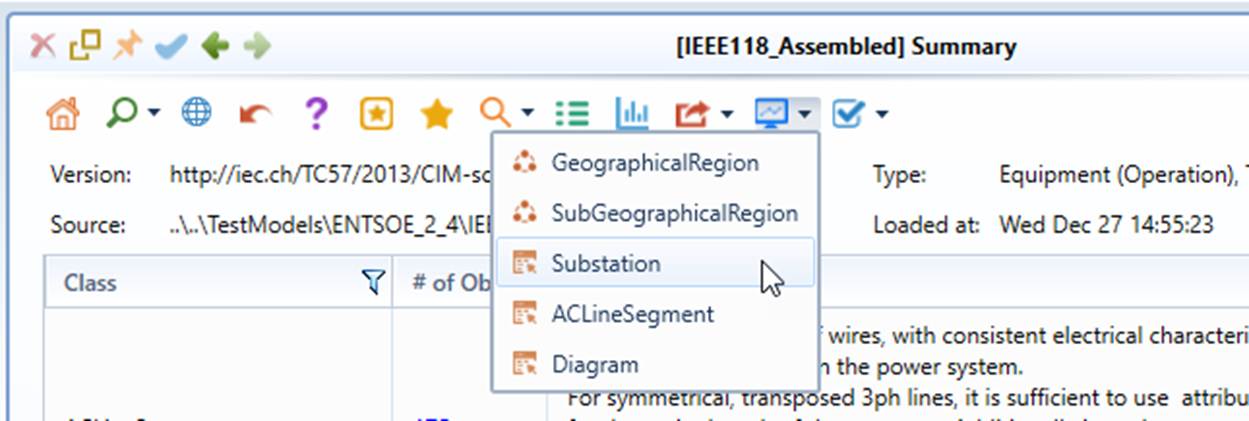
Diagram Summary can be auto-generated by clicking the corresponding command icons or via context menu at the model level or objects level. Frequently-used Diagram Summaries can be generated from the context menu associated with the model or command icons in the summary page of the model, as illustrated below:
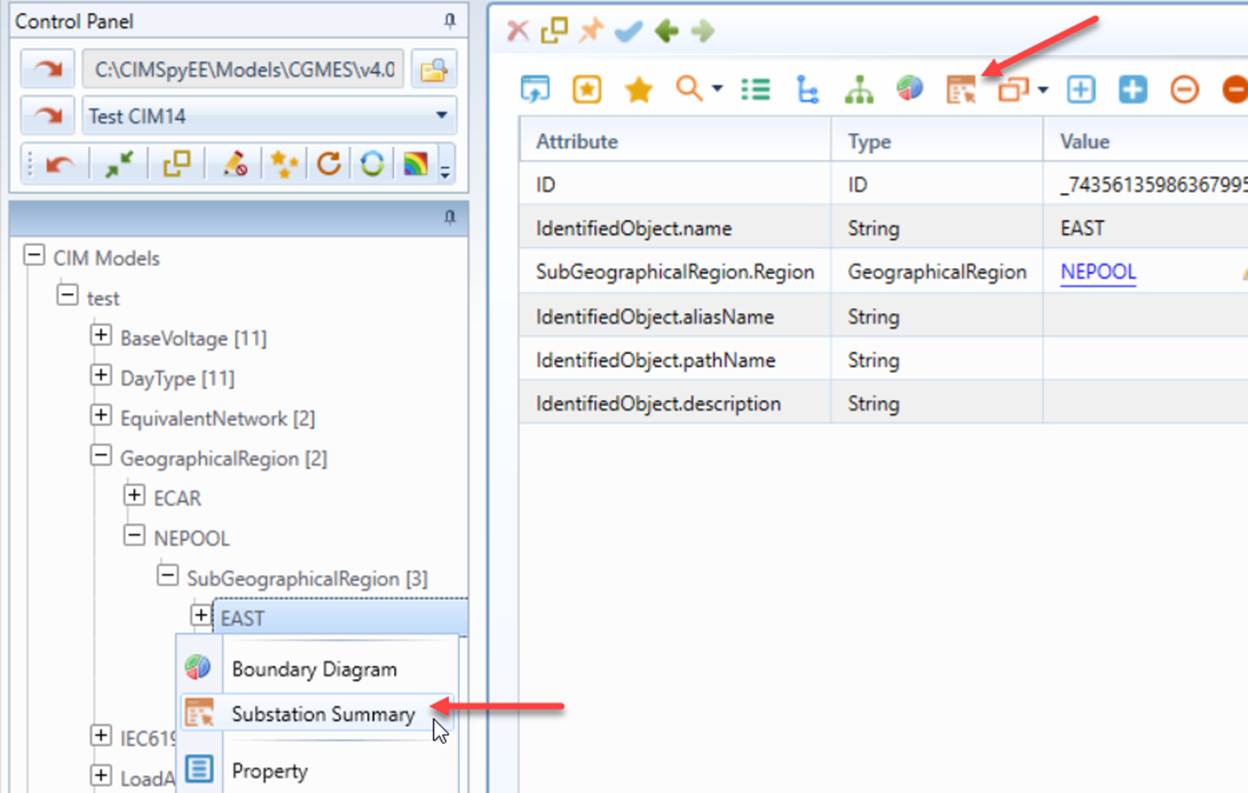
As a special case, the Substation Diagram Summary can also be generated for each selected GeographicalRegion/SubGeographicalRegion, as illustrated below.
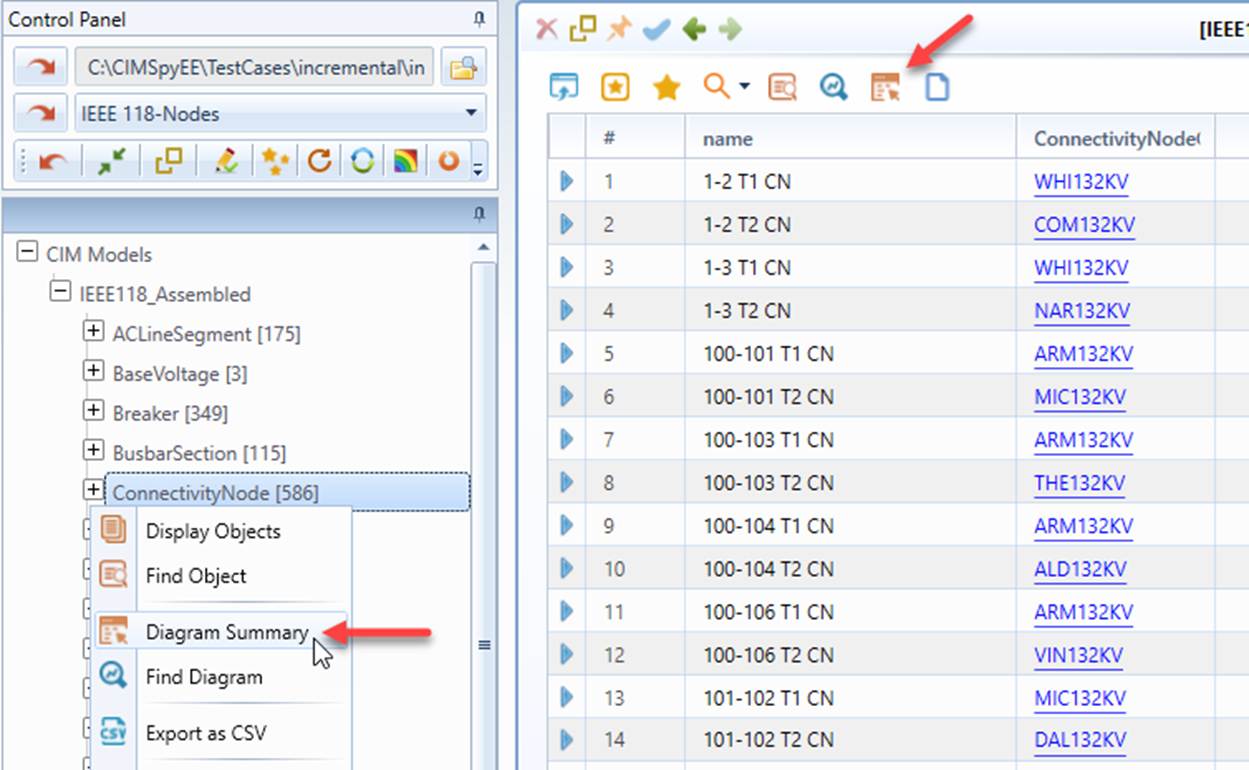
In general, Diagram Summary can be generated from the context menu of a category tree node that represents all of the network components (typically a root node in the Catalog Tree), or the corresponding command icon from a Tabular Display that lists all of the objects, as illustrated below.
Sorting of Diagram Summary
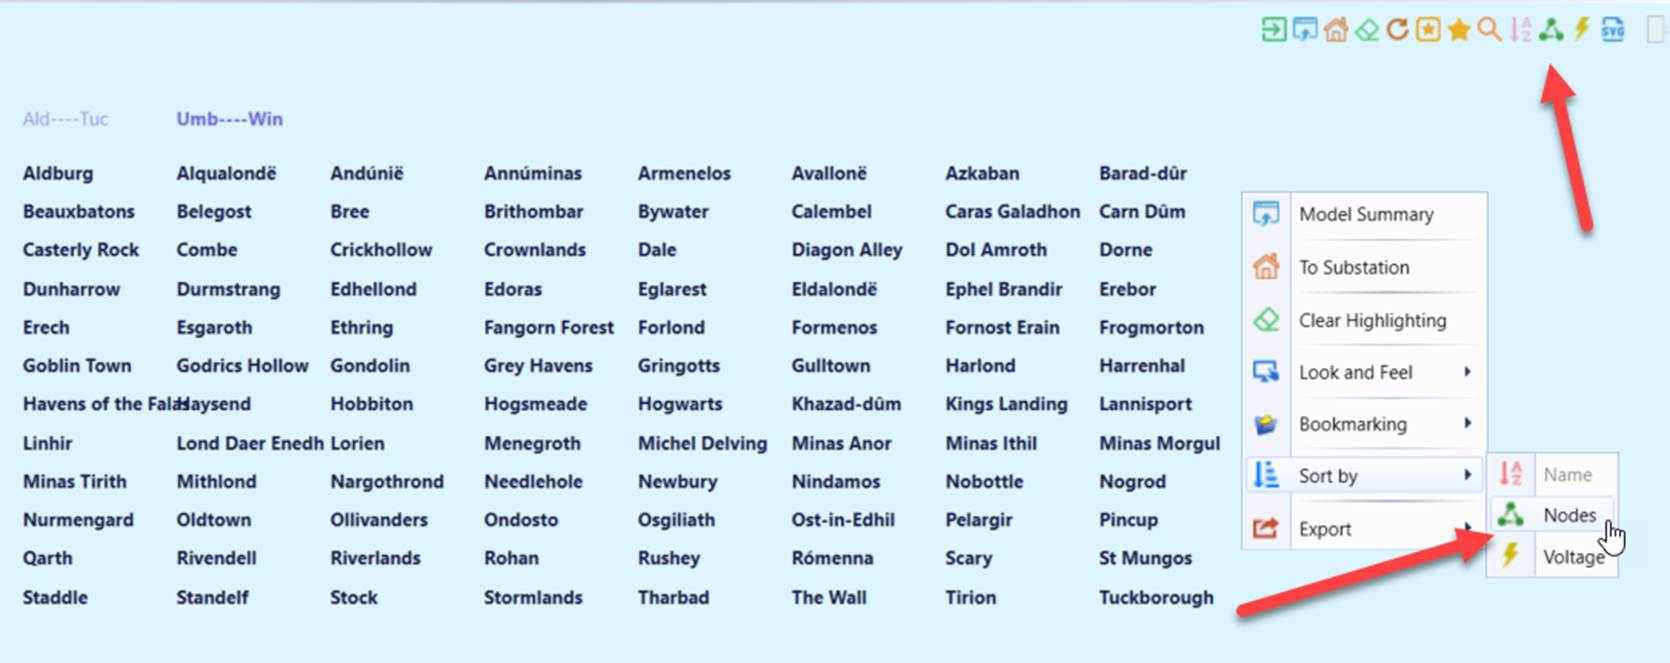
Diagram Summary can be sorted by clicking the icons on the upper right corner or via sort menu. Substations can be sorted by name, number of ConnectivityNodes, and maximum voltage—as illustrated below.
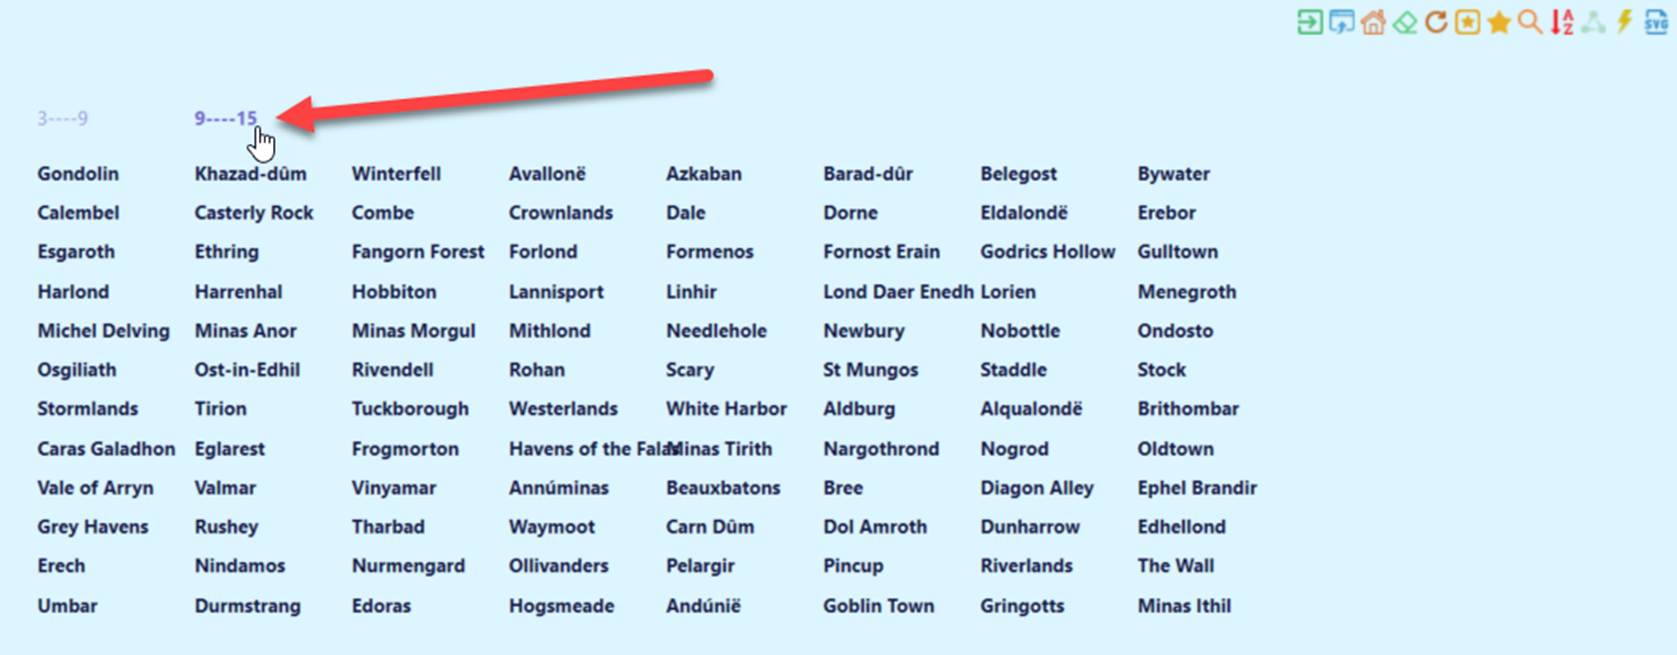
The page titles change based on the sorting criteria. In the example below, the substations are sorted by number of ConnectivityNodes.
Different types of Diagram Summary offer different sets of sorting options. Listed below are all the possible sorting options for each type:
Substations
- Name
- Number of ConnectivityNodes
- Maximum Voltage
ACLineSegments/TopologicalNodes/Equipment
- Name
- Maximum Voltage
Diagrams
- Name
- Number of DiagramObjects
Customization of Diagram Summary Display
Diagram Display is designed as a multi-page table. The table is designed to fit the most case. However, if the names are too long, overlapping may occur between name labels. In these cases, users can adjust the table layout to fit the long names. This is accomplished by changing the following parameters in AddonConfig/xml under \config\ui.

- rows: number of rows per page;
- columns: number of columns per page;
- columnWidth: width of each column in pixel;
- rowHeight: height of each row in pixel;
- initX: horizontal distance from the top-left corner of the table to the top-left of the display boundary;
- initY: vertical distance from the top-left corner of the table to the top-left of the display boundary.