Chart Display
Like graphical displays, chart displays are often used to help users visualize and understand data. Charts can usually be read more quickly than the raw data. The Tool provides two kinds of chart support:
- Built-in Support: Enabling users to visualize CIM schedules and curves, such as ConformLoadSchedule and ReactveCapabilityCurve; (Seen the sample below.)
- Plug-in Support: Allowing users to create their own charts in MQL or using Python script and plugin them into the tool. (See Power Plant Output and Line X/R Ratio charts in the sample below.)
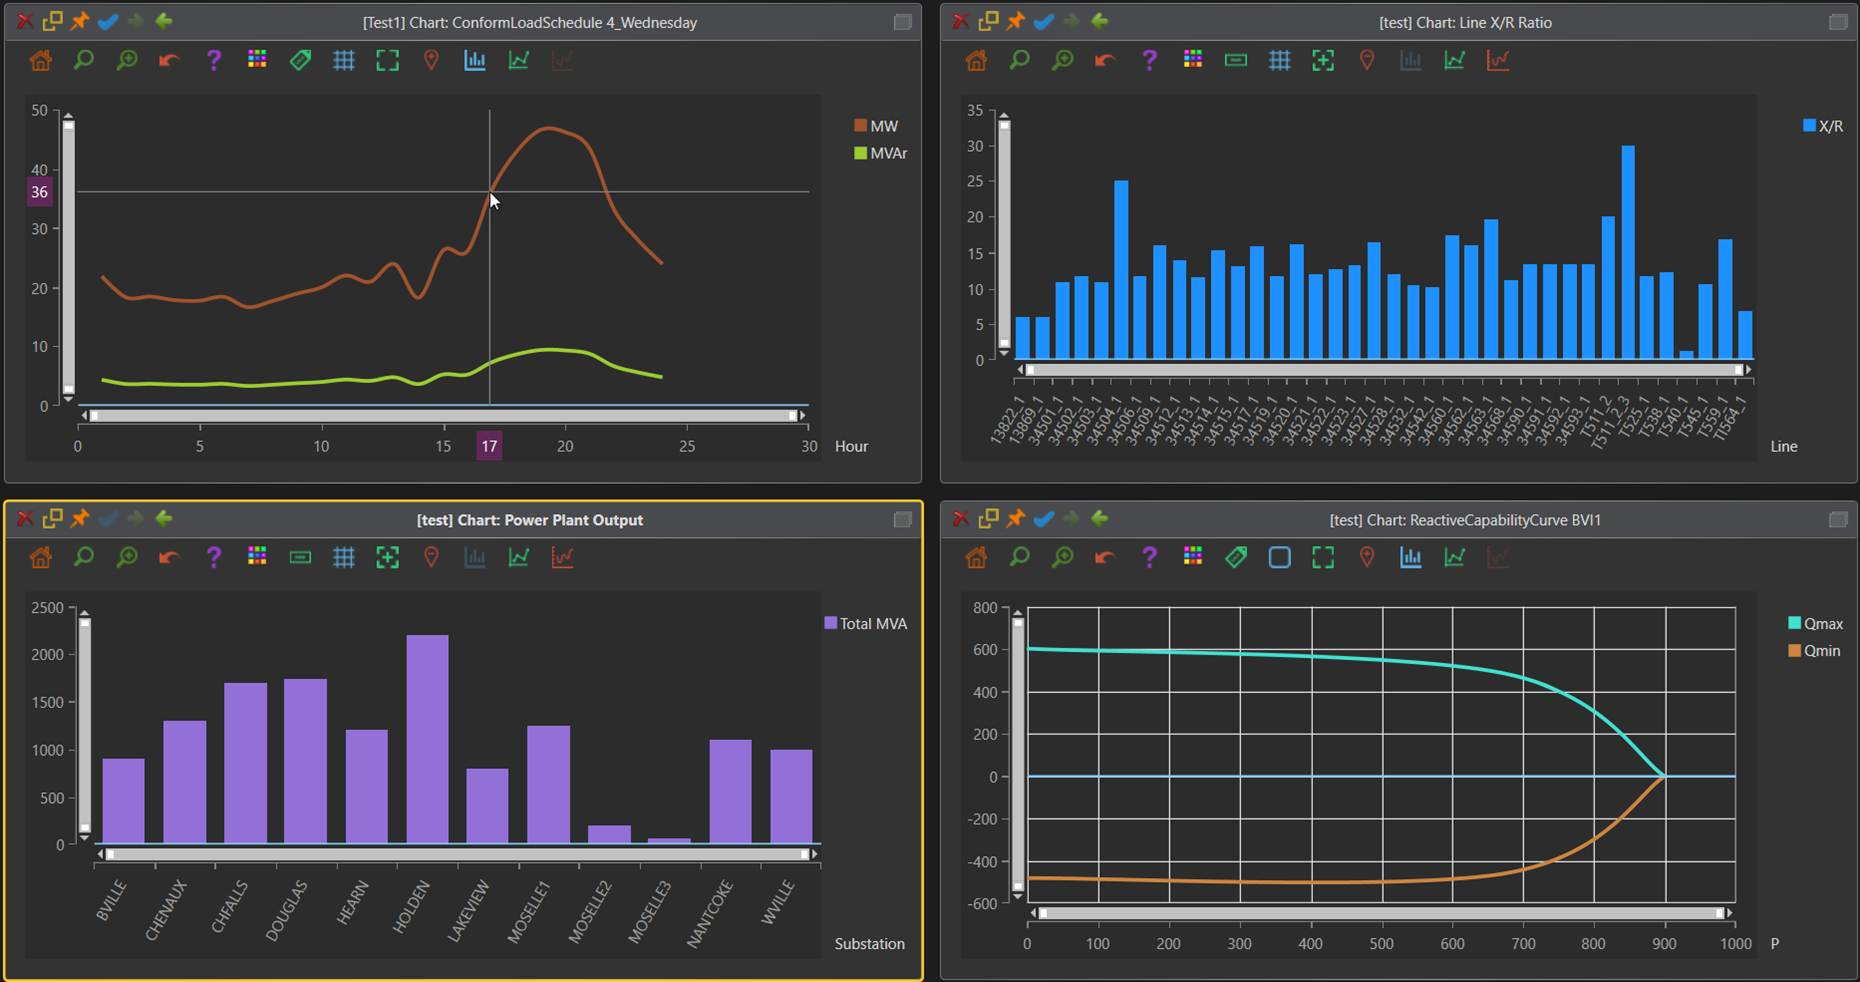
Data Type vs Chart Type
The data used to plot charts can be classified into two groups:
- Quantitative Data: the data where the values can change continuously, even though the raw X/Y values are provided as a collection of discrete data sets. Most of CIM schedules and curves are quantitative charts. Quantitative charts are typically presented as line/spline charts.
- Categorical Data: the data that are discrete in nature. For example, the two bar charts in the above example. Categorical charts are typically presented as bar charts.
Any charts displayed in the Tool, including built-in charts, are specified with View Definitions, where the chart type can be specified. If not specified, the Tool relies on the following rules to set the initial types of the charts
- If all of the X-axis data are numerical, the data type is assumed to be quantitative. The X/Y datasets will be sorted and presented as line/spline charts by default.
- If at least one of the X-axis data is not numerical, the data type is assumed to be categorical, and the data will be presented as bar charts by default. The original order of X/Y datasets will be retained.
Regardless of data types, chart types are interchangeable, as described in section “Stylish Charts”
Built-in Support
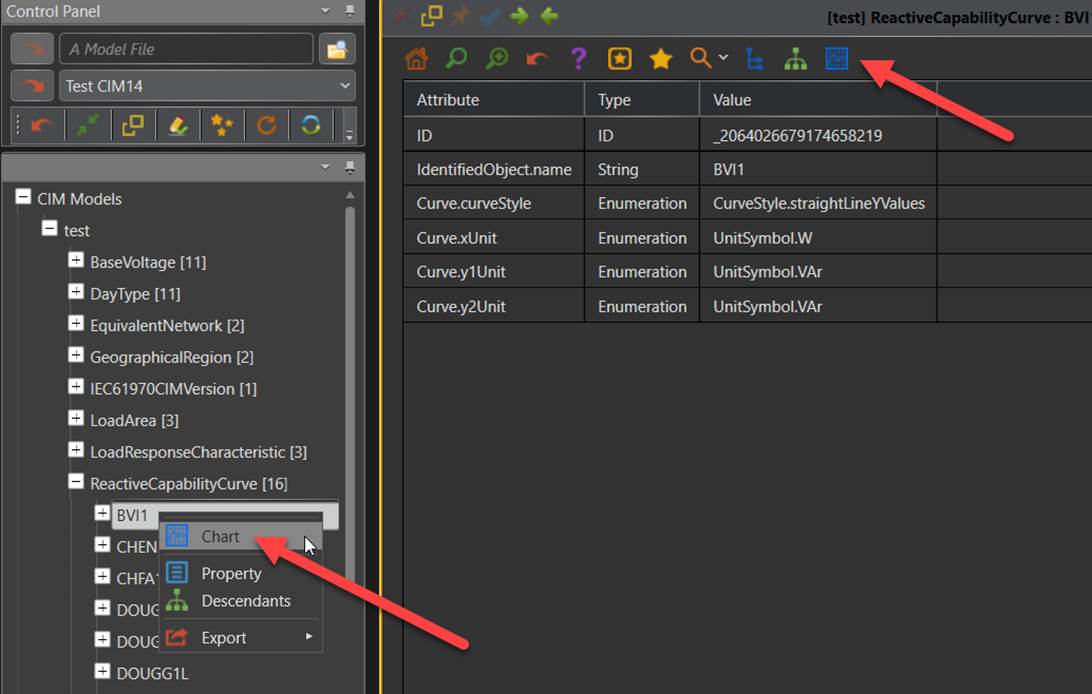
A built-in chart display can be called by directly clicking the corresponding tree item or invoking from either a context menu or an icon associated with recognized curve or schedule object, as illustrated below.
Plug-in Support
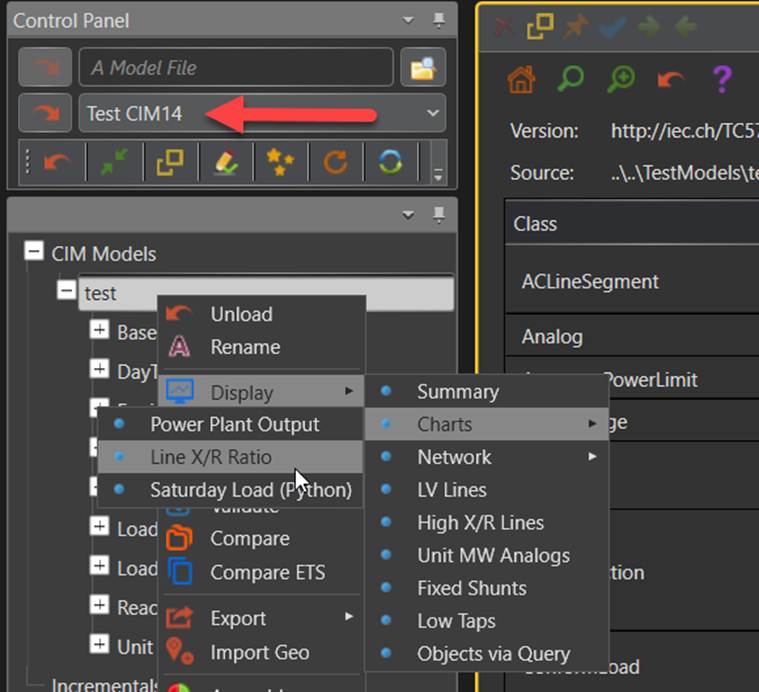
Users can also define their own charts in MQL or using Python script and plug them into the Tool. Samples are provided to show users how to define custom charts. The sample custom charts can be displayed by loading “Test CIM14” and invoking Display→Charts→…, as illustrated below. The first two samples are in MQL, while the 3rd is based on Python scripting (defined in \scripting\Chart.py).
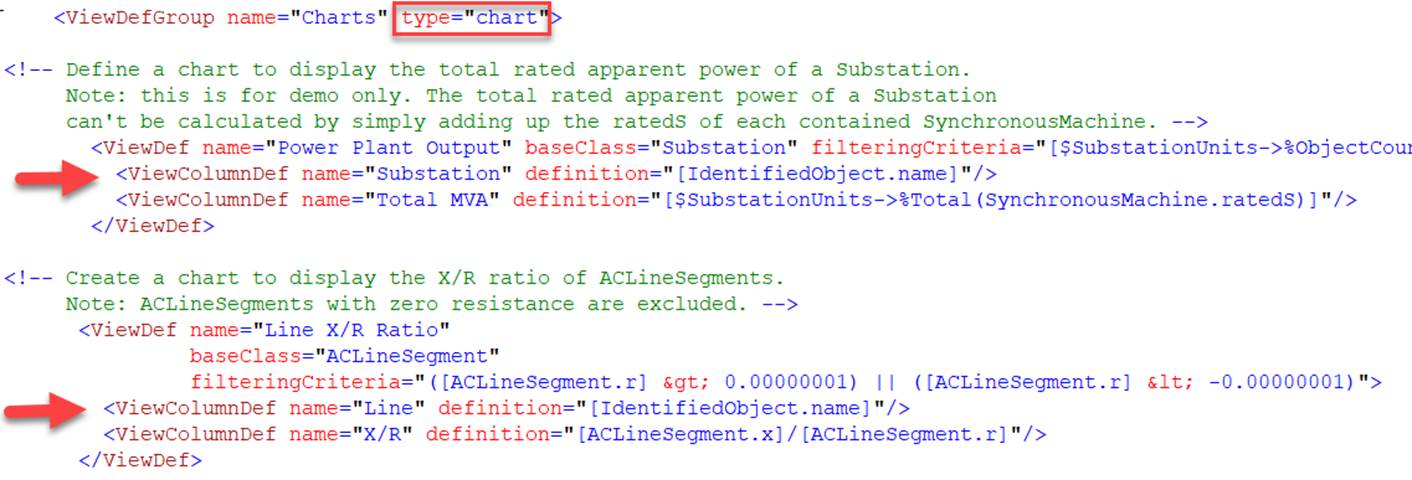
A chart can be defined and plugged –in just like a View or Report with the following conventions
- The type attribute of ViewDefGroup must be set as “chart”;
- The first ViewColumnDef serves as X-axis.
Stylish Charts
Users can style the chart once it is displayed. The style of the chat can be changed with the related icons in the Quick Access Bar, as illustrated below.
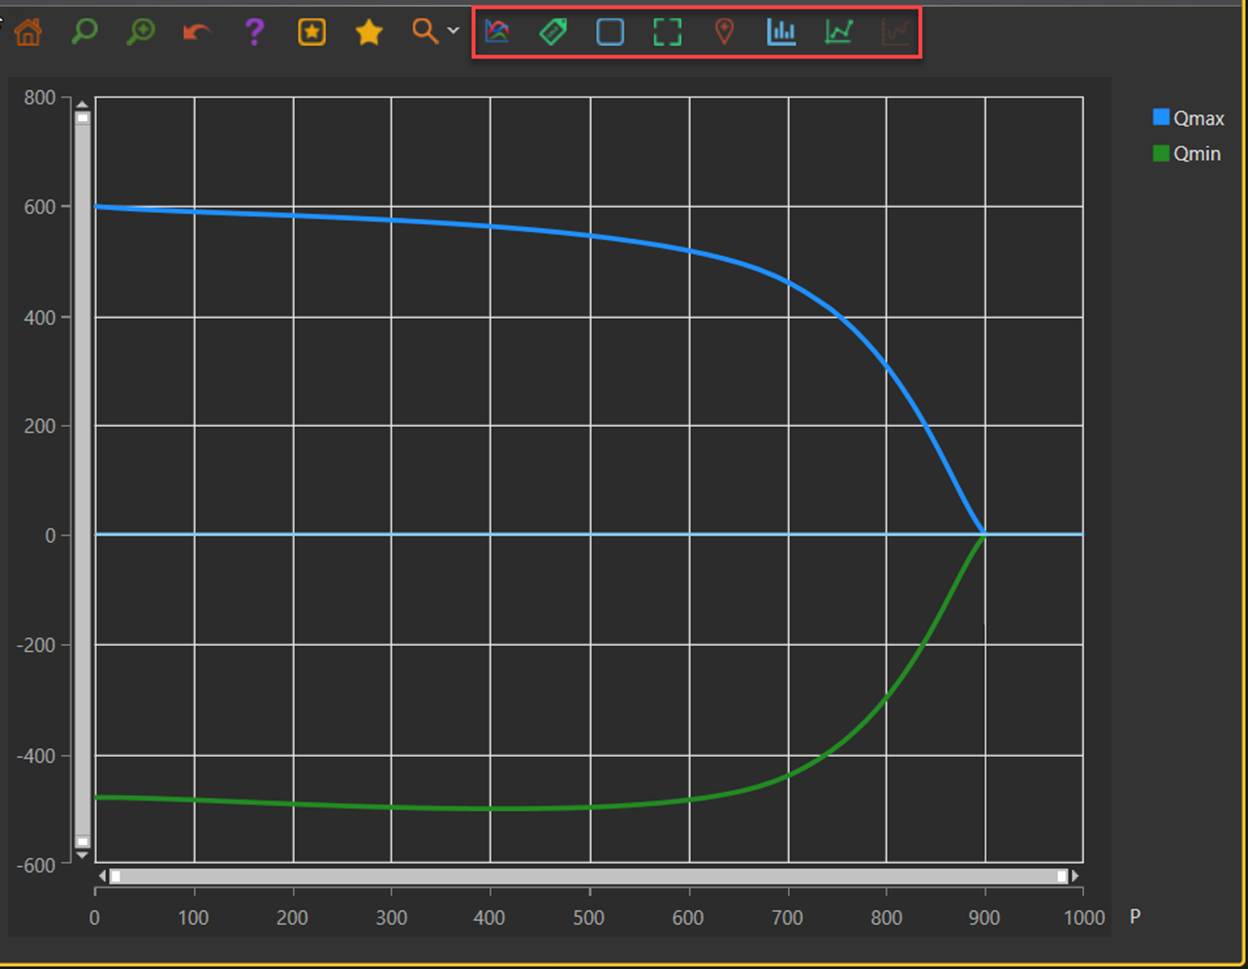
The following style settings are supported:
Type of Style
Related Icons
Description
Change of Colors

Change the color of the chart
There are 20 built-in colors that users can choose for the displayed charts. This is achieved by licking this icon till a desired color is found.
Rotation of X-axis Labels

Rotate the X-axis Labels
If X-axis labels are too crowded, typically for category charts, users can rotate the labels to make them not overlapped. The Tool has some built-in mechanism to set the initial default value.

Position X-axis Labels horizontally
Enabling/Disabling of Grid

Add the grid to the chart display
The added grid helps users read the chart. By default, it is enabled.

Remove the grid
Enabling/Disabling of Crosshair

Enable cross-hair behavior
Cross-hair behavior is used to help users read the chart. It tracks the mouse movement and marks the X/Y values of the current mouse position. With cross-hair support, users can find the corresponding X/Y values at any points. By default, cross-hair behavior is enabled for quantitative charts and disabled for categorical charts.

Disable cross-hair behavior
Enabling/Disabling of Trackball

Enable trackball behavior
Trackball behavior is used to help users read the raw X/Y points. Raw data are discrete. When users move the cursor, the trackball shows the closest raw X/Y values. By default, trackball behavior is disabled for quantitative charts and enabled for categorical charts.

Disable trackball behavior
Change of Chart Type

Display the data as a bar chart
While these chart types are interchangeable, bar charts are typically for categorical charts, line/spline charts are for quantitative charts. This is how Tool set the initial values based on the X-axis data or user specification.

Display the data as a line chart

Display the data as spline chart
Customize Charts
While the Tool has some built-in mechanisms to set the default styles and chart types for displayed charts, users can customize the charts in the View Definitions of the charts by using a string similar to Cascading Style Sheets (CSS) specification. The style specification is applicable for both built-in and plug-in charts. The built-in charts, for example, are specified by a collection of view templates in \config\view\DefaultChartTemplate.xml. Users can customize the built-in charts using CSS-like style strings, as shown below. The style CSS string can be specified either at view level or column level. In the former case, the specification applies to all of the columns. The column style specification overwrites the view style specification.

As a result of the above customization, the following figure shows the customized charts.
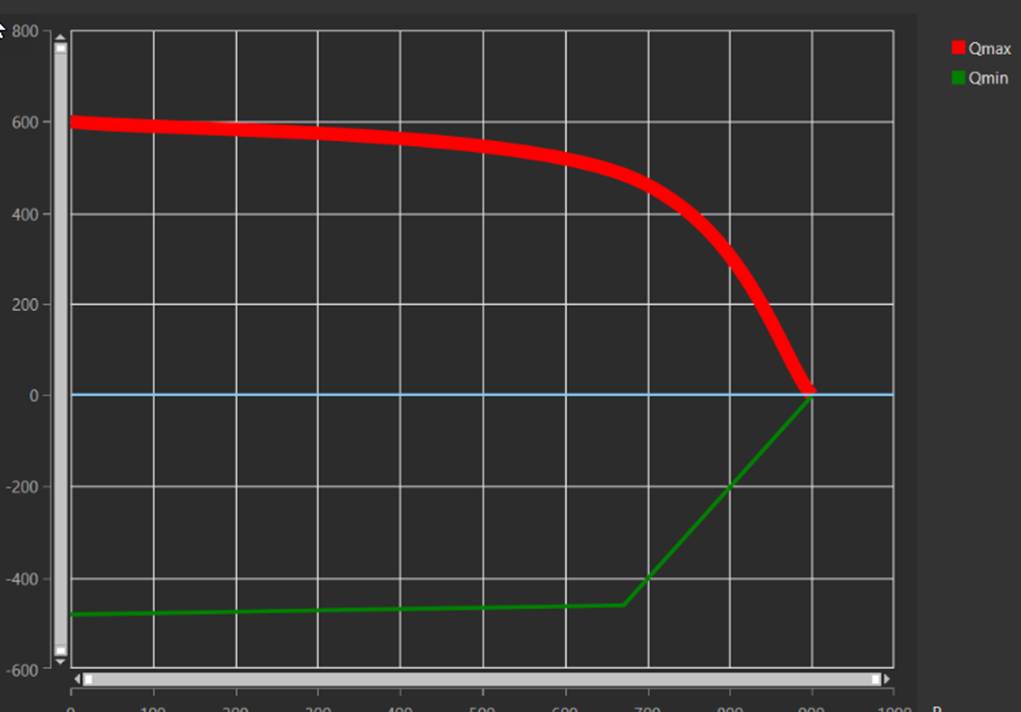
More specifically, the style string can be specified as a set of key/value pairs separated by ‘;’, i.e. “key1:value1; key2:value2; key3:value3…”
The following style key/value pairs are currently supported:
| Key | Value | Description |
|---|---|---|
| type | line; spline, bar | Type of the chart |
| color | red, blue, #B22222, #006400 … | Color in name or hex code |
| thickness | any integer between 0 and 20 | Thickness of line in pixel |