Boundary Diagram
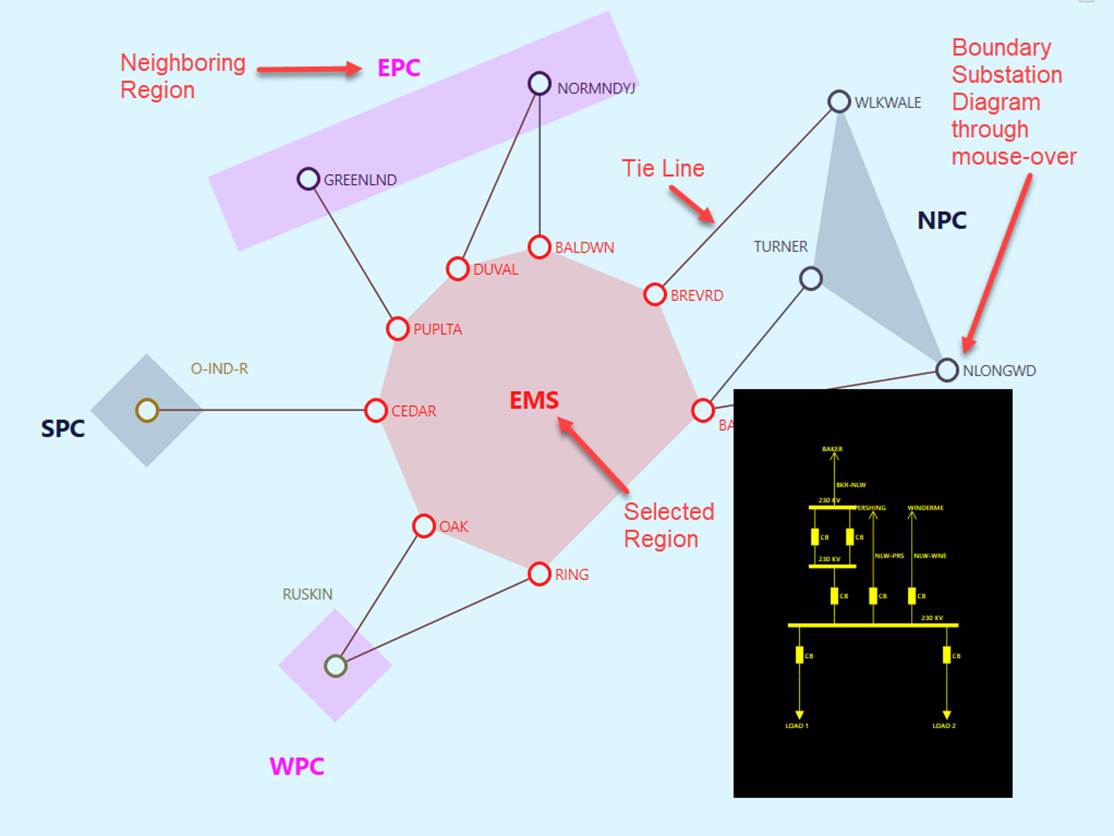
Boundary Diagram is to show all the boundary stations and the tie-lines for a selected Geographical/Sub-Geographical region.
Understanding Boundary Diagram
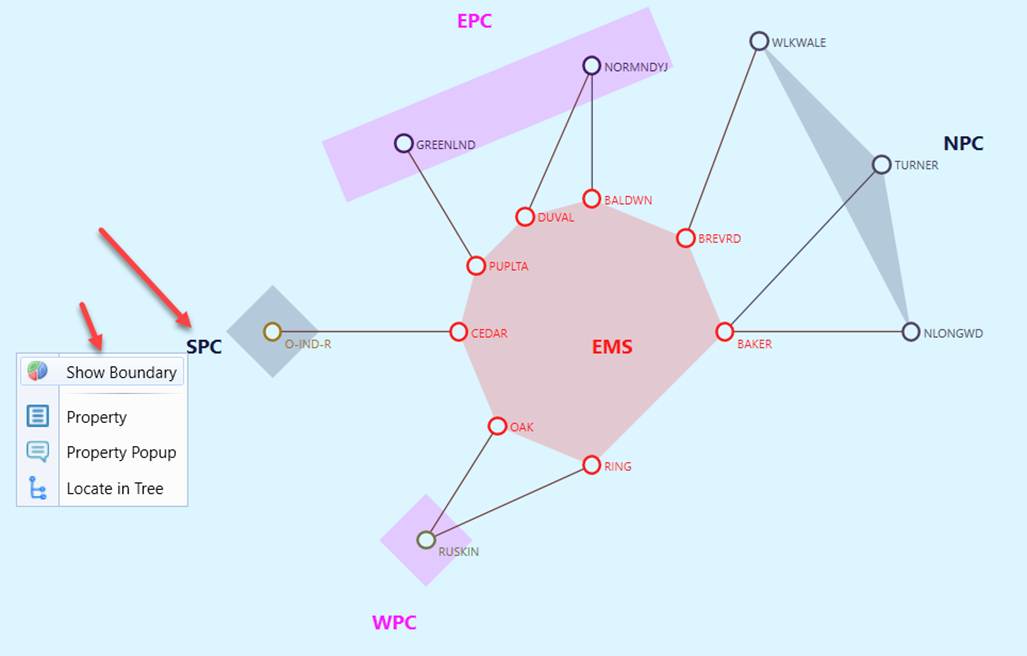
The Boundary Diagram was designed to support the exploration of tie-line connectivity at the Geographical/SubGeographicalRegion level (or HostControalArea/SubControlArea for CIM 10). The selected region is display at the center of the diagram, highlighted in red. All neighboring boundary regions are placed around the center region. Inside each region, all boundary stations are displayed. Tie-lines connect boundary stations between center region and other regions. Region names are displayed in the same color as the region shapes. All stations and tie-lines have the standard mouse-over popup display and navigation capabilities.
Note
If the tie-line contains an XNode, the XNode will not be treated as external Substation. The real external Substation (on the other side of the XNode) will be identified and displayed as external Substation in the boundary diagram.
Calling a Boundary Diagram
There are several ways to call a Boundary Diagram:
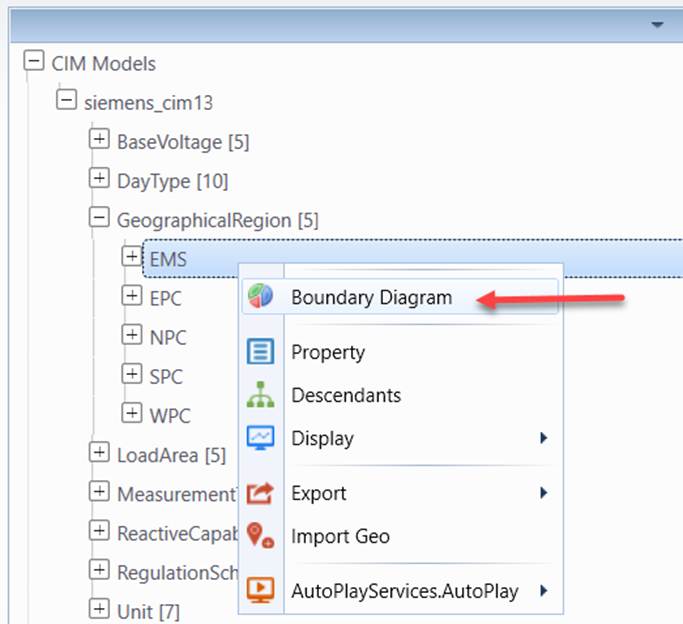
- Context menu associated with Geographical/SubGeographicalRegions (or HostControalArea/SubControlArea for CIM 10) in the navigation tree
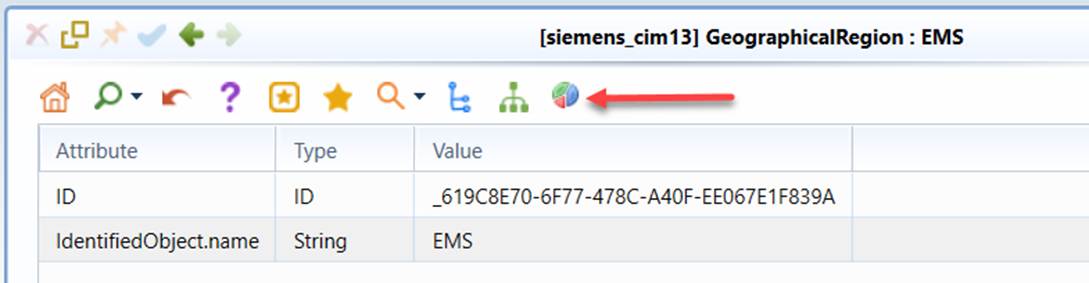
- Command Icon in the Geographical/Sub-Geographical Region Object Form
- Context menu in the Region Diagram
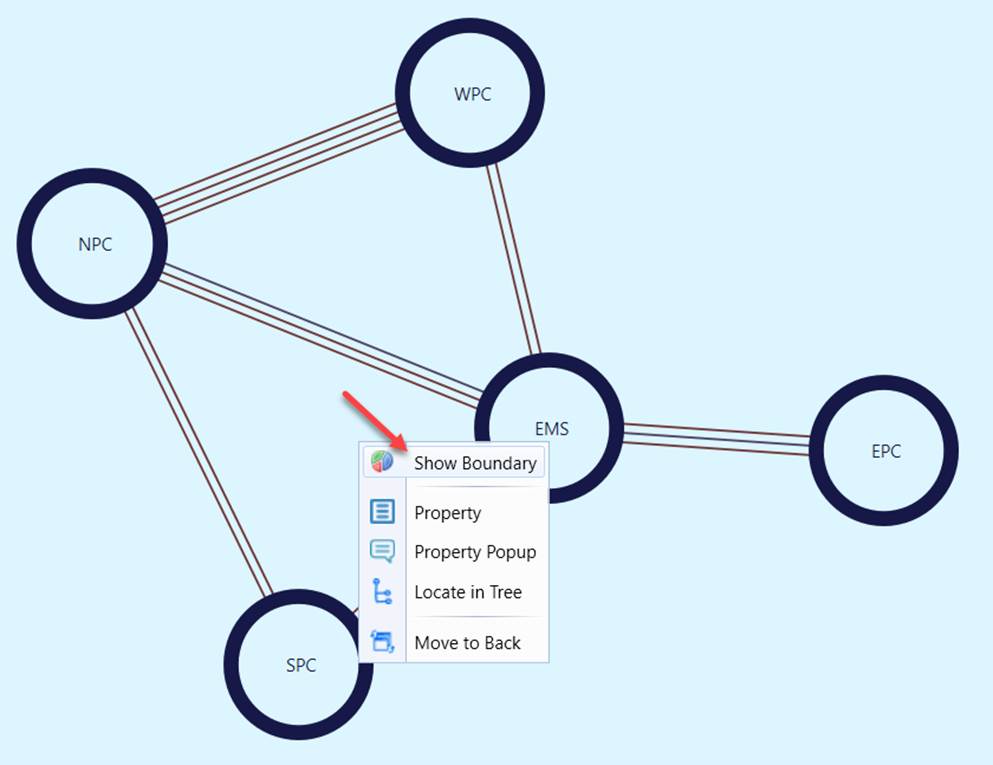
- Context menu or Double-mouse-click on the region name in another Boundary Diagram
Adjust Layout in a Boundary Diagram
In some reality-based large models, the boundary diagram generated could be quite complicated, as shown below. The Tool provides users a capability to adjust the auto-generated boundary diagram for better visibility.
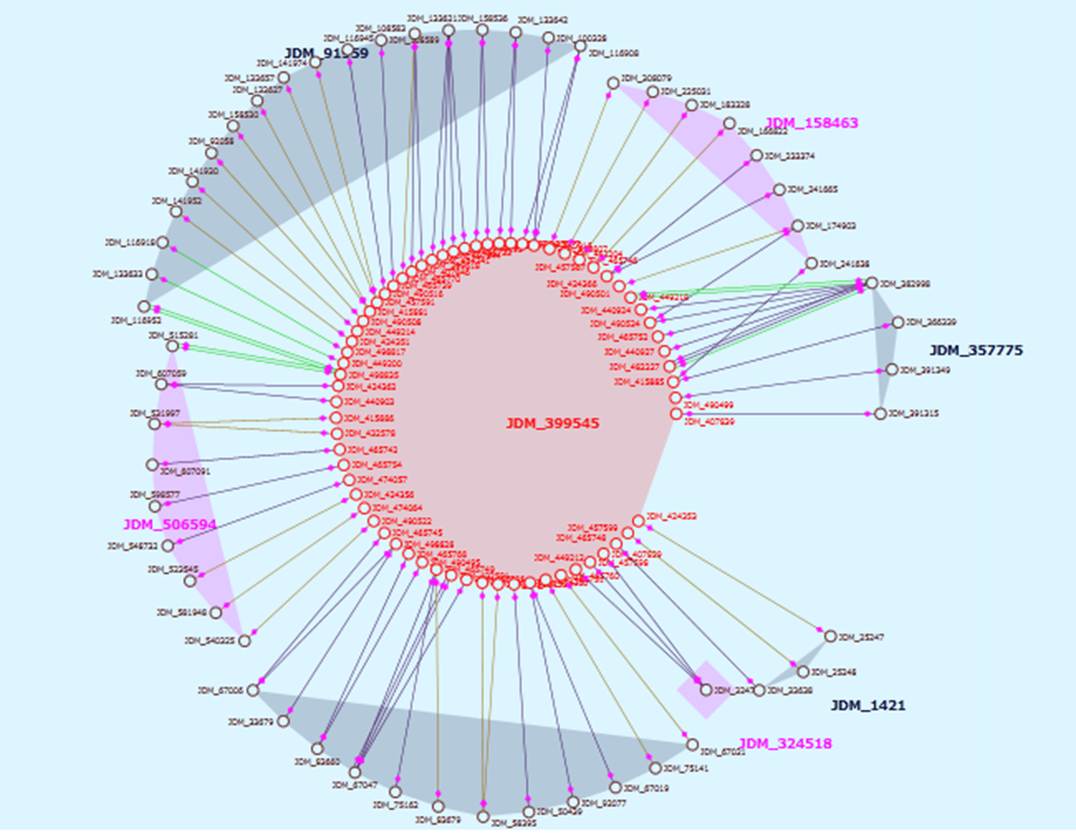
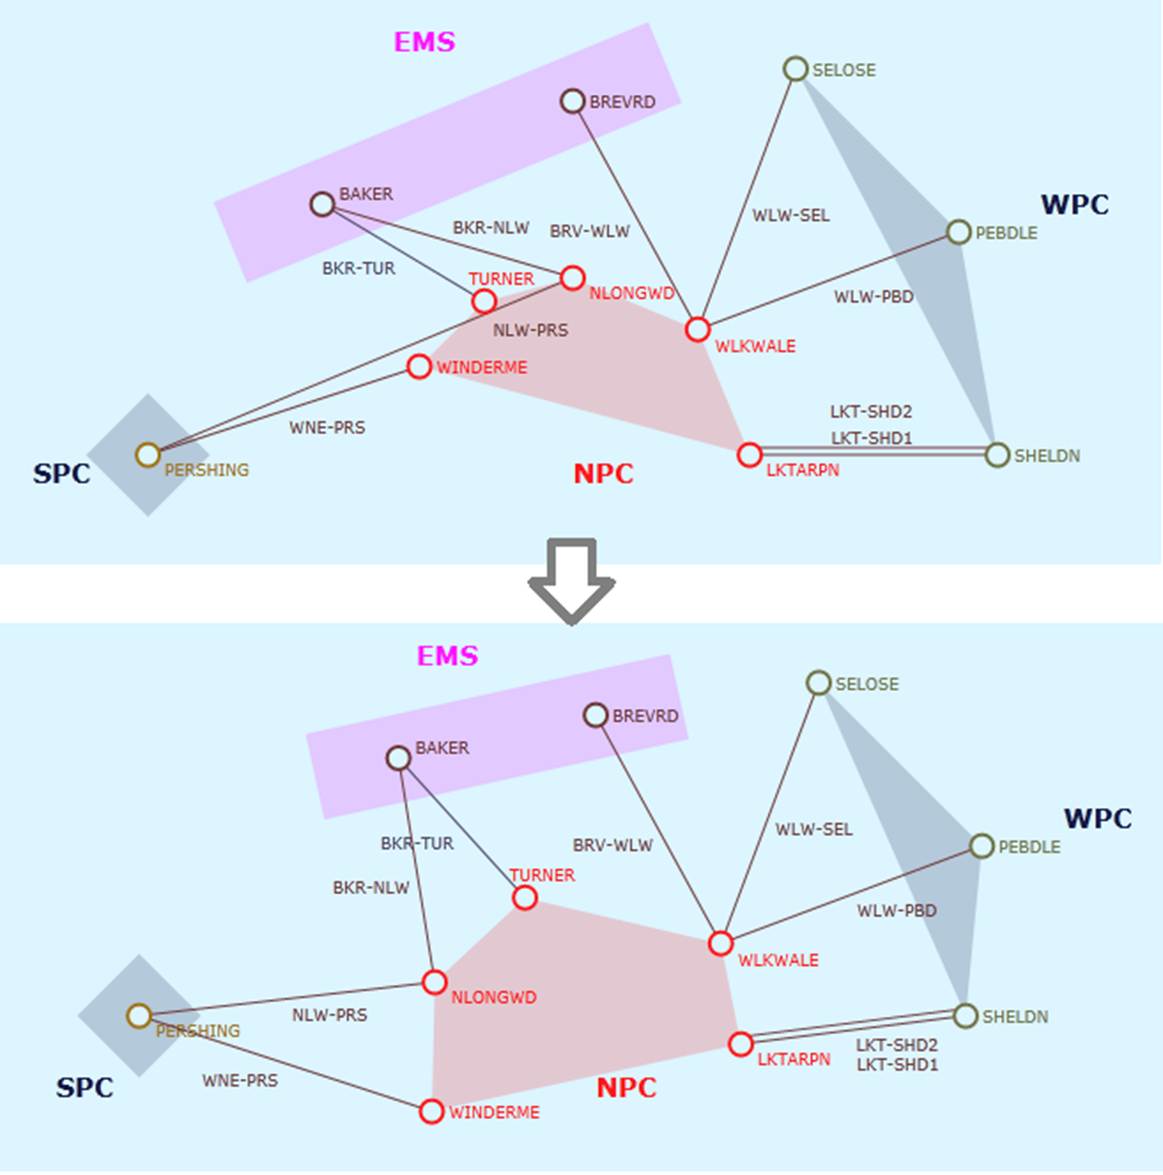
Basically, users can drag and drop the stations to adjust the layout for clarity and less line crossings. Region shapes automatically adapt to their stations’ positions.
Display Options
Standard display options are available for stations, lines and power flow etc.
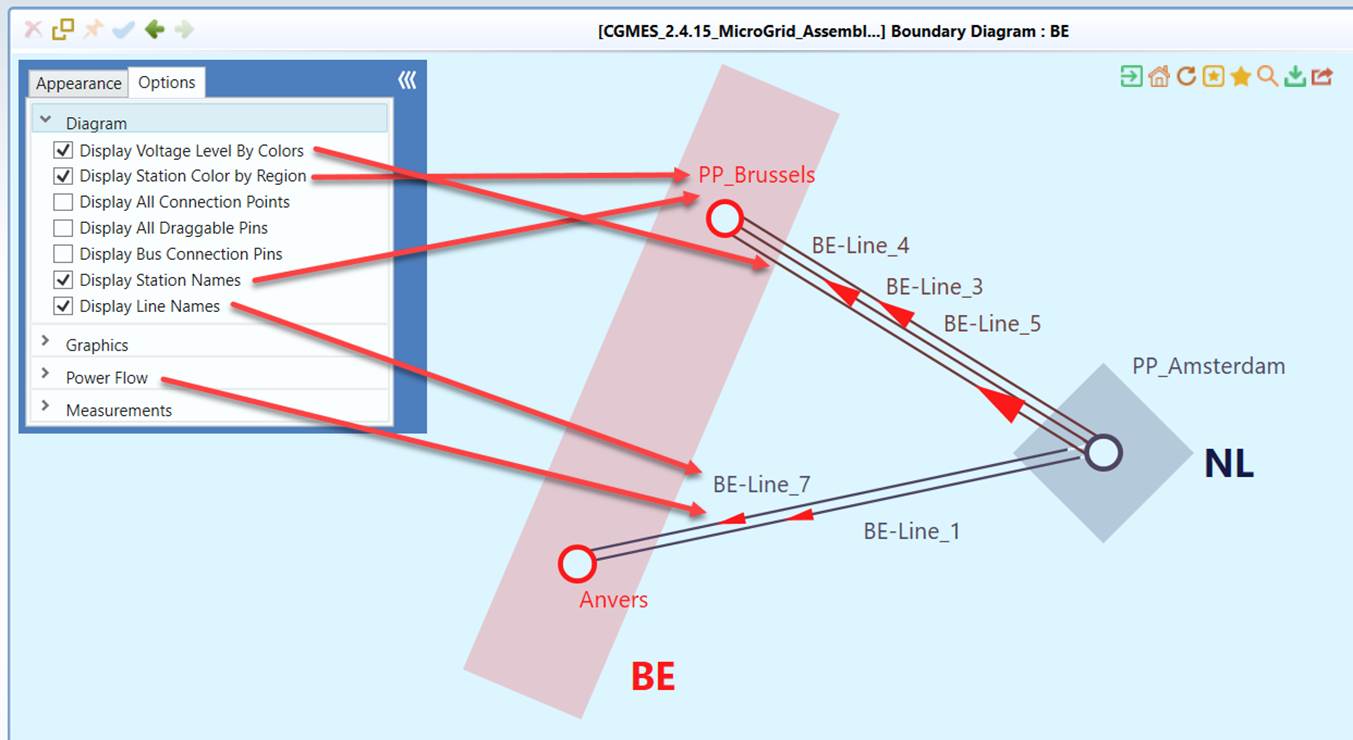
Diagram Saving & Export
Users can save the auto-generated Boundary Diagram and export it for future use or sharing with other applications.