Power Flow Visualization
Traditionally, power flow solutions were presented as numerical data in tabular forms. Experience has shown that human can recognize and analyze visual information much more quickly than they can do with numerical information. The Rich Data Visualization features are designed to present raw data as easy-to-understand visual elements to promote the communication and interpretation, enhance the recognition of patterns, and enable users to perceptually monitor a large number of events. Power Flow Visualization is a feature derived from Rich Data Visualization.
Hands-On (Required)
Take Hands-on Lab 7 from Power Flow Tutorial.
About Power Flow Visualization
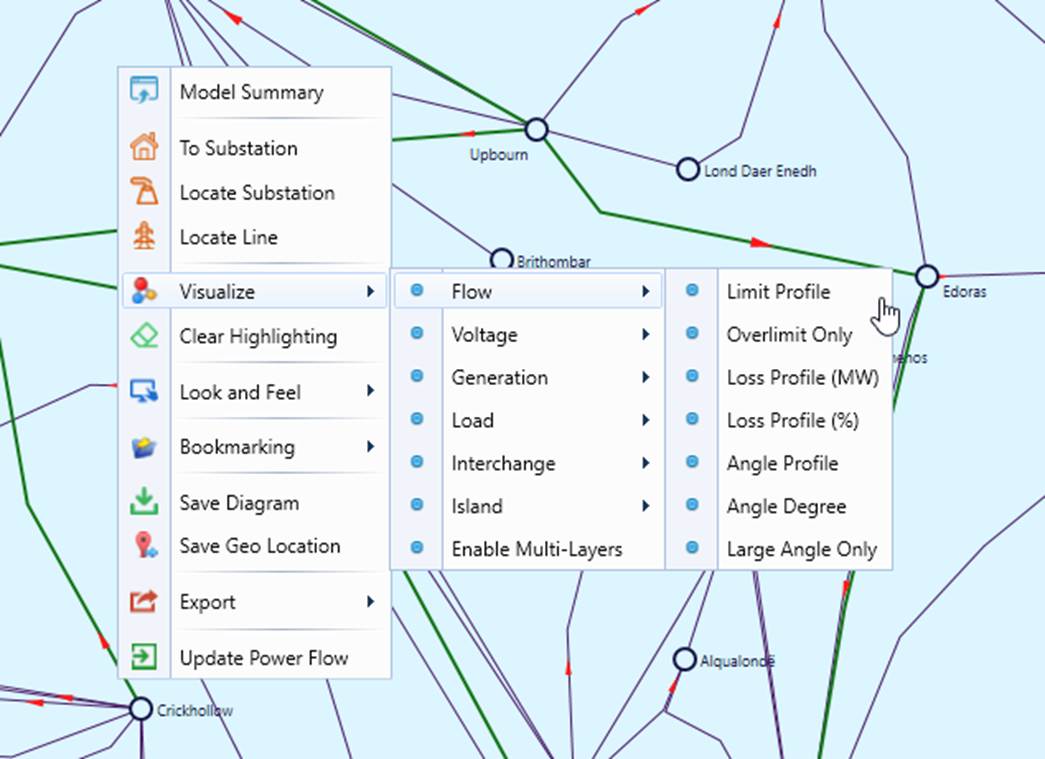
The power flow visualization feature adds result labels, colored overlay, heat-map, gauge chart, animation, etc., on the top of auto-generated various types of diagrams. Most of the visualizations are designed for line-substation diagrams, such as Geographical Diagram, Neighborhood Diagrams, etc. They can be enabled via a context menu invoked by clicking a blank spot, as illustrated below,
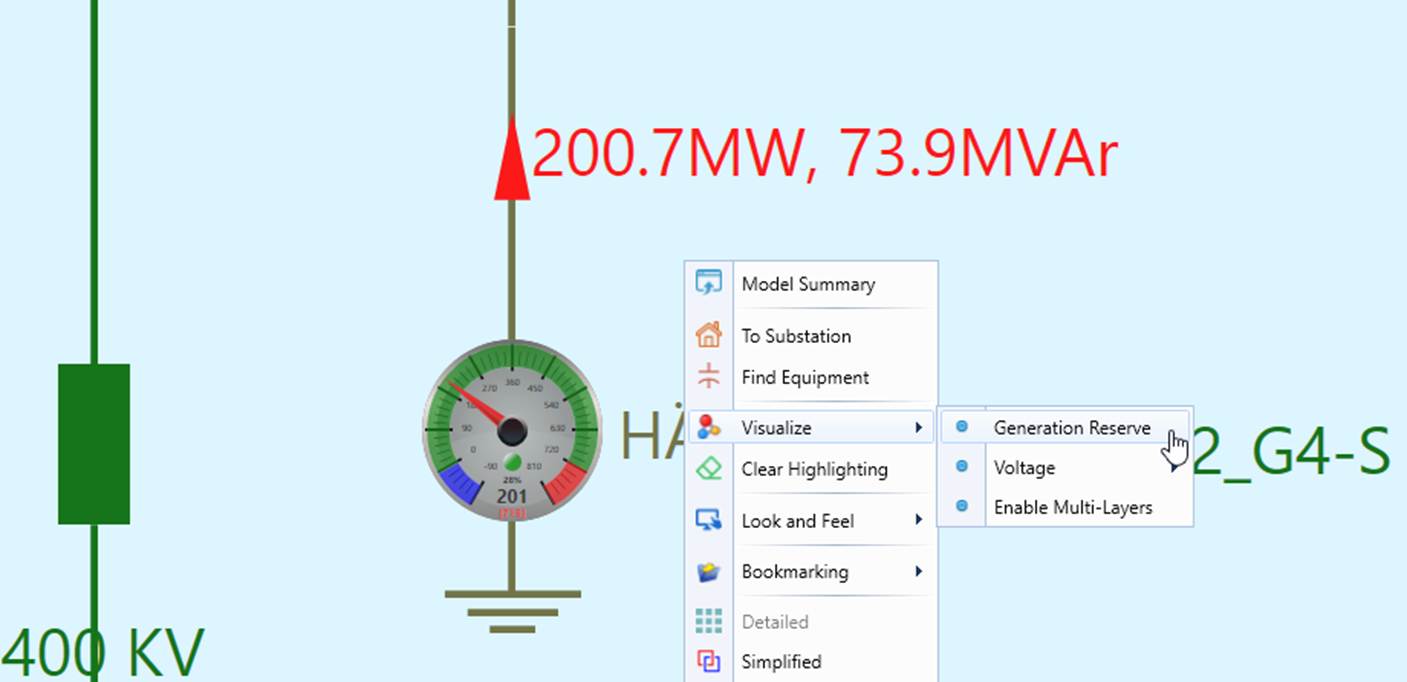
Visualization layers can also be enabled for Substation Diagram in a similar way, as illustrated below.
For more details about the supported visualizations, please check Usage of Rich Data Visualization.
Visualization Configuration
Some of the designed visualizations are driven by a collection of configuration meta-data. Users can modify such configurations to achieve the desired visualization effect. For more details about the supported configurations, please check Customization of Rich Data Visualization.