Rich Data Visualization for Grid Operation
Traditionally, the analytical results, such as those obtained from state estimation and power flow study, were displayed as numerical data in tabular forms. Experience has shown that human can recognize and analyze visual information much more quickly than they can do with numerical information. The rich data visualization features are designed to present raw data as easy-to-understand visual elements to promote the communication and interpretation, enhance the recognition of patterns, and enable users to perceptually monitor a large number of events.
One of the supported use cases of the Tool involves helping power grid operators perform mission-critical tasks and enhancing situational awareness in a control center environment. Integrated with the existing utility information systems based on industry standards, the Tool is capable of displaying the grid operation information, including field measurements, analytical results, alarms, and identified outages on the dynamically generated schematic and geographical diagrams at a real-time speed. A variety of cutting-edge rich data visualization techniques are applied to assist system operators and supporting engineers to perceptually monitor the grid operation, identify harmful threats to grid, and enable effective actions.
The Tool supports two kinds of grid operation visualization:
- Offline Study Case Visualization: Users use the Tool to visualize a snapshot of a study case either generated by power flow study or imported from a 3rd-party tool, such as other planning tools or EMS. The study case could be analytical result of power flow study or real-time state estimation.
- Real-time Operating Condition Visualization: The Tool is integrated with an EMS based on CIM. The real-time information, including field measurements and state estimation results are periodically retrieved from the EMS.
The rest of this section briefly describes how some of the state-of-the-art visualization techniques are applied to help users cognitively read the system operating conditions.
Measured vs. Analytical
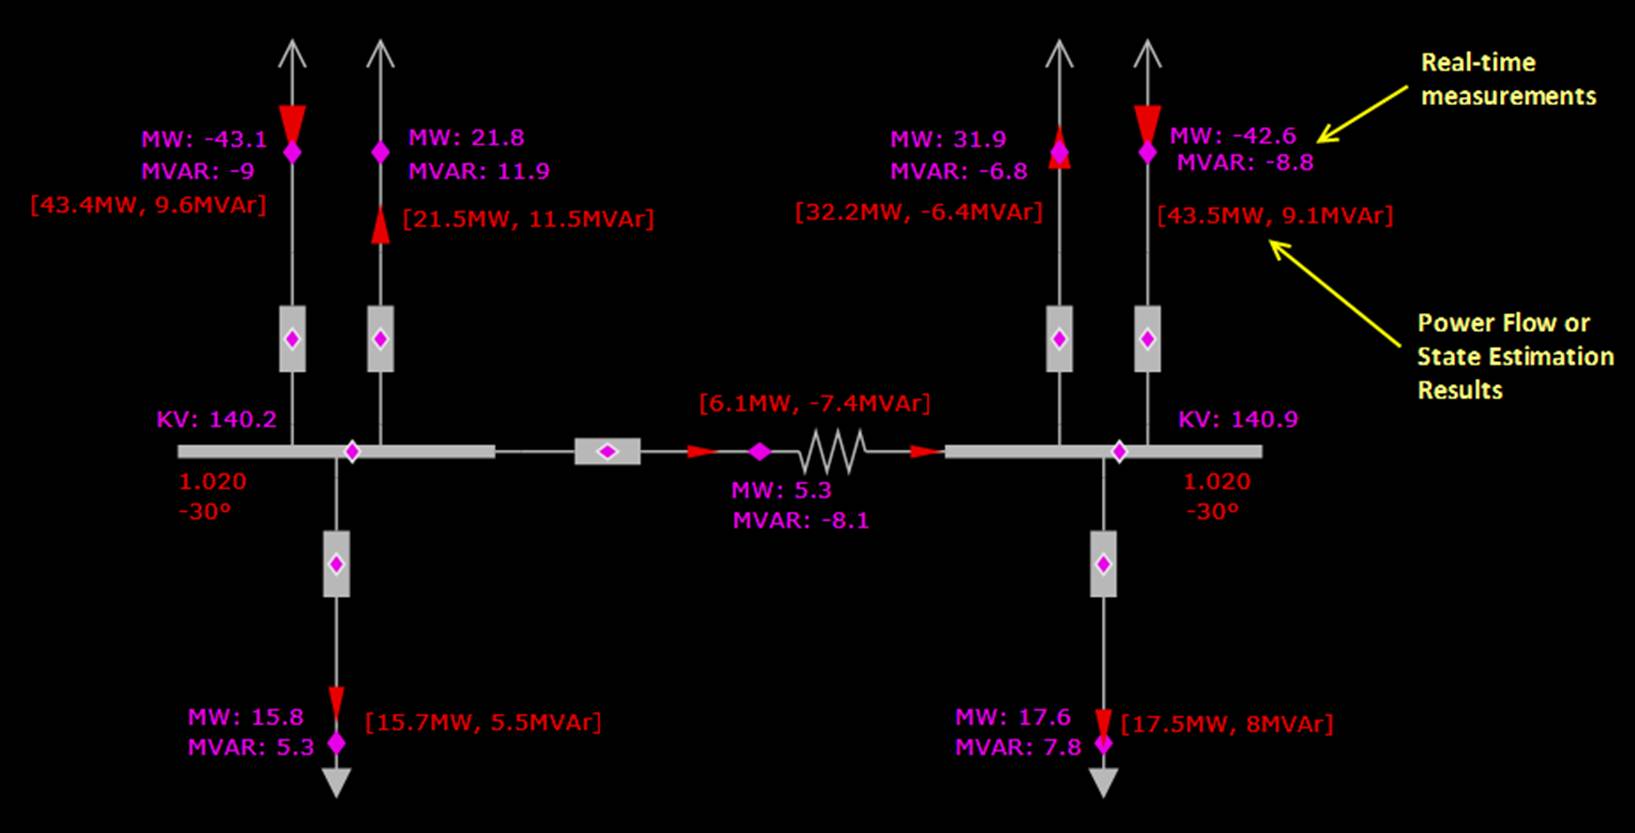
At its simplest form, the Tool is capable of displaying the operational information, measured or analyzed, on top its various auto-generated one-line diagrams. Traditionally, the real-time measurements and analytical results are displayed separately in human-designed diagrams. Operators have to switch between different diagrams to understand the data and make comparison. The Tool combines the operational information from different sources and presents the combined operational information in a single diagram. It uses various graphical presentations, such as color conventions, symbol variations, animations, etc. to represent the data sources and highlight the alarming operating conditions. The following sample diagram presents analytical results along with the real-time measurements.
Generation Reserve
Simply creating visualizations to display data provides limited assistance, especially in a power grid control center where system operators must monitor and analyze large amounts of information and respond to problems before disruptions can arise. To help users understand the operational data, the Tool leverages various state-of-the-art rich data visualization techniques designed to present raw data as easy-to-understand visual elements.
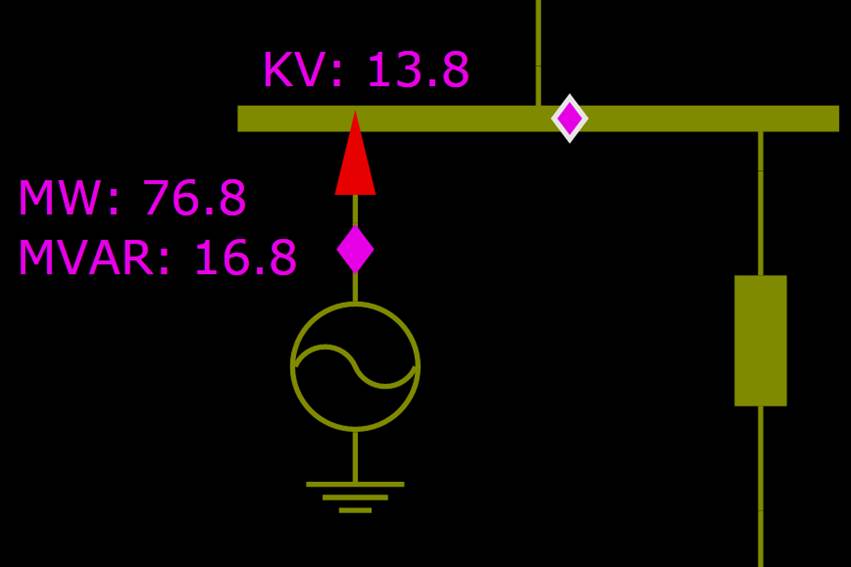
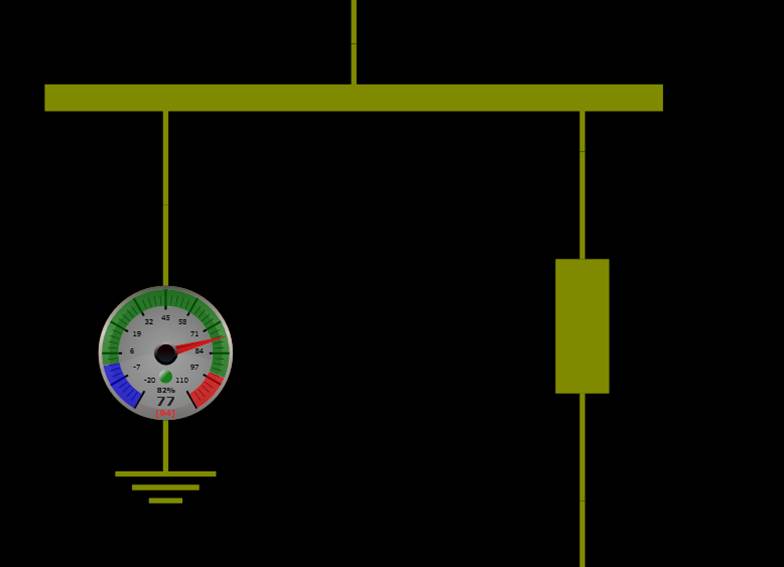
The following diagrams illustrate how rich data visualization can help operators perceptually monitor the MW output from a generating unit. The left diagram simply presents the real-time measurements of a generating unit, while the right diagram presents the same information using a numerically labeled speed meter, which displays not only the current MW output of a generating unit, but also its generation reserve. The maximum and minimum operating limits are marked as red and blue respectively.
Phase Angle
While graphical presentations, such as colors, shapes, and animations, help grid operators perceptually monitor grid operating conditions, more accurate numeric data are needed to support decision making in many cases. On the other hand, the numeric data presented in this traditional format are hard to read, track, and identify correlation and relationships between them.
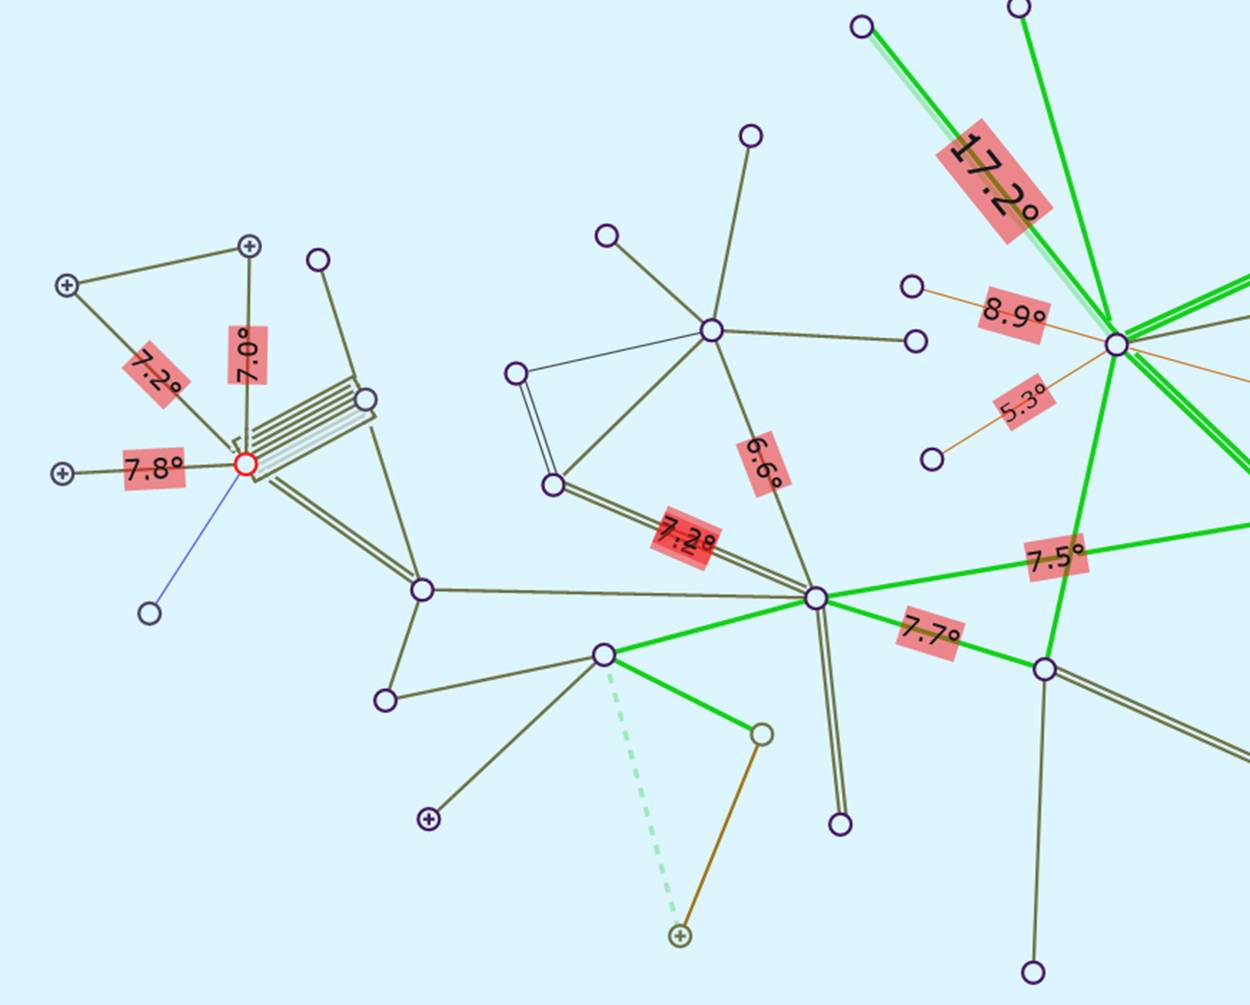
The Tool presents numeric data in a way that fosters understanding and reduces cognitive demands. The applied text visualization is an effective way to facilitate decoding of the quantitative information. It uses visual representation to present texts, thus adding another dimension for presentation of numeric data. For example, the phase angle diagram, as illustrated below, presents the numeric data in a shape with its size reflecting the value of the represented numeric data. It shifts users focus to those large phase angle differences that requiresspecial attention, since breakers may not operate normally if the phase angle is too large.
Energy Generation and Consumption
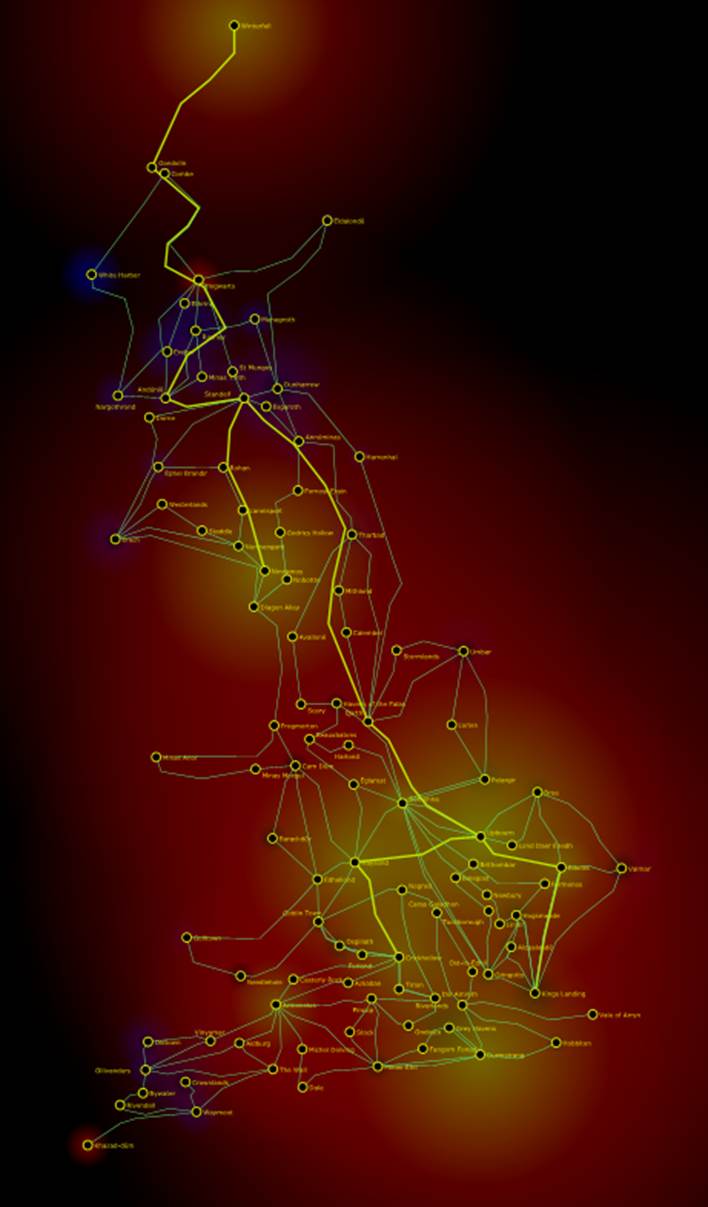
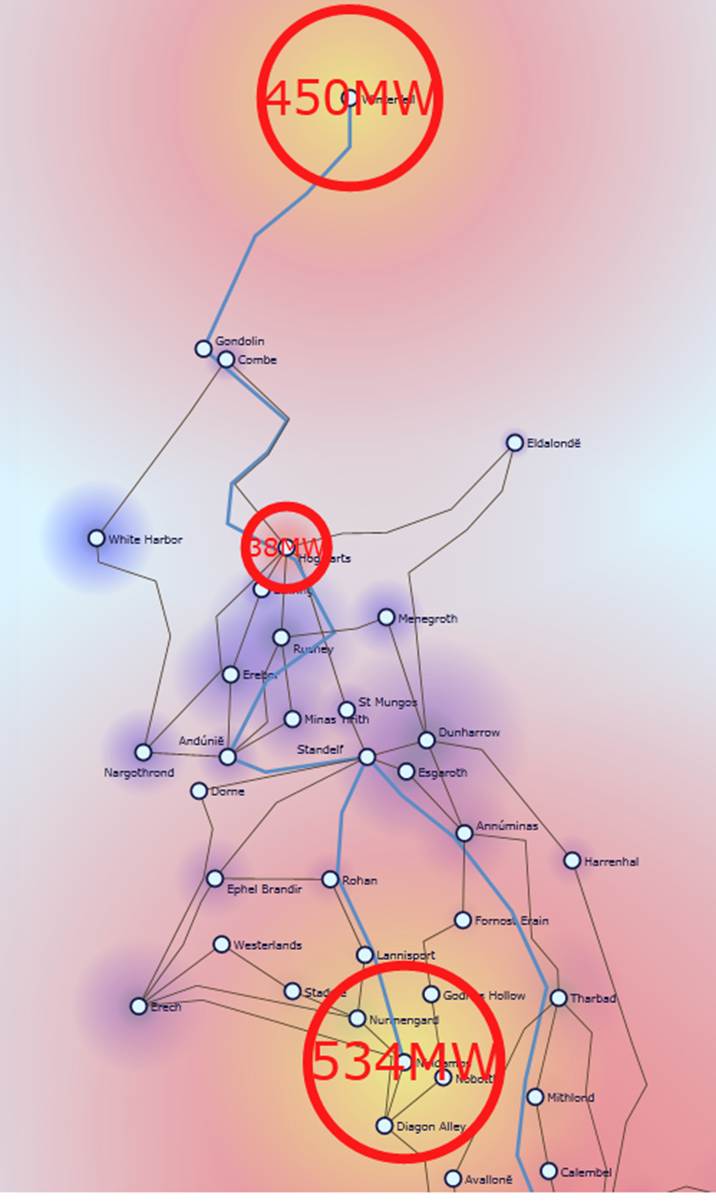
A heat map is a raster map showing the density or magnitude of point related information. It is a two-dimensional representation of data in which values are represented by colors and areas of influence. A heat map can provide an immediate visual summary of information. It also helps users to extract the patterns from large amount of data. There are many ways to display heat maps, but they all share one thing in common -- they use colors and areas of influence to communicate relationships between data values that would be, otherwise, much harder to understand.
The heat map in the following figure presents a visual summary of energy generation and consumption in a small test grid. The red color represents energy generation and the blue color represents the energy consumption. The energy generation/consumption heat map not only describes where the electric energy is generated and consumed, but also indicates the magnitude of the energy generation and consumption. Power plants that generate large amount of energy result in “solar core” within large “hot” areas, while the main demand centers produce the black core in blue consumption areas. The energy generation/consumption heat map enables operators to instantly understand the energy distribution in a power grid.
Operational Constraint Violation
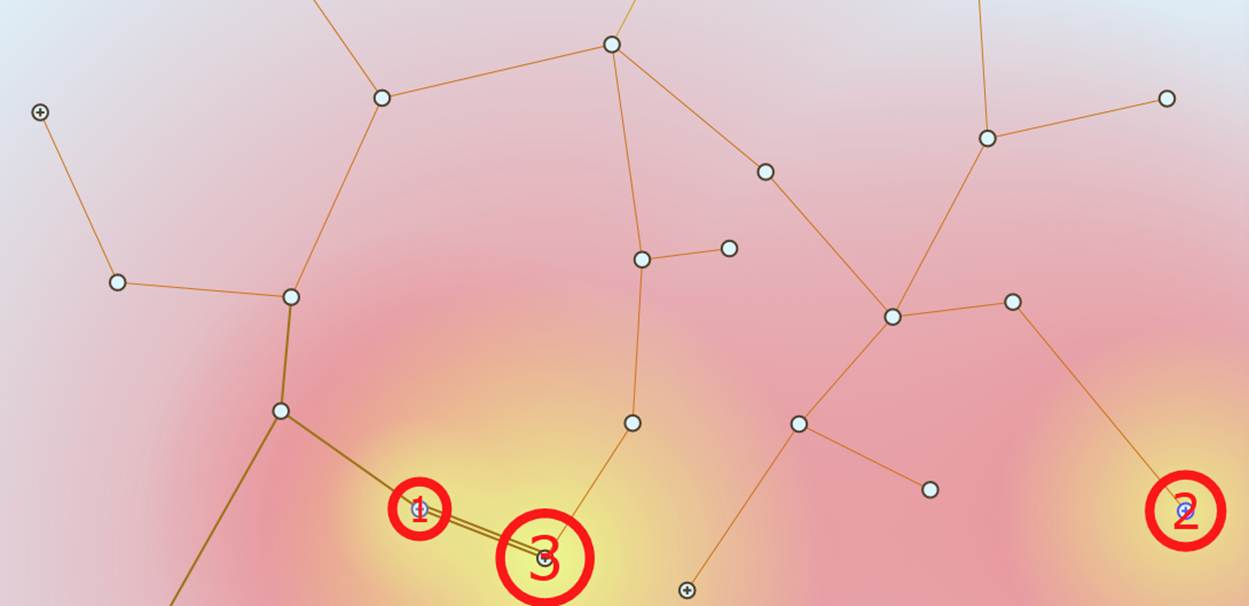
Similarly, heat map based visualization technique can also be applied to monitor other key operational quantities. The following diagram highlights two Substations where voltage limit violations occur in a Neighborhood Diagram. Additionally, it clearly indicates how severe the over-limiting situations are for each substation.
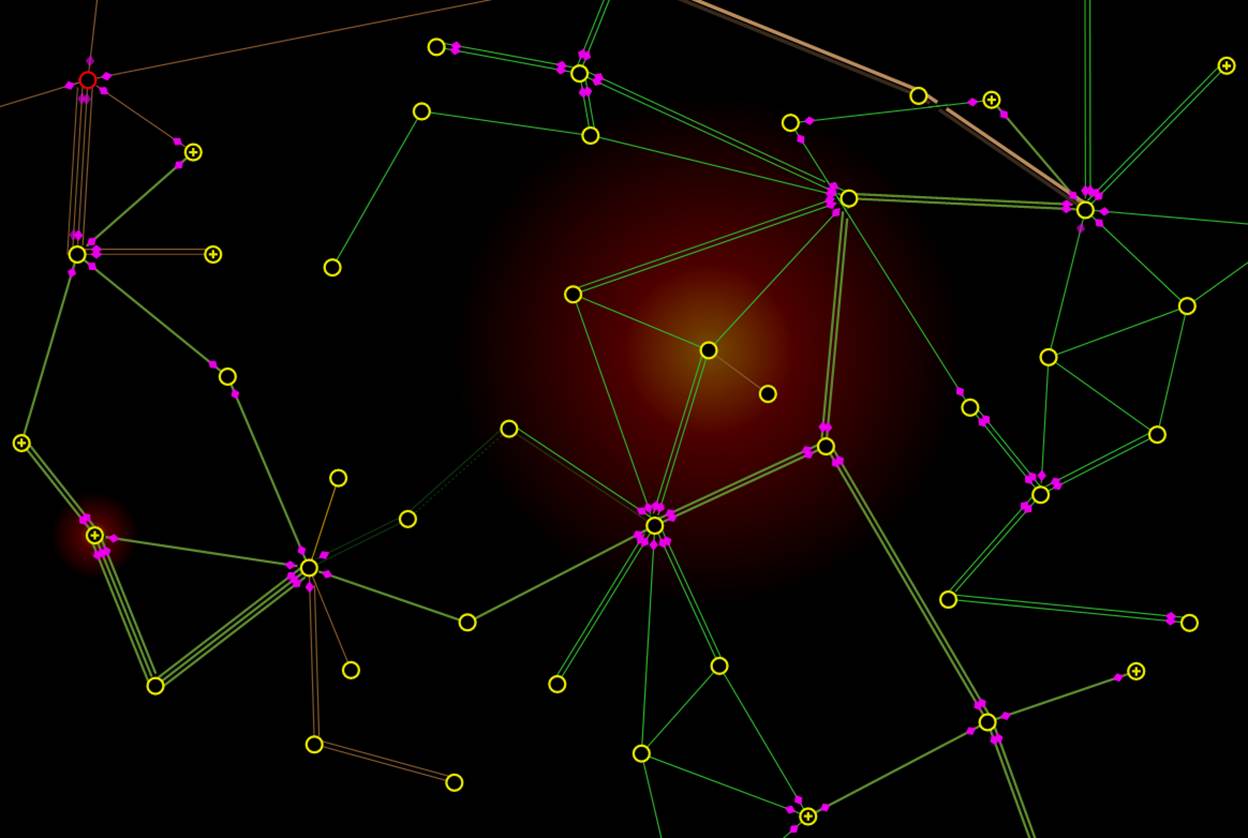
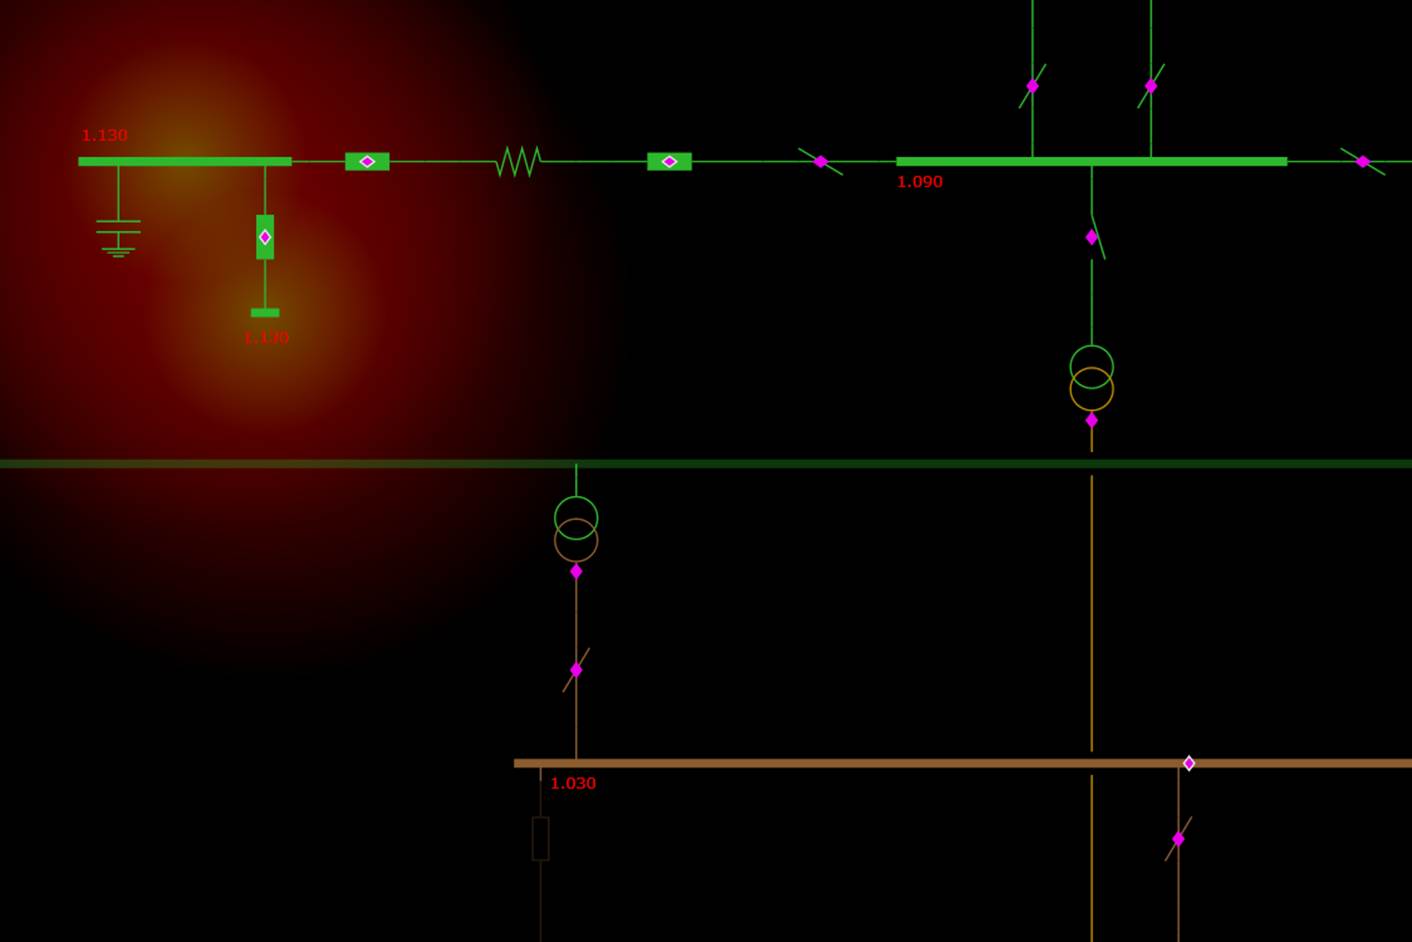
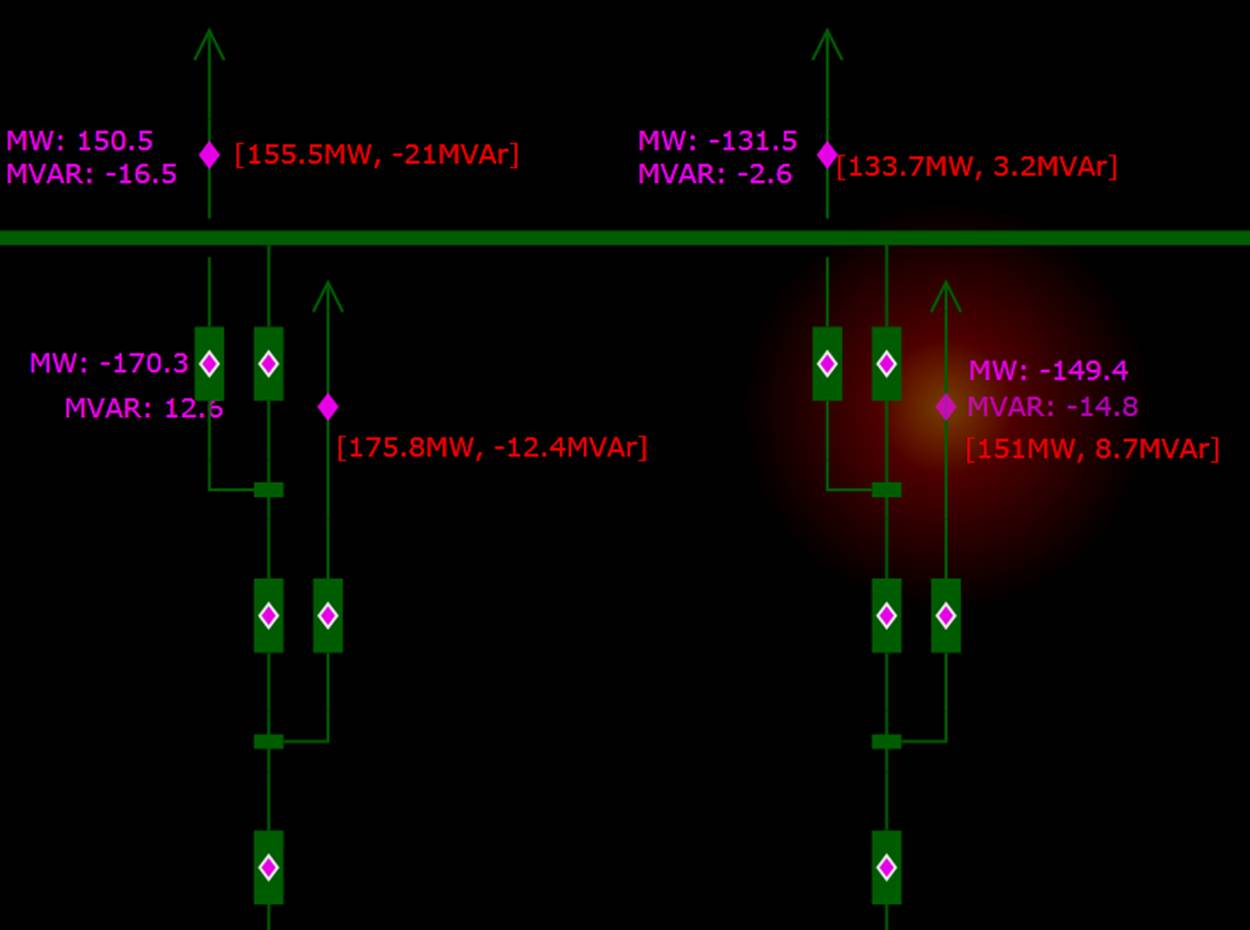
By navigating to the corresponding Substation Diagram, users can quickly identify what causes violation of high-voltage limit from the heat map inside the Substation: over-compensation by a ShuntCompensator. The over-limiting condition then can be easily mitigated by opening the Breaker connecting to the ShuntCompensator.
Bad Measurements
Bad measurement identification is another example of using heat map for perceptive grid operation monitoring. Bad measurements can be identified by comparing the measured quantities with the state estimation results. The Tool can help users quickly identify where the bad measurements are located and how bad the measurements are.
Voltage and Flow Profiling
For secure operation of power grids, system operators in a control center must closely monitor various operations constraints to ensure that the grid is at a “healthy” state. The major blackouts are often triggered by violations of the security constraints. Traditionally, the real-time security constraints are displayed using numerical information in tabular displays, which are very difficult to interpret.
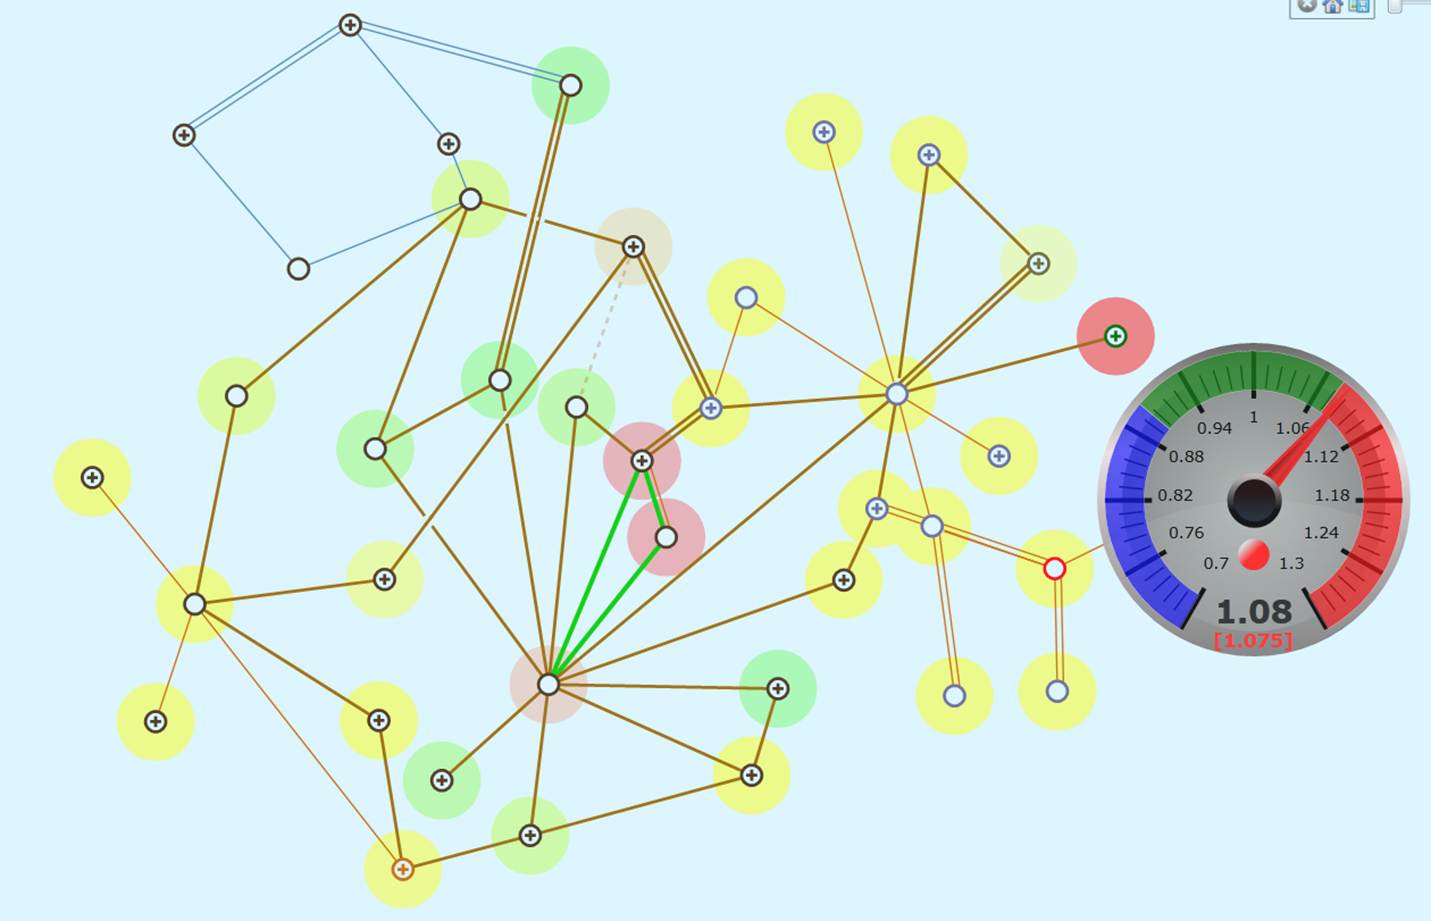
A fuzzy logic based visualization technique was applied to provide users an overall picture of the system health from various perspectives: voltage, power flow, frequency, etc. Basically colors are used to communicate the ‘meaning’. This is based on the fact that humans are much more cognitively sensitive to color than numeric. More specifically, three colors are used to indicate the health condition of a measured/analyzed quantitative: green (healthy), yellow (warning), and red (alarming), each representing a defined quantitative range using a fuzzy model. Then we mix each color ingredient using fuzzy logic operations based on the actual measured/analyzed value. With the blended color, users can profile the related portion of the diagram, providing user an overall picture of the grid health.
The voltage profile shown in the following sample illustrates such a use case. System voltage profile is a key quantitative indicator monitored by grid operators. Excessively high voltage could cause equipment to malfunction, while the voltage below the low limit could result in the system to collapse. The fuzzy color based voltage profile, as illustrated below, can help operators immediately identify the potential voltage problems and timely enable the preventive or remedial actions.
The power flow congestion profile, shown in the following figure, is another example demonstrating how fuzzy coloring visualization can be applied to help the grid operators monitor the system health from the energy transaction perspective. A transmission line colored as “alarming red” means that the flowing current is close to its capacity or rated current limit. The redness indicates how serious the represented condition is. It prompts the grid operators to change the operation configurations to relive the congestion in the identified transmission lines.
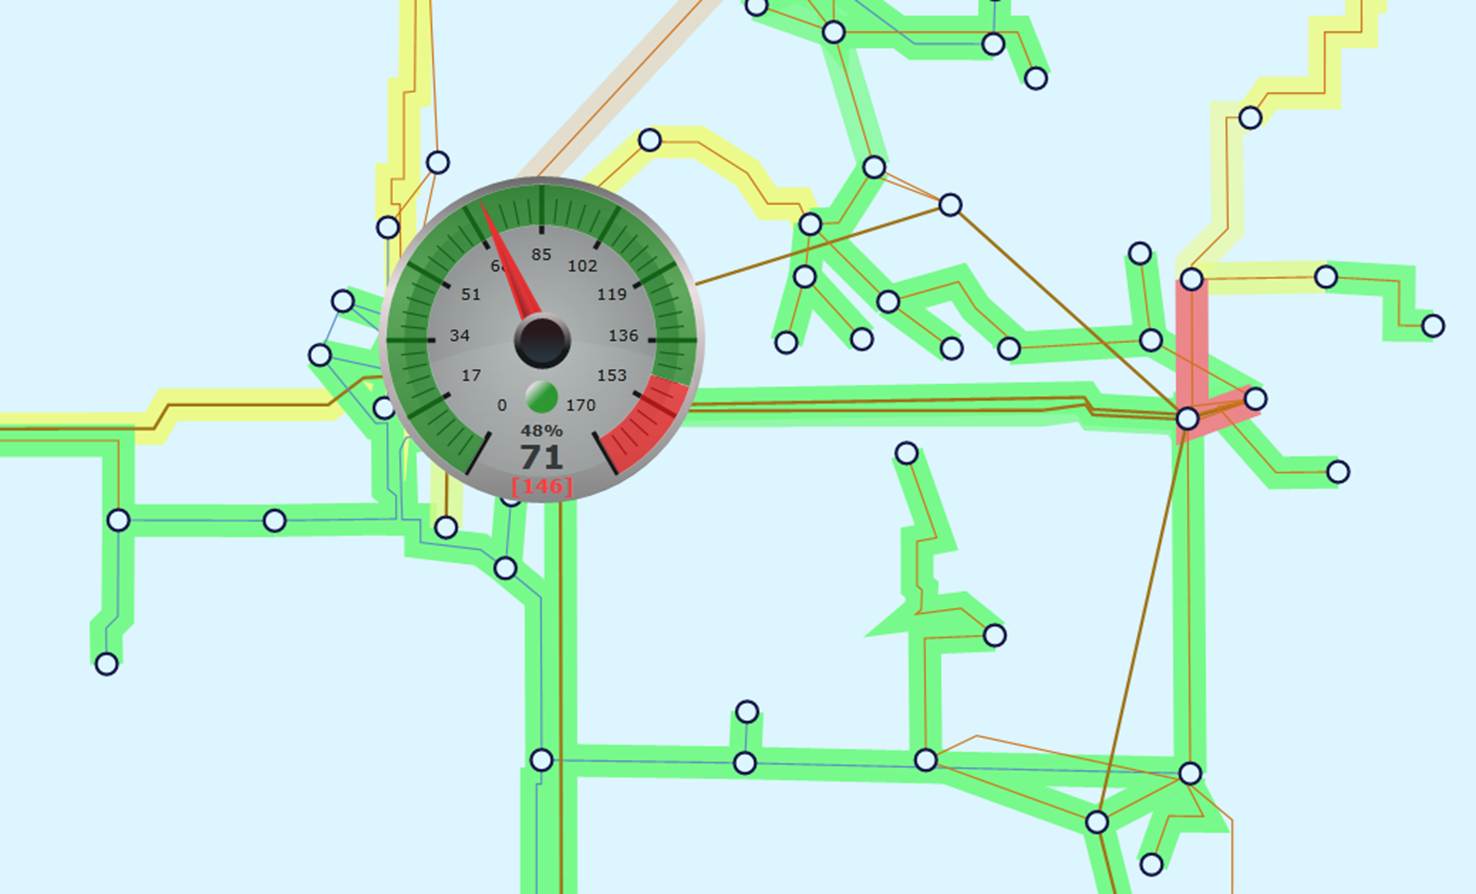
Another technique used is on-demand graphical presentation of quantitative information. Experiments conducted have concluded that presenting too much numerical information in a visual display could result in “information overload” and distraction. The idea is to use the conceptual visualization techniques, such as fuzzy color profiling, to provide users a general feeling, but enable users to call a diagram display on demand to view more accurate information. For example, by moving mouse cursor over a colored graphical symbol that represents as a selected transmission line, operators can find out how closely the voltage/power flow is approaching to its rated limit through a numerically labeled speed meter, as illustrated in the above diagrams.
Regional Energy Transaction
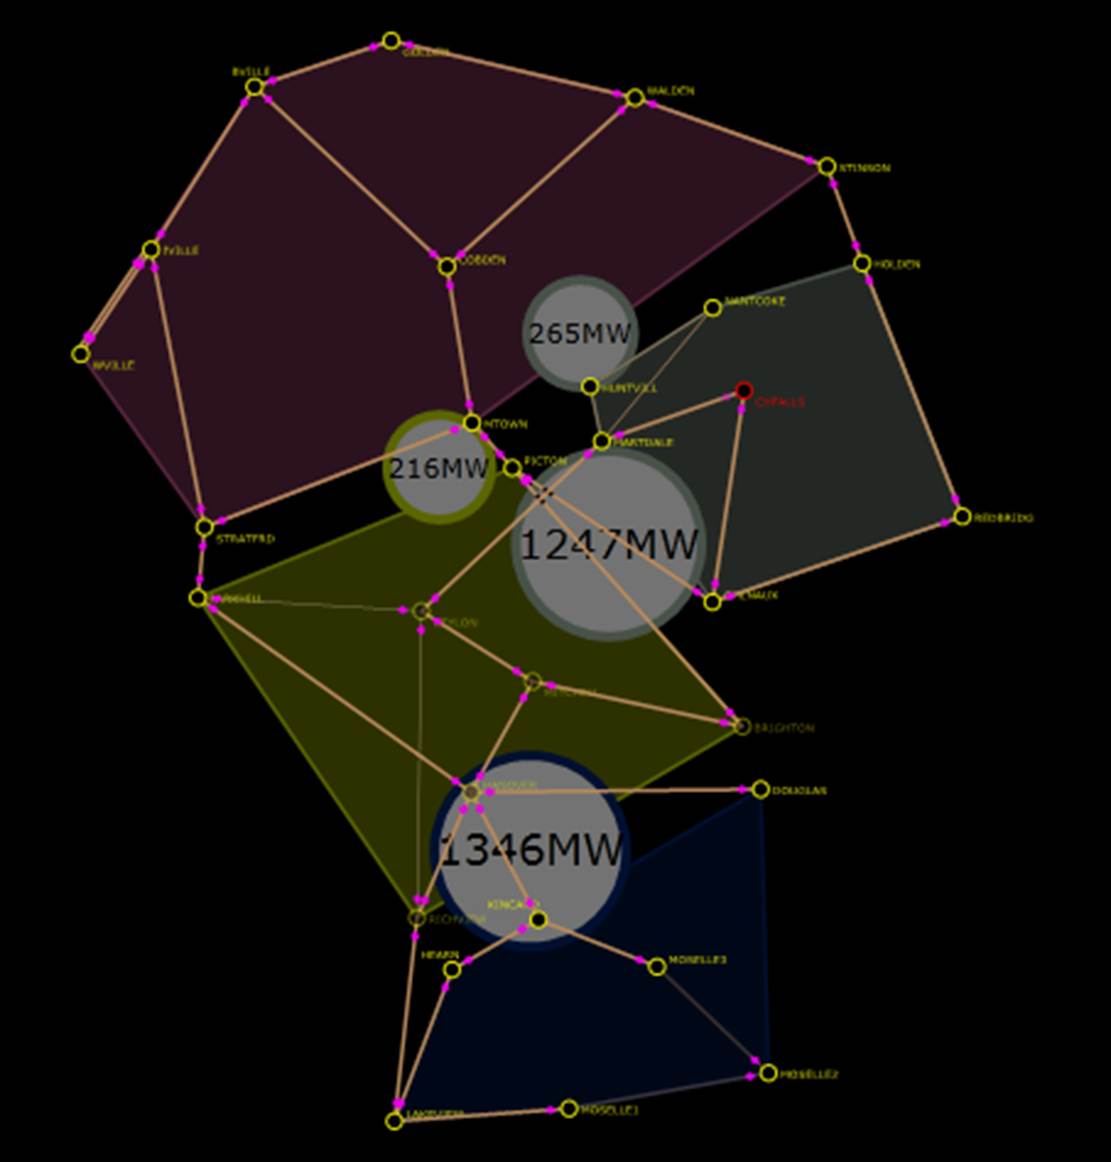
Energy transaction among regions is one of the key performance indexes monitored by the system operators. The Tool is capable auto-generates the regional schematic and geographical diagrams and then uses the animation to illustrate the inter-exchanges among regions. The following diagram illustrates such an example. The circles that represent the exchanged MW move from one region to another, providing operators an intuitive summary of current inter-exchange among four operating areas.
To learn more details about using this feature, please check Usage and Customization of Rich Data Visualization
Note
While this feature is not part of the standard release, some of the visualizations were migrated to the baseline of the Tool.