Diagram Adjustment
The Tool auto-generates various diagrams, enabling users to visualize the network topology at different levels and in various details. The diagram layout, based on some artificial intelligence (AI) algorithms and graph theories (http://powerinfo.us/publications/Visualization.pdf), is not perfect. The Tool provides various mechanisms for users to adjust the auto-generate diagrams for clarity and better look-and-feel.
Adjusting Diagram through Drag-and-Drop
In the simplest form, users can drag-and-drop graphical components to adjust the layout of the diagram. The 1st diagram below shows a Neighborhood Diagram auto generated, while the 2nd diagram shows the same diagram, but manually adjusted.
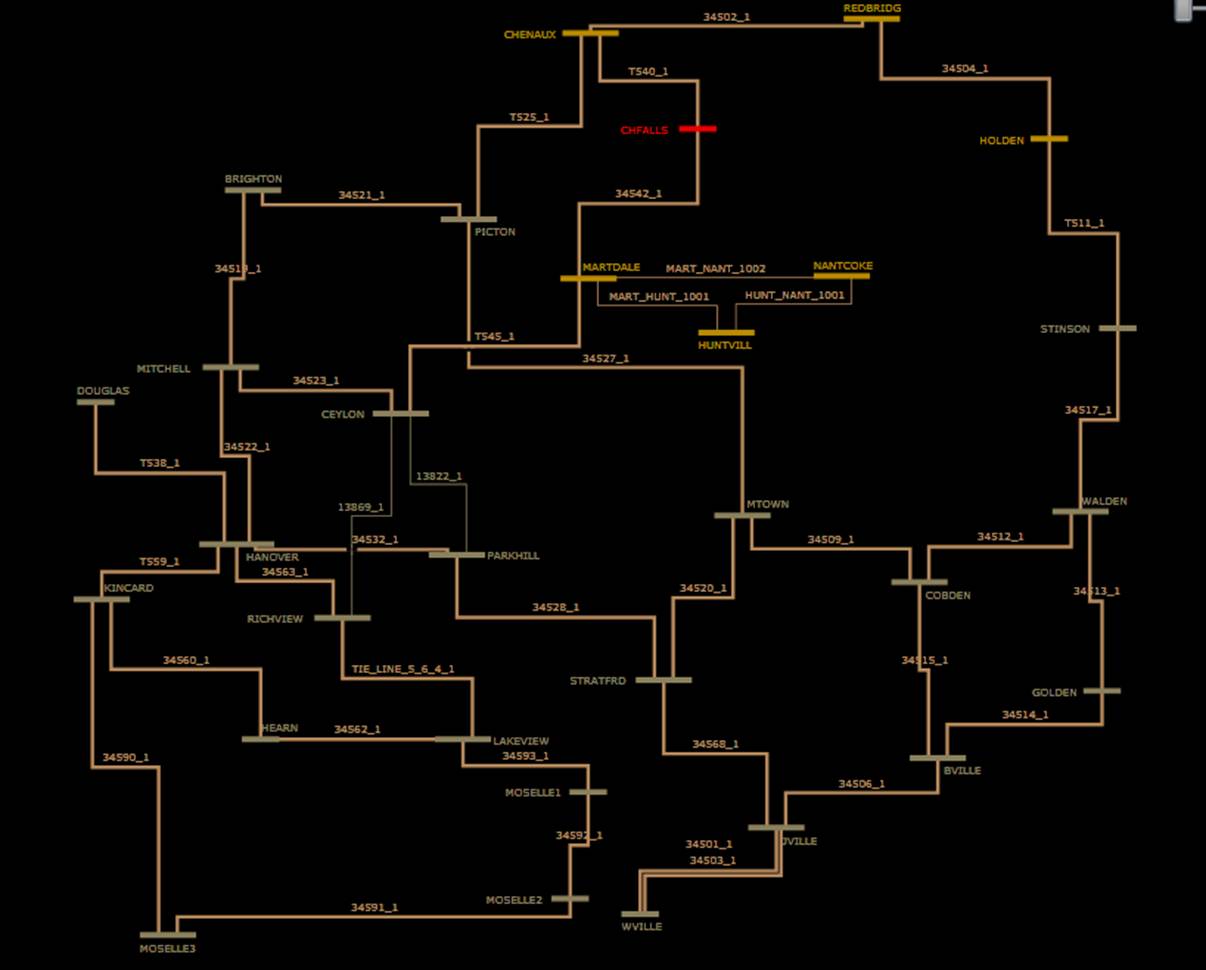
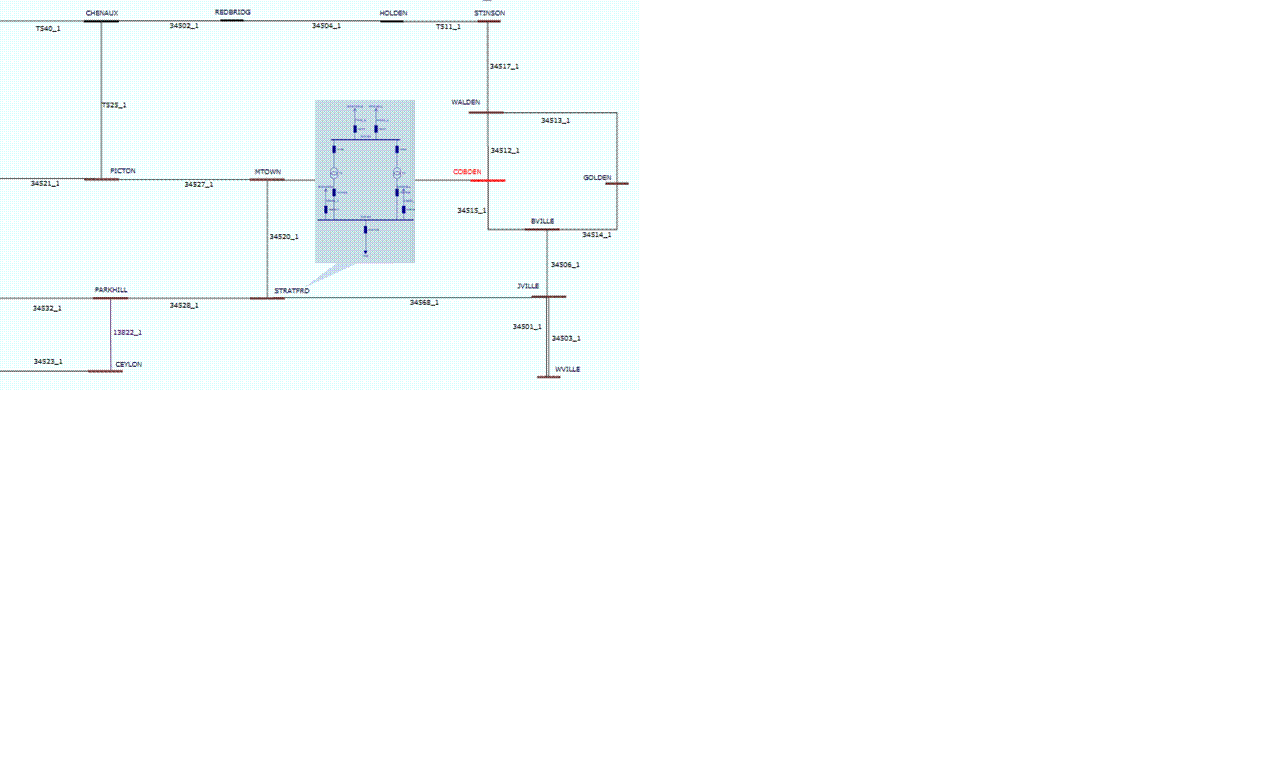
.
Adjusting Diagram through Grouping
Users can move a block of interconnected components through grouping, as illustrated below
- Right-mouse click a blank spot as the starting point, a rectangular tracer will appear. Keep the right-mouse button down and drag the mouse toward the direction to include the network components intended to be grouped. If the center of the none-bus network component is inside of the rectangular tracer, it will be included in the group. For buses, both starting and ending points of the bus must be inside the rectangular tracer to be included in the group.
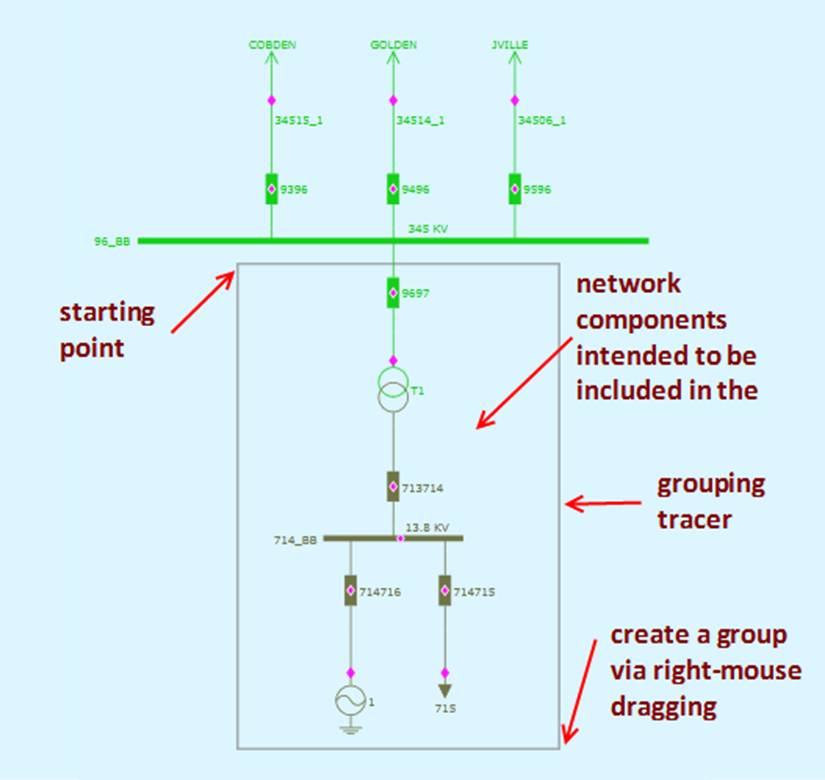
- Once all of the intended network components are included in the group (i.e. inside the rectangular tracer), release the right mouse button (i.e. right-mouse button up). The rectangular tracer will disappear, and the selected network components will become half-transparent, as shown below
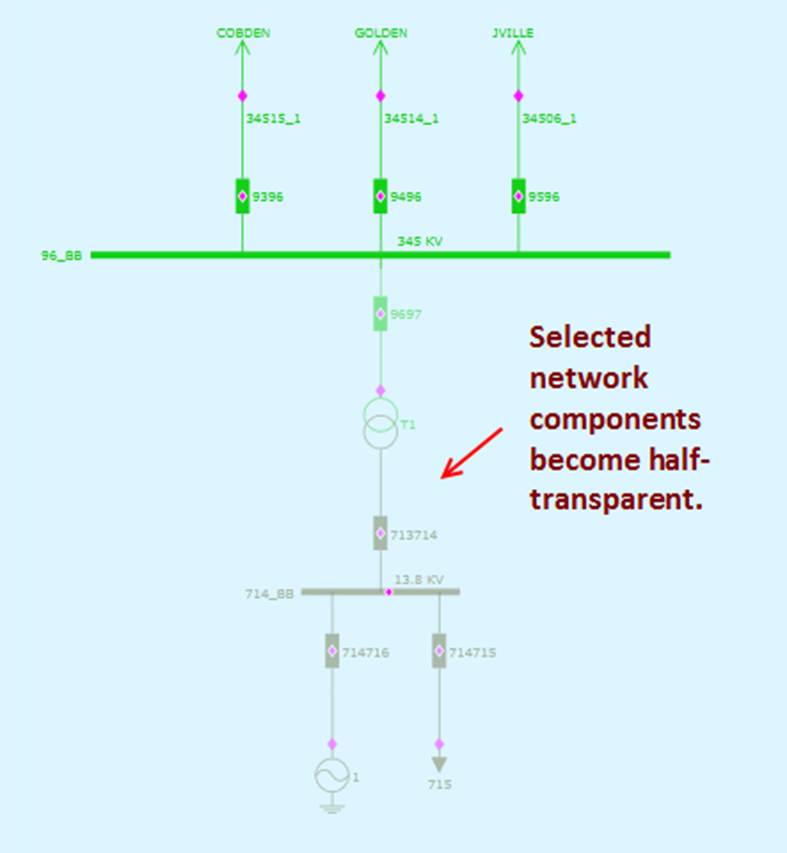
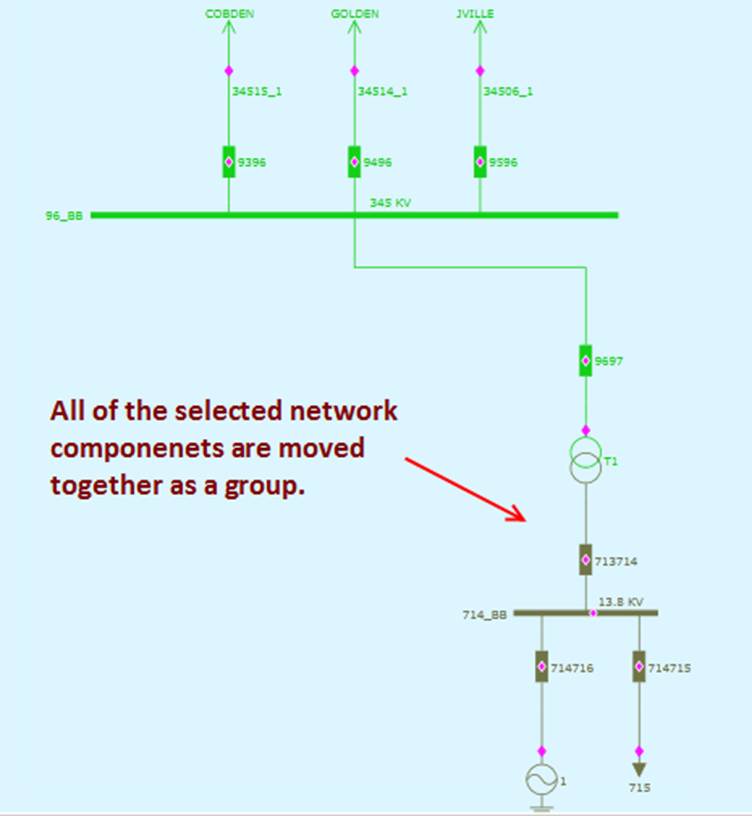
- Users can repeat step 1 – 2 to create other groups. Once all of the network components are included in the created groups, left-mouse drag-and-drop any blank spot in the diagram. All of the selected network components will be moved together through drag and drop, as shown below.
Adjusting Diagram through Rotation
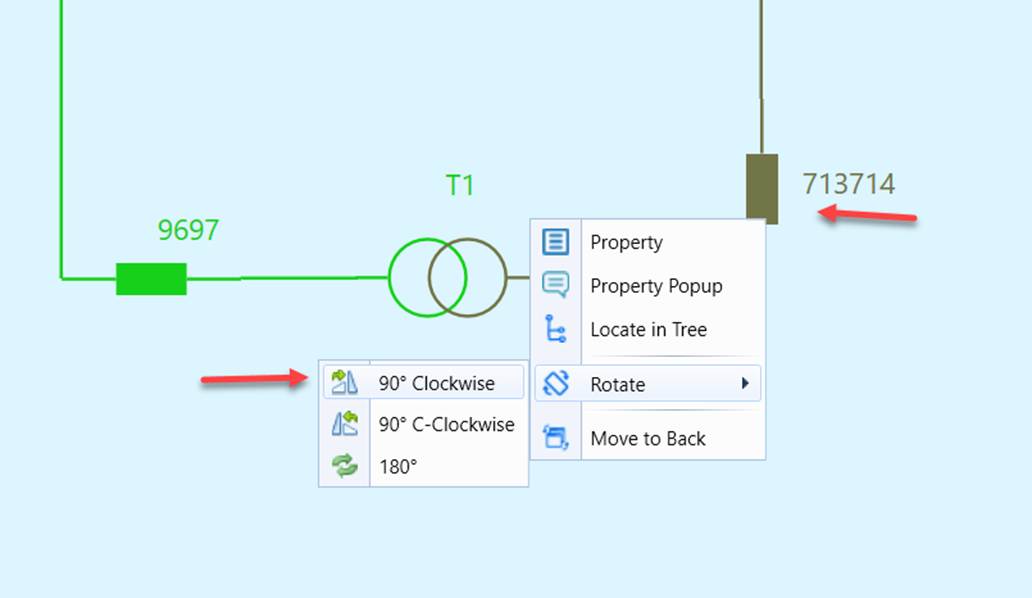
Any of the selected network components, except buses, can be rotated to change the orientation. This can be accomplished via the context menu associated with the selected network component, which can be triggered via right-mouse clicking. The following shows how to rotate a breaker. “Rotate” means rotating the selected network clockwise, while “Reverse Rotate” means rotating the selected network component counterclockwise.
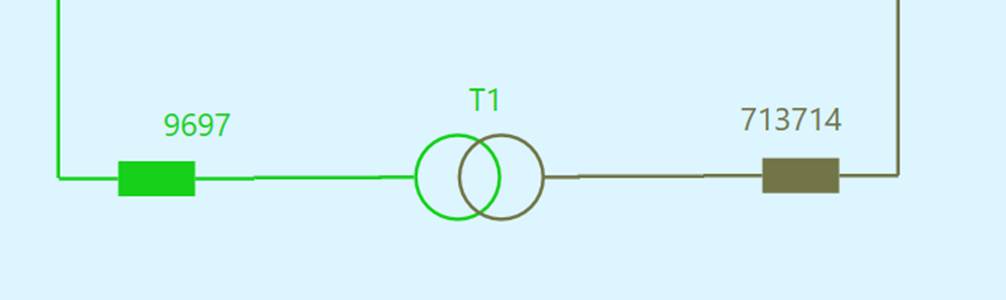
Typically users need adjust the position of the network components or the routing of the connections after the rotation. The following show an adjusted diagram after rotating the selected breaker in the above example.
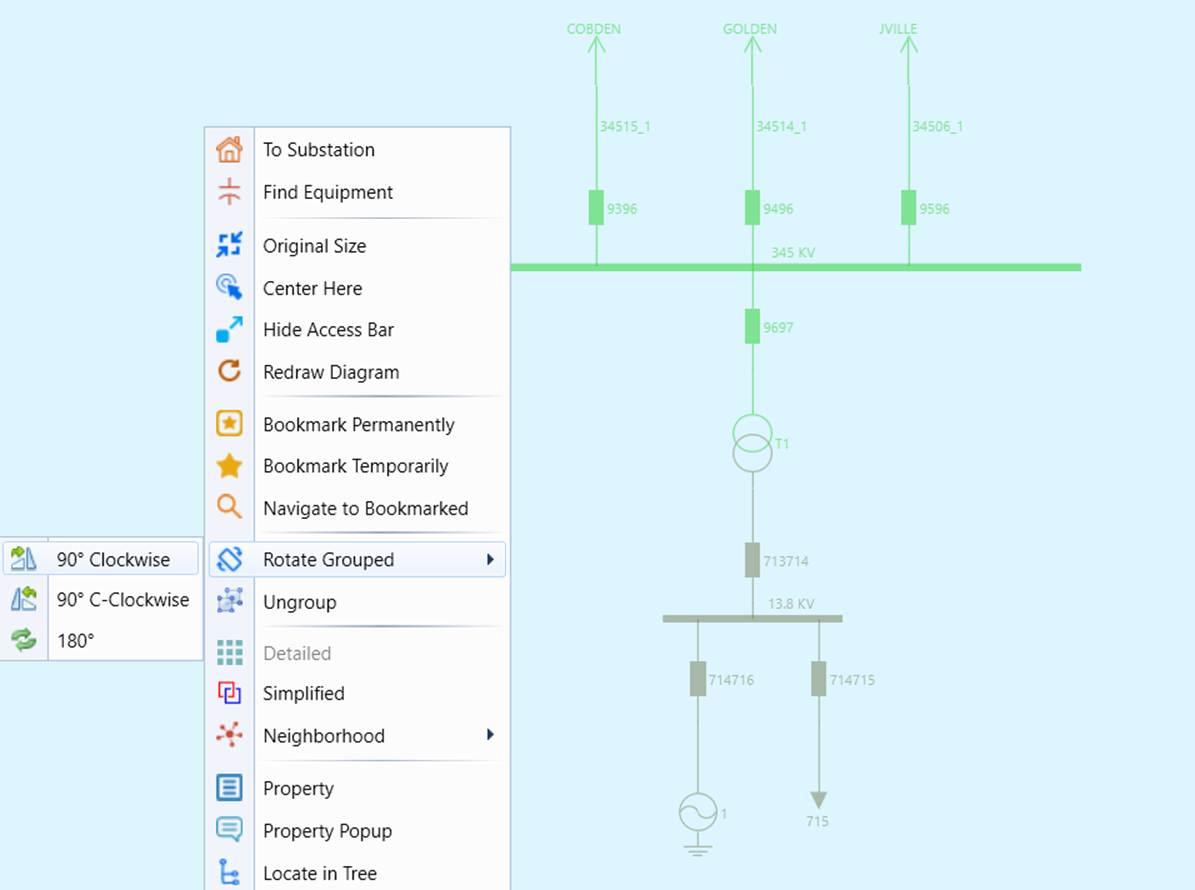
Users can also group a portion of the diagram or the whole diagram and rotate the grouped network component as a whole, as illustrated below.
Re-routing the Diagram Using Pins
Line adjustment is more involved. The Tool provides users an ability to adjust line positions by inserting, deleting, and dragging pins at various line segment points. Pin is connecting point in a line. Pins divide the line into multiple segments. Users can drag-and-drop pins to change the routing of lines in various diagrams. The following uses screenshots to introduce the pins in various diagrams
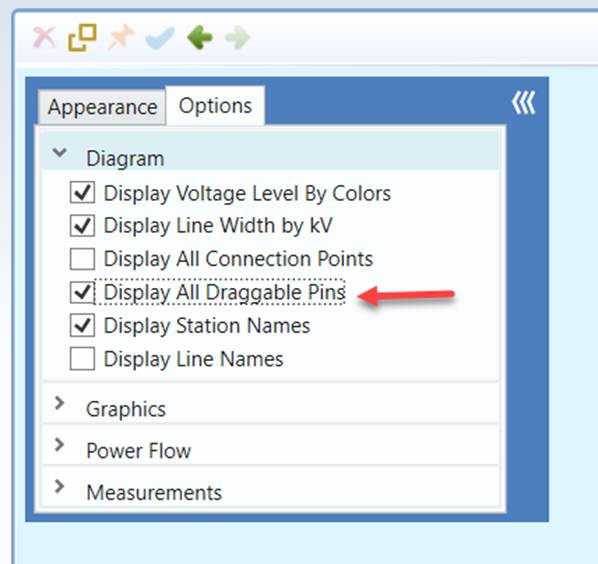
- Turn on/off Drag Pins from User Menu
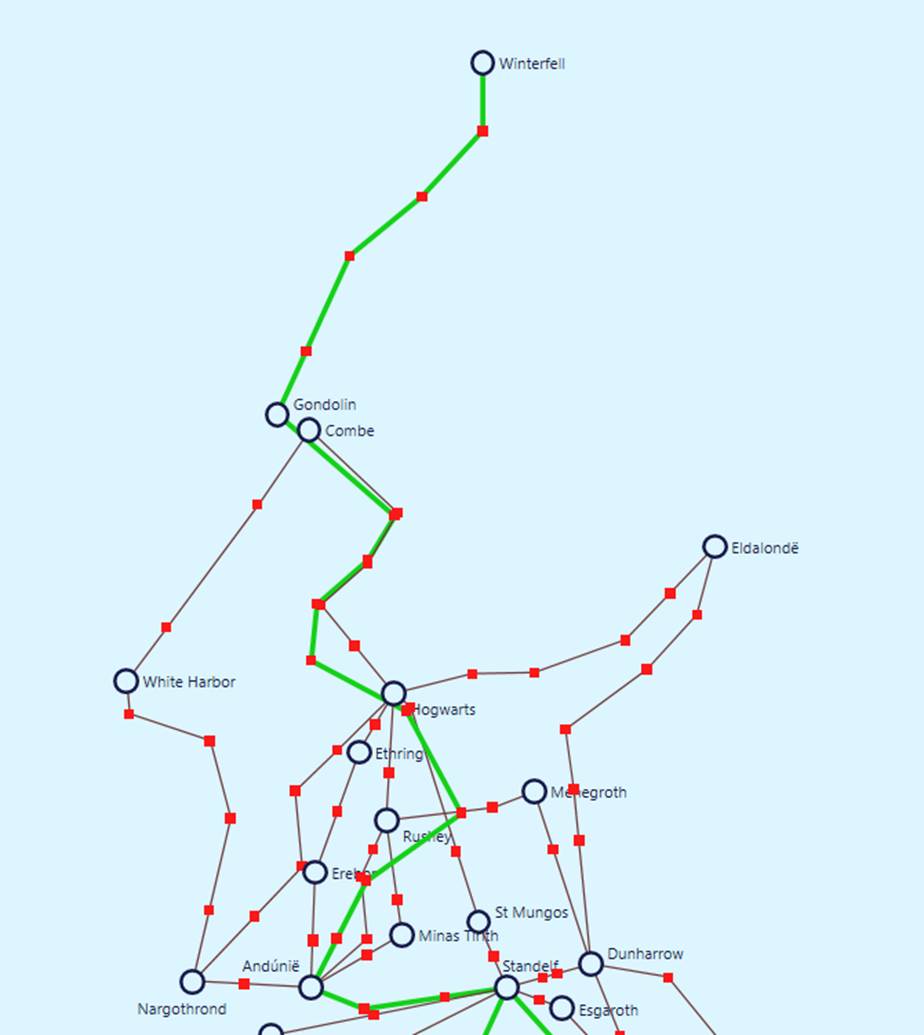
- Drag Pins in Geographic Diagram. Each pin will be shown as a red square. You can drag the pin to any location in the diagram. Line will be automatically adjusted with pin move.
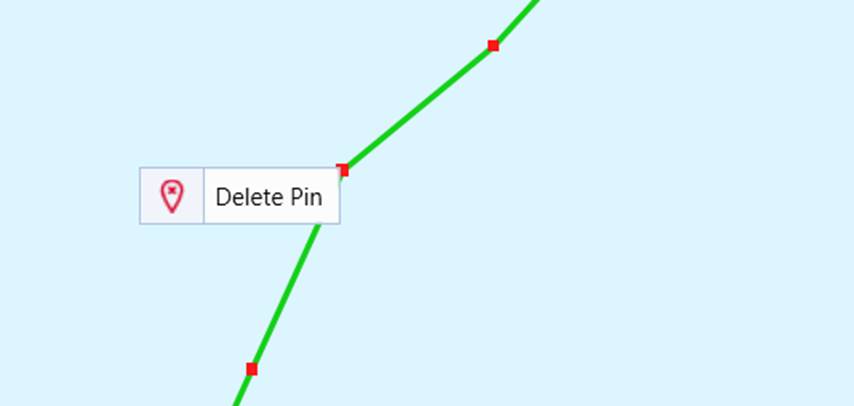
- Delete a pin. Right mouse click over a Drag Pin will show you a context menu to delete the pin. Line will be re-wired to join directly from the adjacent two pins/stations.
- Add a pin. You can add a new pin to create a new line segment point too. Right mouse click over a line will show you a context menu to add a new pin.
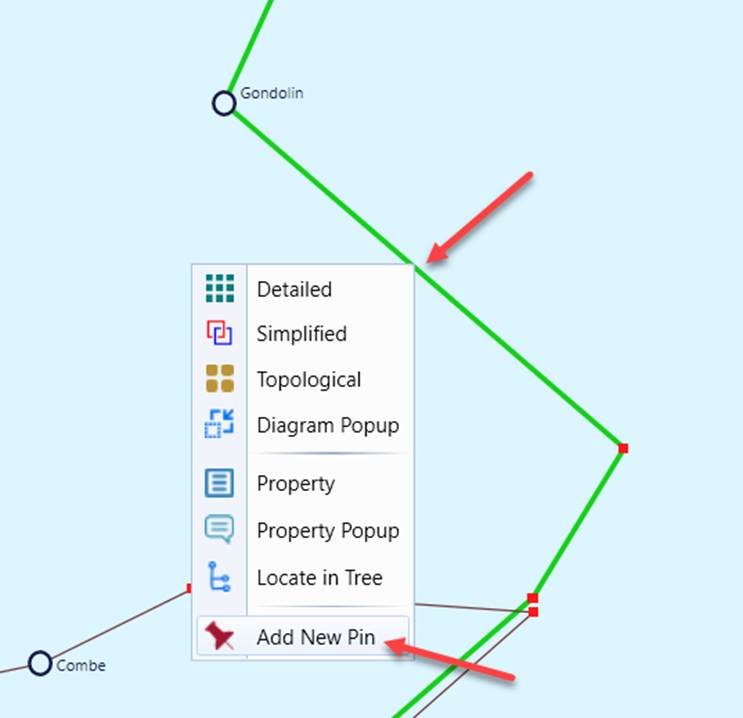
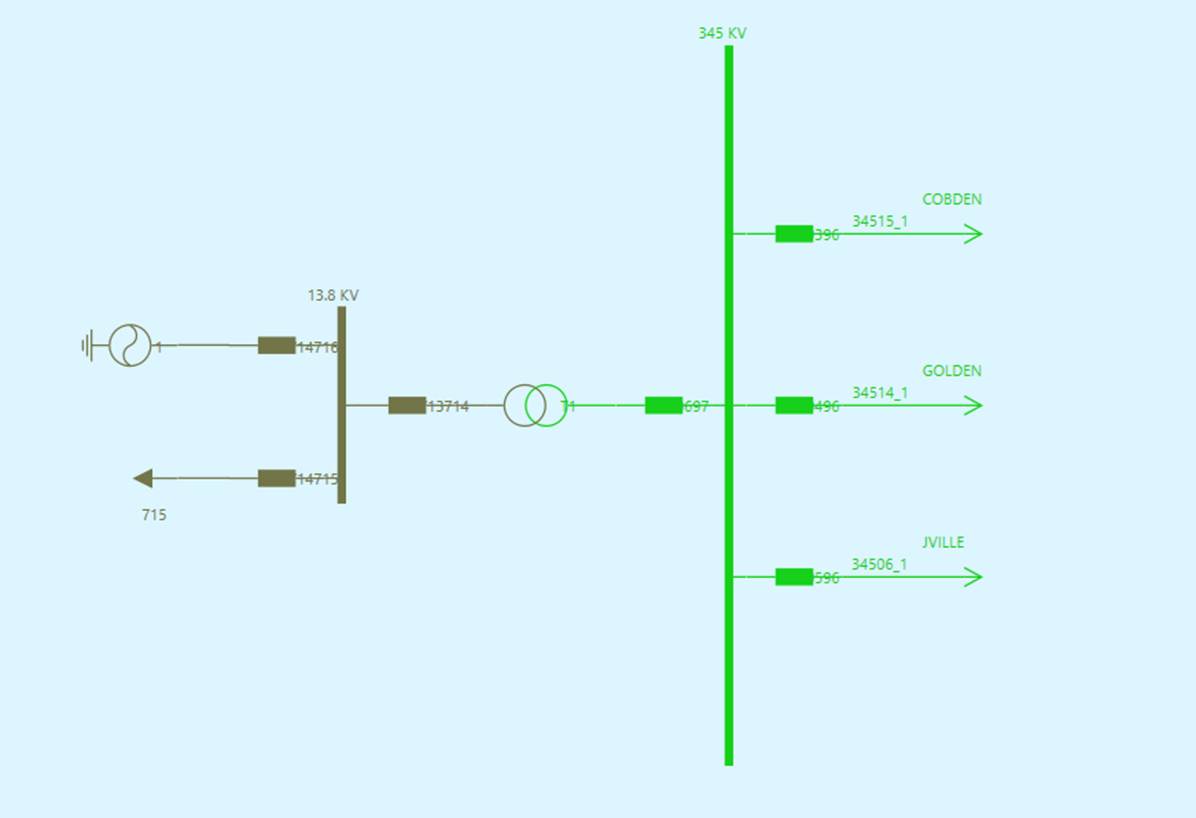
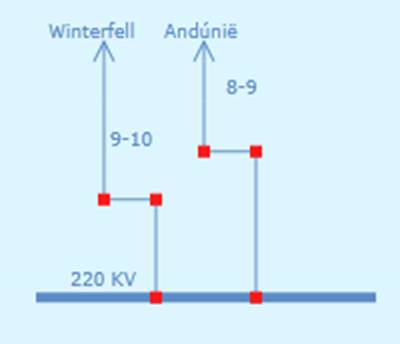
- Drag Pins in Station One Line Diagram behaves slightly different from Geographic Diagram. You have pins on both bus (at line connection points) and lines. The pins on bus can be dragged to a new position on the same bus. The pins on lines can be dragged either horizontally or vertically. Due to the restriction of the line layout, you will not be able to add or delete pins.
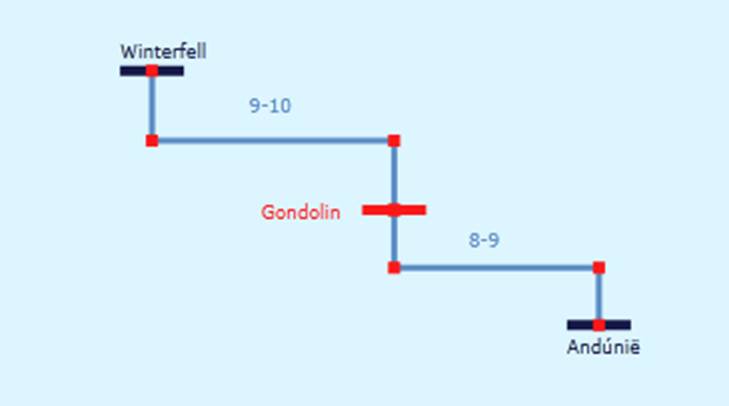
- For Neighborhood Diagram, there are two modes: Direct Connection and Non-Direct Connection. For Non-Direct Connection, drag pins behaves the same as those in Station One Line Diagram.
Adjustment of Graphical Symbols
The Tool provides mechanisms to enable users to adjust graphical symbols. More specifically,
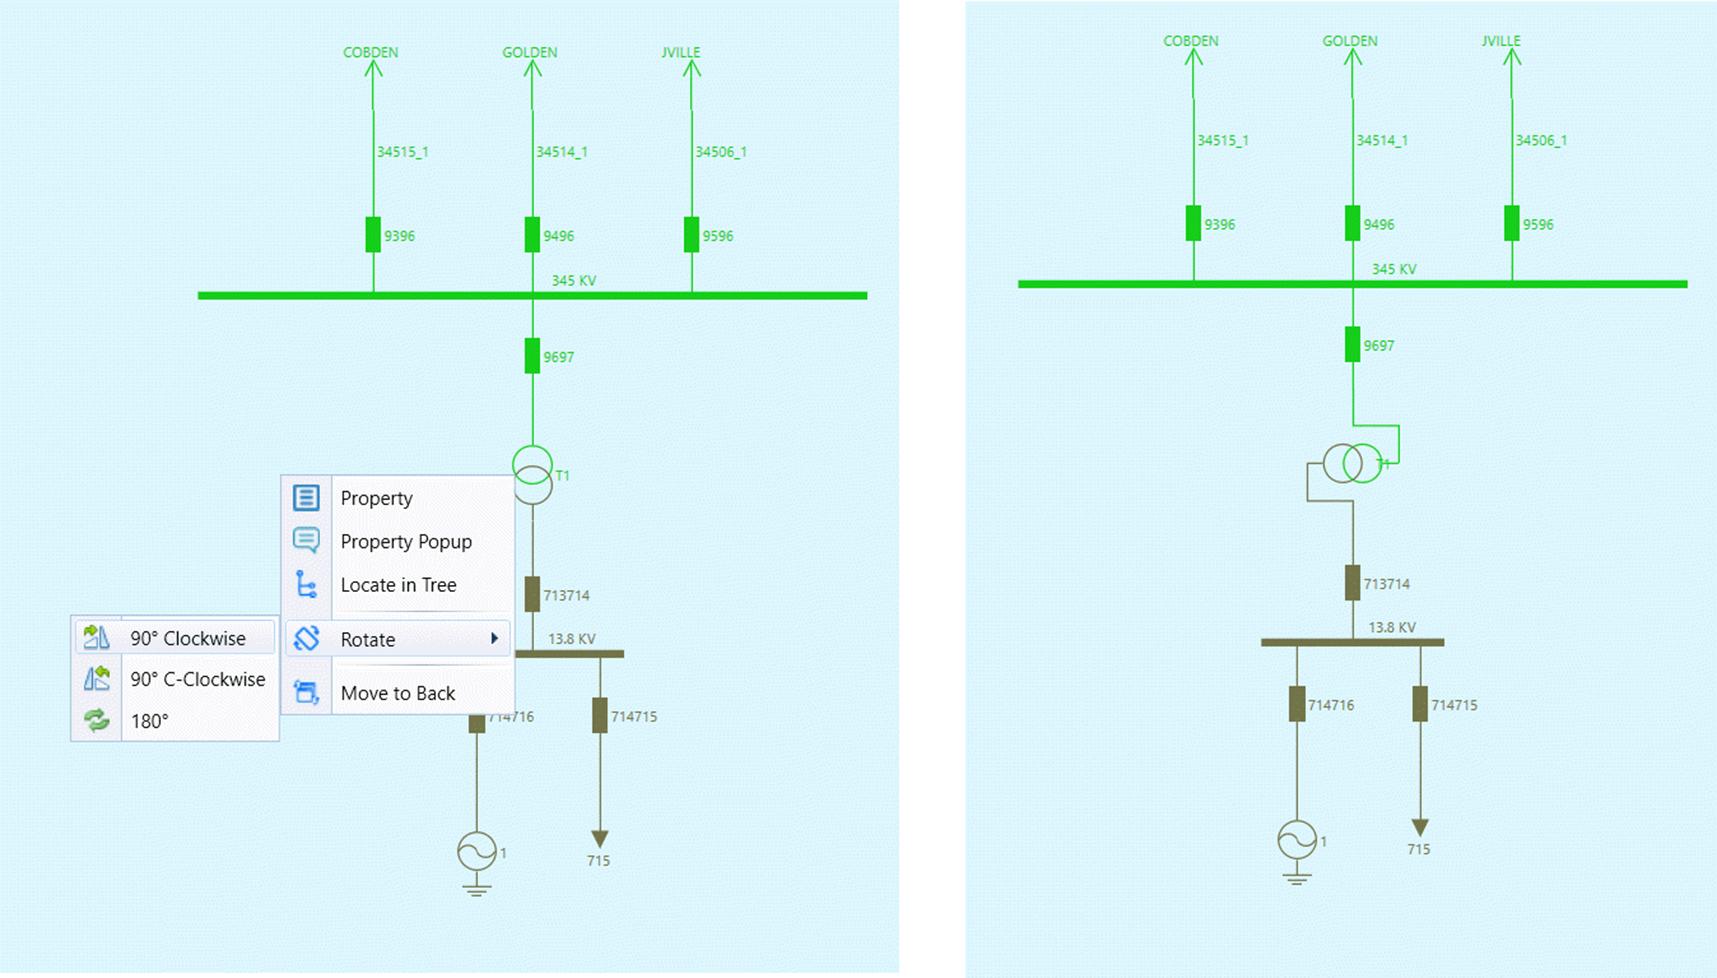
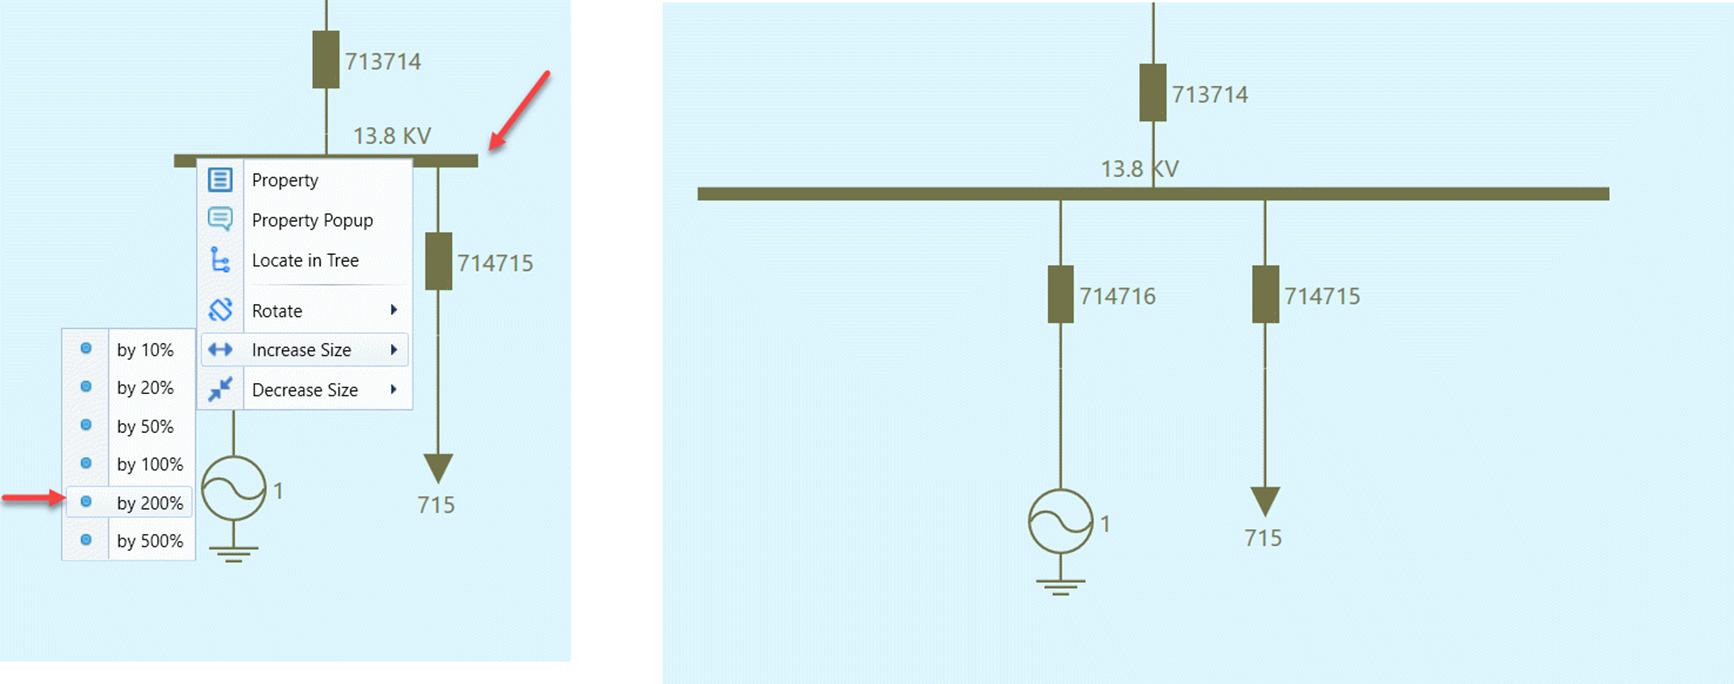
- Users can rotate graphical symbols in either direction
- Users can resize the size of the bus through dragging-and-dropping or via context menu.
Undo/Redo Diagram Adjustment
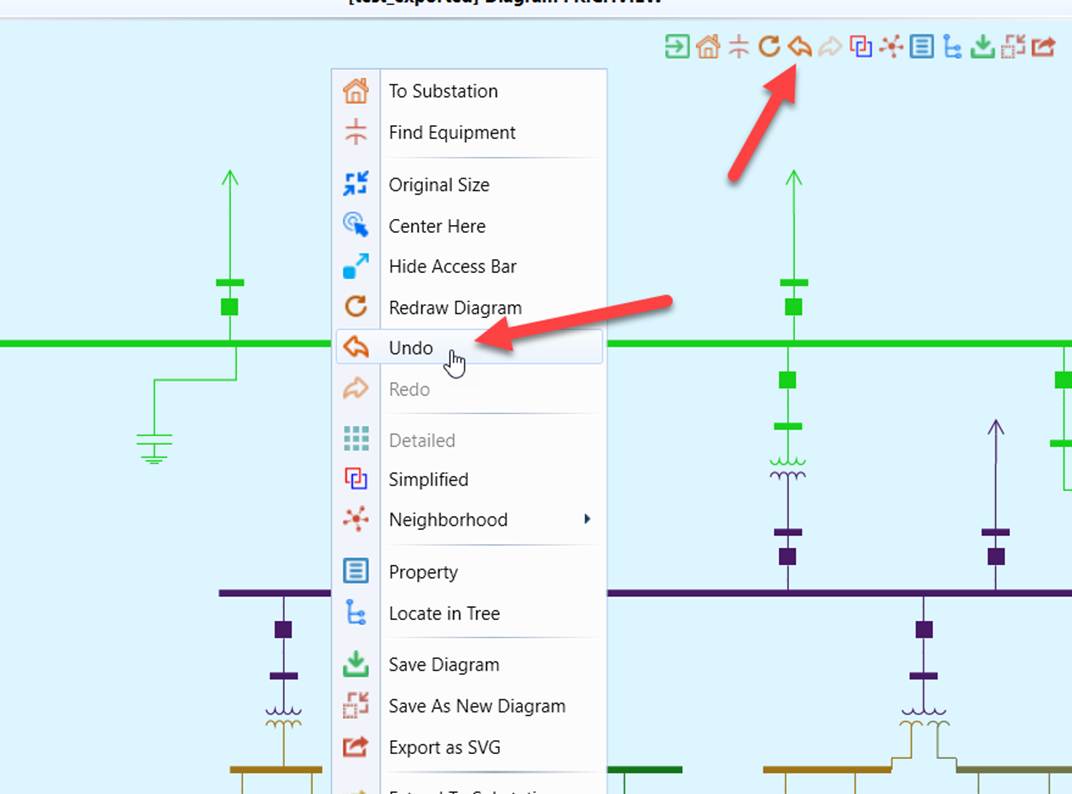
During diagram adjustment, users can undo the changes made step-by-step, as illustrated below. Note the undo/redo feature is only applicable for the saved diagrams. Other auto-generated diagrams don’t have this capability.
If the Undo icon or menu item is disabled, it means no more changes can be undone.
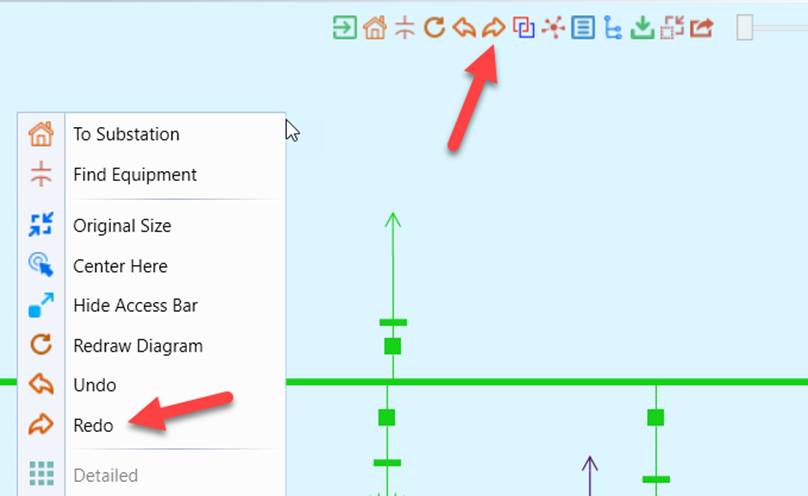
If users undo the changes, they can also redo the changes, as illustrated below. If the Redo icon or menu item is disabled, it means no more changes can be redone. Note: if users call some new displays during the Undo operation, they will no longer be able to redo the previous changes. Like many other forward/backward navigations, undo/redo is one-dimensional.
Label Overlap Management
To enhance the diagram quality, the Tool provides mechanisms for users to automatically or on-demand eliminate or minimize label overlaps.
Snap-to-Grid
Snap-to-Grid is a feature that automatically aligns graphical elements to a predefined grid when they are created, moved, or placed in a diagram. It ensures precision, consistency, and structured layout by snapping objects to the nearest grid intersection.