Region Diagram
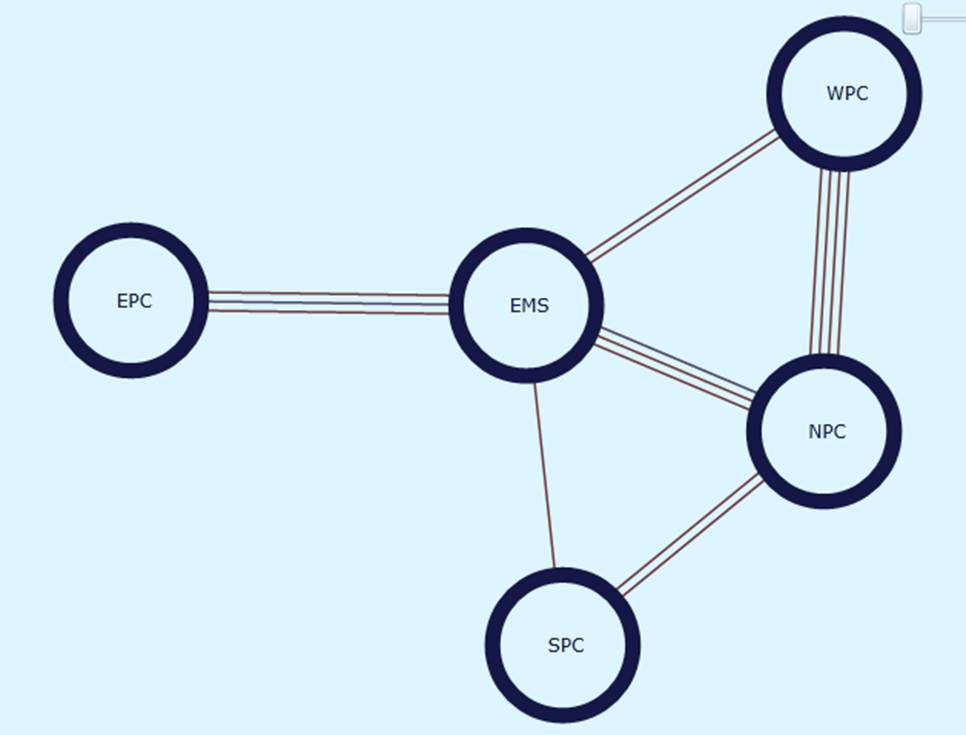
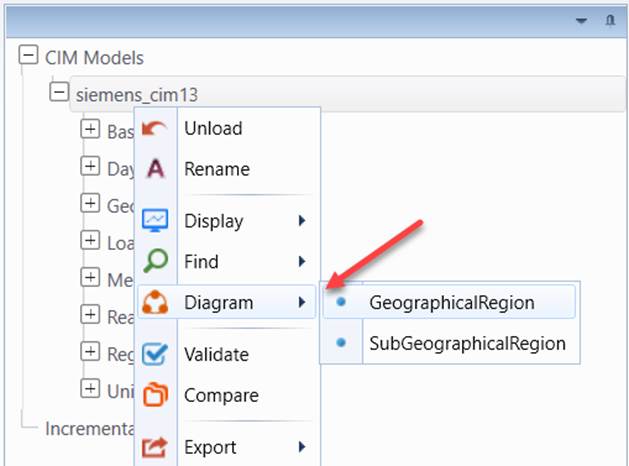
Region Diagrams enable uses to visualize the regions and their interconnections. The Tool supports two types Region Diagrams. GeographicalRegion Diagram and SubGeographicalRegion Diagram. The former displays all of the GeographicalRegions (or HostControalArea for CIM 10) and their tie connections, while the latter presents all of the SubGeographicalRegions (or SubControlAreas for CIM 10) and their tie connections. Both can be called from the context menu associated with the Model Tree Item.
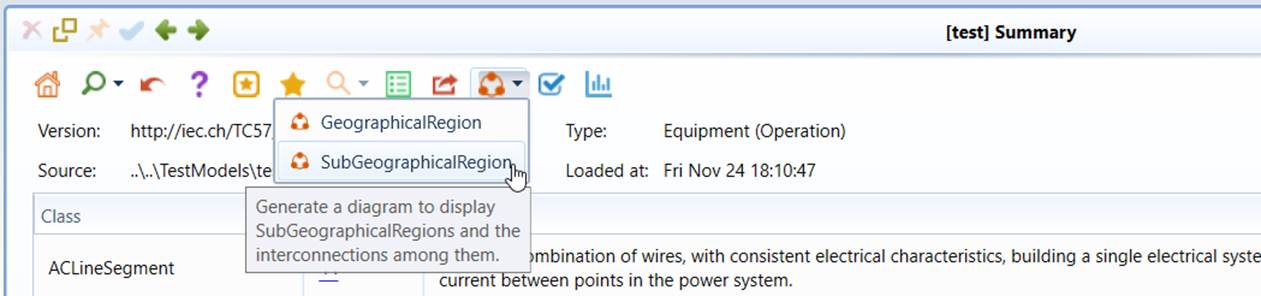
Region Diagrams can also be called from the model summary display, as illustrated below.
A Region Diagram is made up of regions (GeographicalRegion/SubGeographicalRegion or HostControalArea/SubControlArea for CIM 10)) connected by tie lines (ACLineSegments/SeriesCompensators that connect different regions). Region Diagrams provide an overview of the interconnect at a high level. Mouse-over the graphical symbol, a data grid or a diagram will pop up to show the attributes of the represented CIM objects. Users can also navigate to corresponding display by double-clicking the graphical symbol.