Multi-Station Diagram
A Multi-Station Diagram is designed to display an interconnected portion of a network across multiple substations. It provides a detailed, simplified, or topological representation of equipments and their connections across multiple substations. This diagram can be auto-generated to visualize details of:
- A multi-segment Line;
- A Contingency with ContigencyElements highlighted;
- The whole or selected portion of Neighborhood Diagram;
- The whole or selected portion of Geographical Diagram.
Line & Contingency Diagram
A Line is a container for ACLineSegments that span multiple substations. In most cases, a Line consists of a single ACLineSegment; however, multi-segment Lines are common in many models.
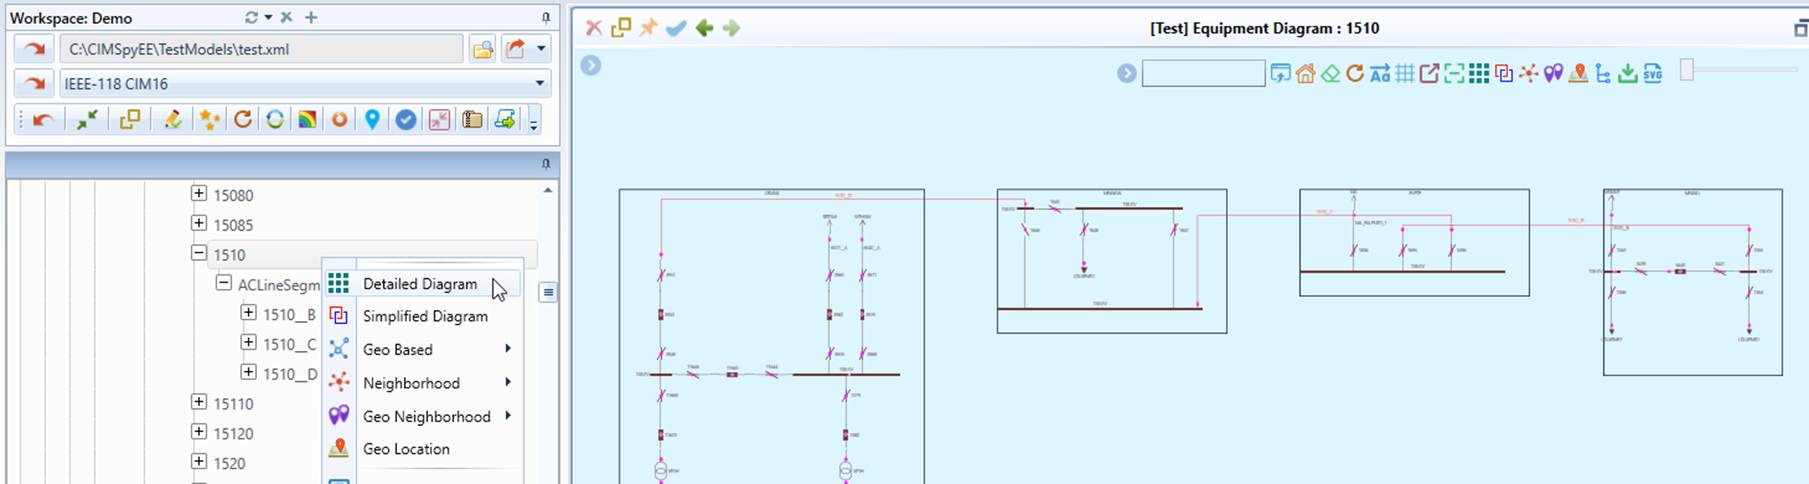
The Line Diagram can be invoked from the context menu associated with the Line object in the tree view, as illustrated below.
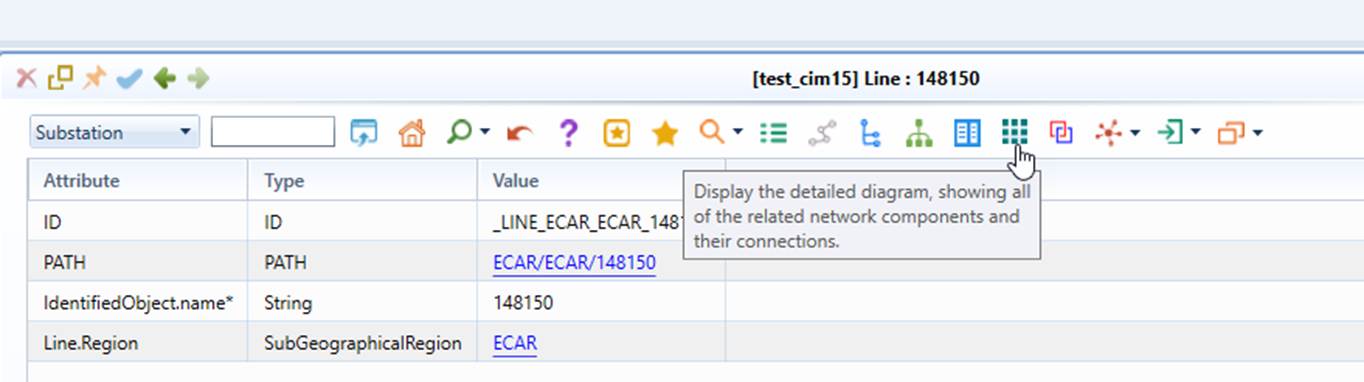
It can also be invoked from the command icon in the Form Display of the Line object, as illustrated below.
Like a Line, a Contingency may contain ACLineSegments that span multiple substations. The Contingency Diagram can be invoked in the same way as the Line Diagram. In a Contingency Diagram, all network components associated with the member ContingencyElements are highlighted in red, as illustrated below.
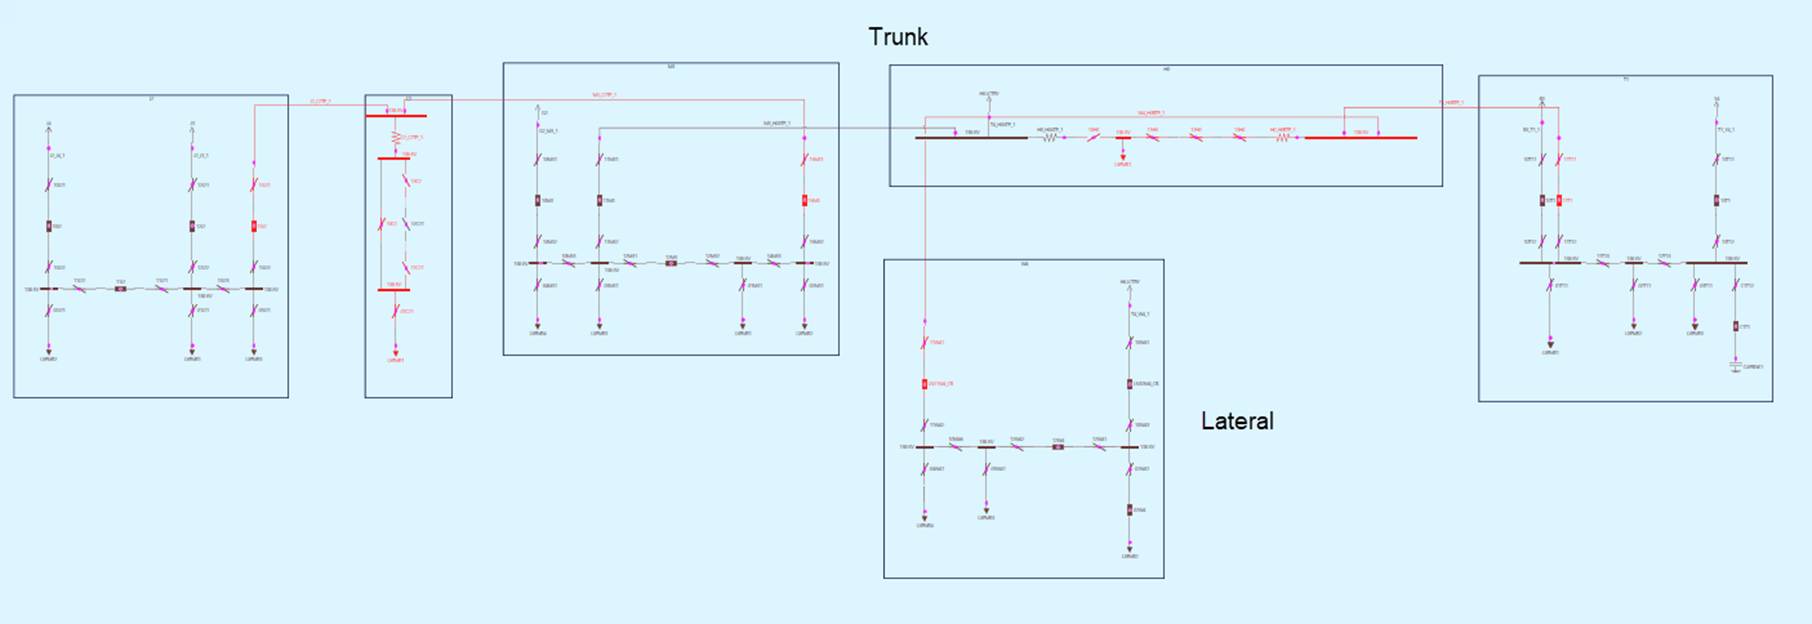 
Both the Line Diagram and Contingency Diagram are laid out using a Trunk/Lateral structure, where the longest path is identified as the Trunk, positioned horizontally, while all other Laterals are arranged vertically. Note that this does not mean that Substations are connected in a strict tree structure. Any substations in the diagram can be connected as long as they are linked by an ACLineSegment. The Trunk/Lateral layout simply defines the diagram's visual arrangement, making it well-suited for Line and Contingency Diagrams.
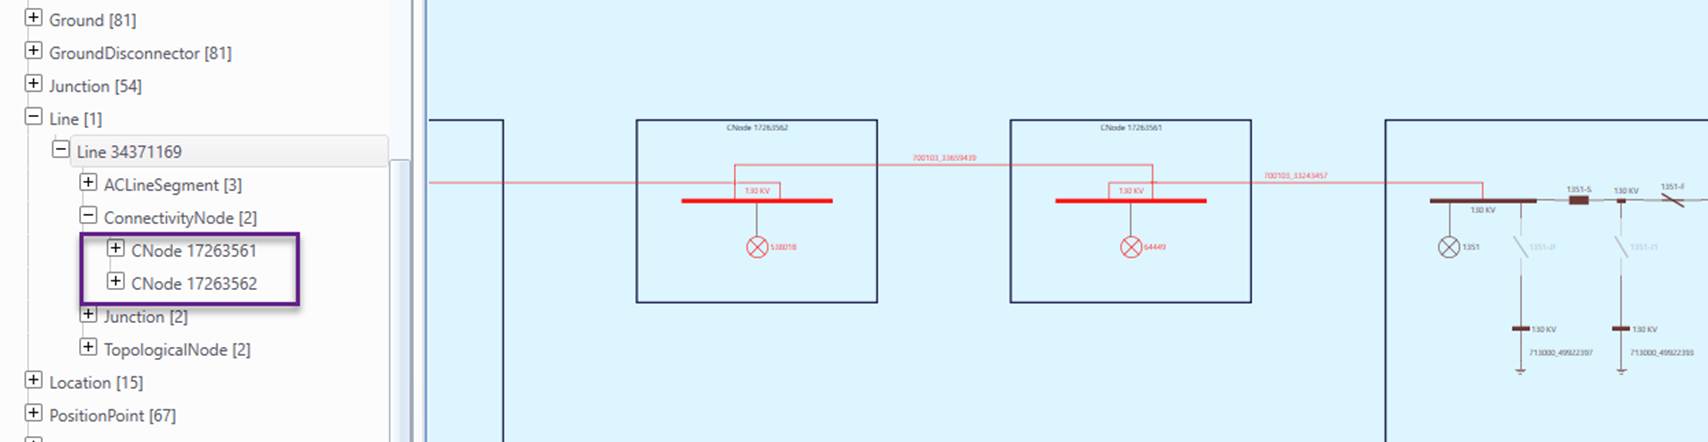
Note: If ConnectivityNodes are contained within a Line, which is common in DSO models, a dummy Substation is created for each of these ConnectivityNodes in the corresponding Line Diagram, as illustrated below. This ensures that the topological structure is accurately represented within the Line Diagram, even when a ConnectivityNode is not explicitly assigned to a Substation.
Schematic Multi-Station Diagram
A Multi-Station Diagram can be generated from a schematic Neighborhood Diagram, allowing users to visualize the details of a portion of the interconnected network. The substation positions from the Neighborhood Diagram are used to layout the Multi-Station Diagram. This allows users to control the layout of the Multi-Station Diagram by adjusting the substation positions in the Neighborhood Diagram.
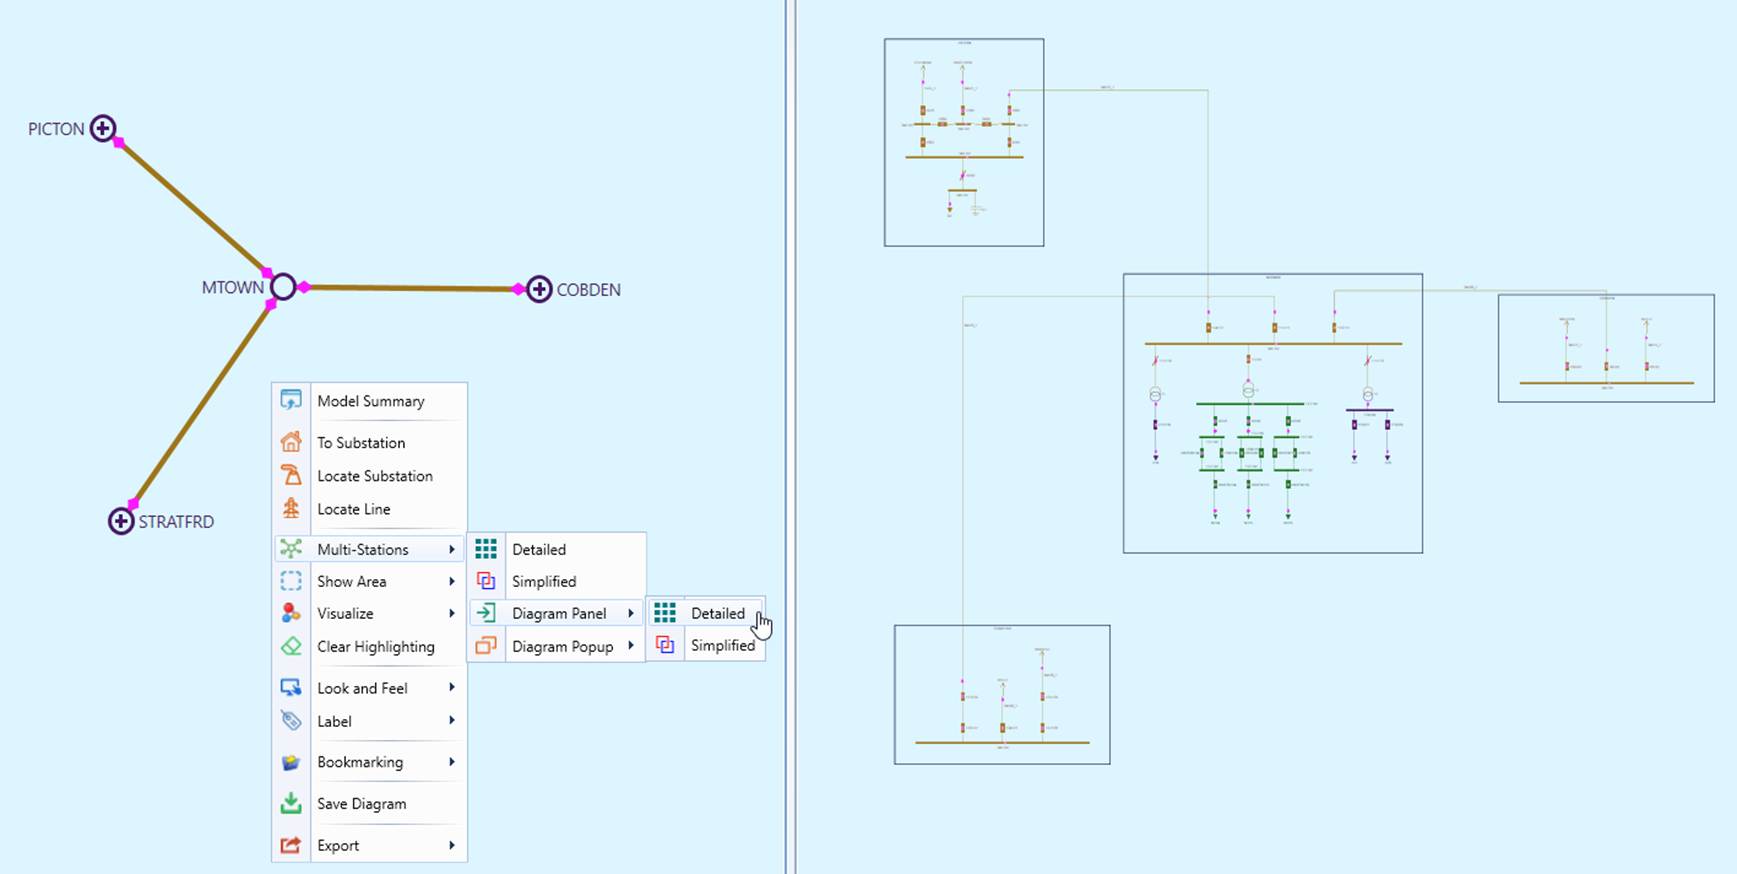
Users can also select a portion of the Neighborhood Diagram and generate a Multi-Station Diagram for the selected section. This can be done by dragging the mouse while holding the Ctrl key to draw a rectangle. A Multi-Station Diagram can then be generated for the selected area, as illustrated below. The selection can be cleared by invoking "Clear Area" from the context menu.
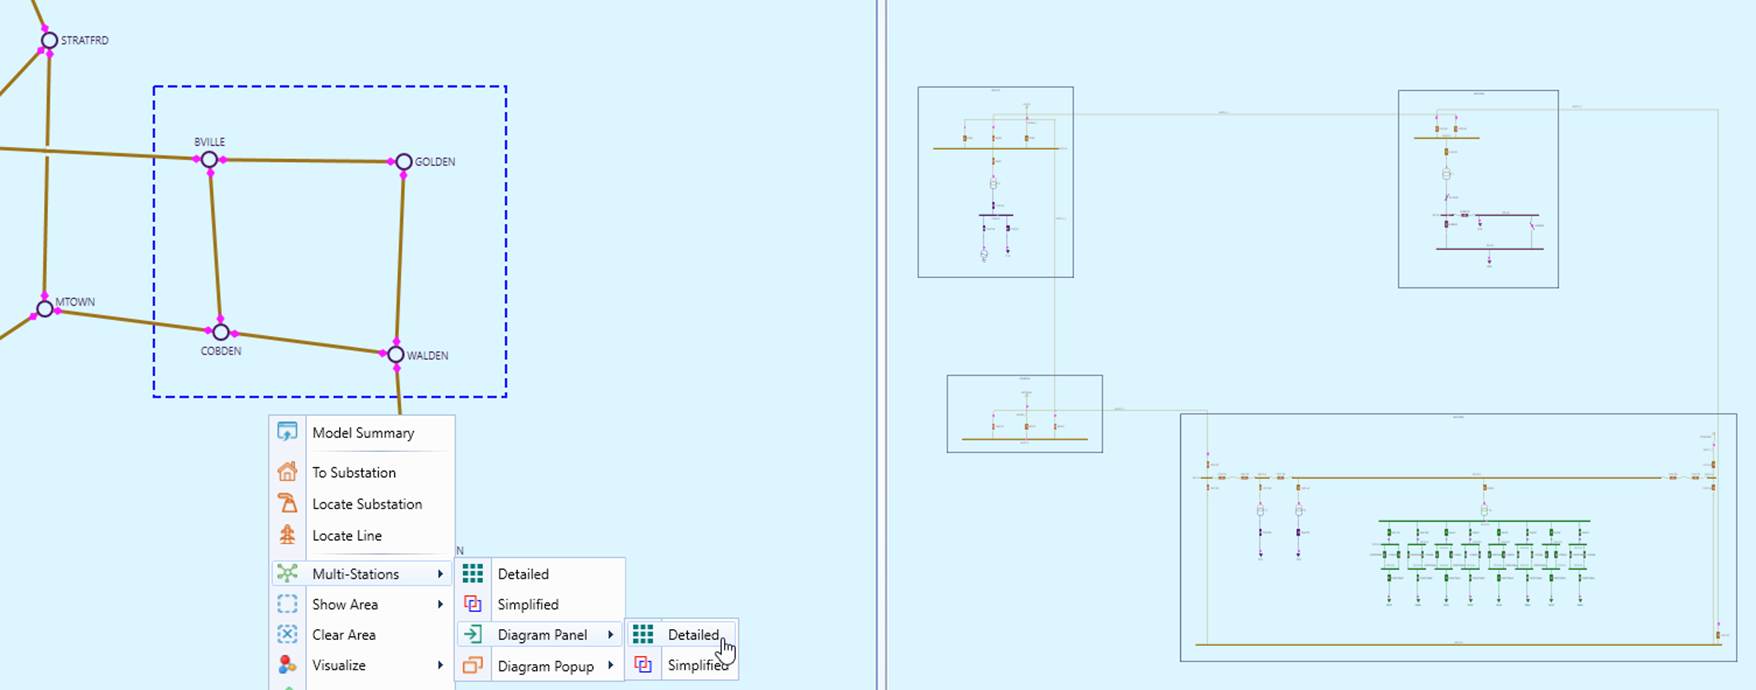
If the selected area cannot fit within a rectangle, a polygon can be drawn using the following steps:
- Hold the Alt key.
- Left-click on a point to start the selection.
- Drag the mouse to define the boundary.
- Right-click to create a turning point.
- Repeat steps 3-4 to define additional sides.
- Left-Double-click to complete the selection
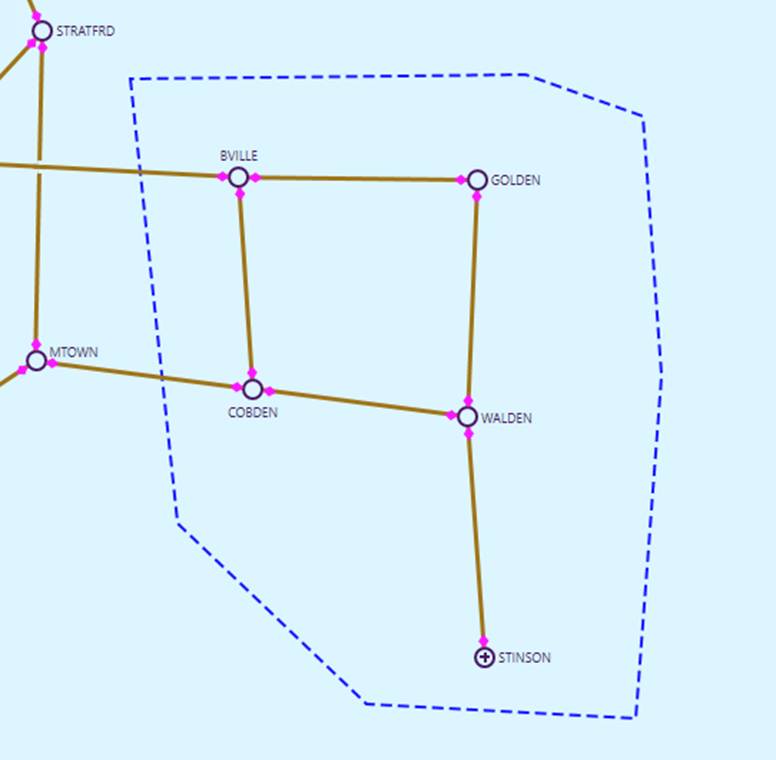
Geo-Based Multi-Station Diagram
Multi-Station Diagrams can also be generated from Geo-based diagrams, including Geographical Diagram and Geo Neighborhood Diagram, using the same methods as schematic Multi-Station Diagrams. In a geo-based Multi-Station diagrams, the geographical locations of the Substations, are used to guide the layout, as shown below. Notably, the resulting Multi-Station Diagrams resemble geographical layouts but are not strictly geo-based. The layout is optimized for a better user experience while maintaining alignment with geographical locations.
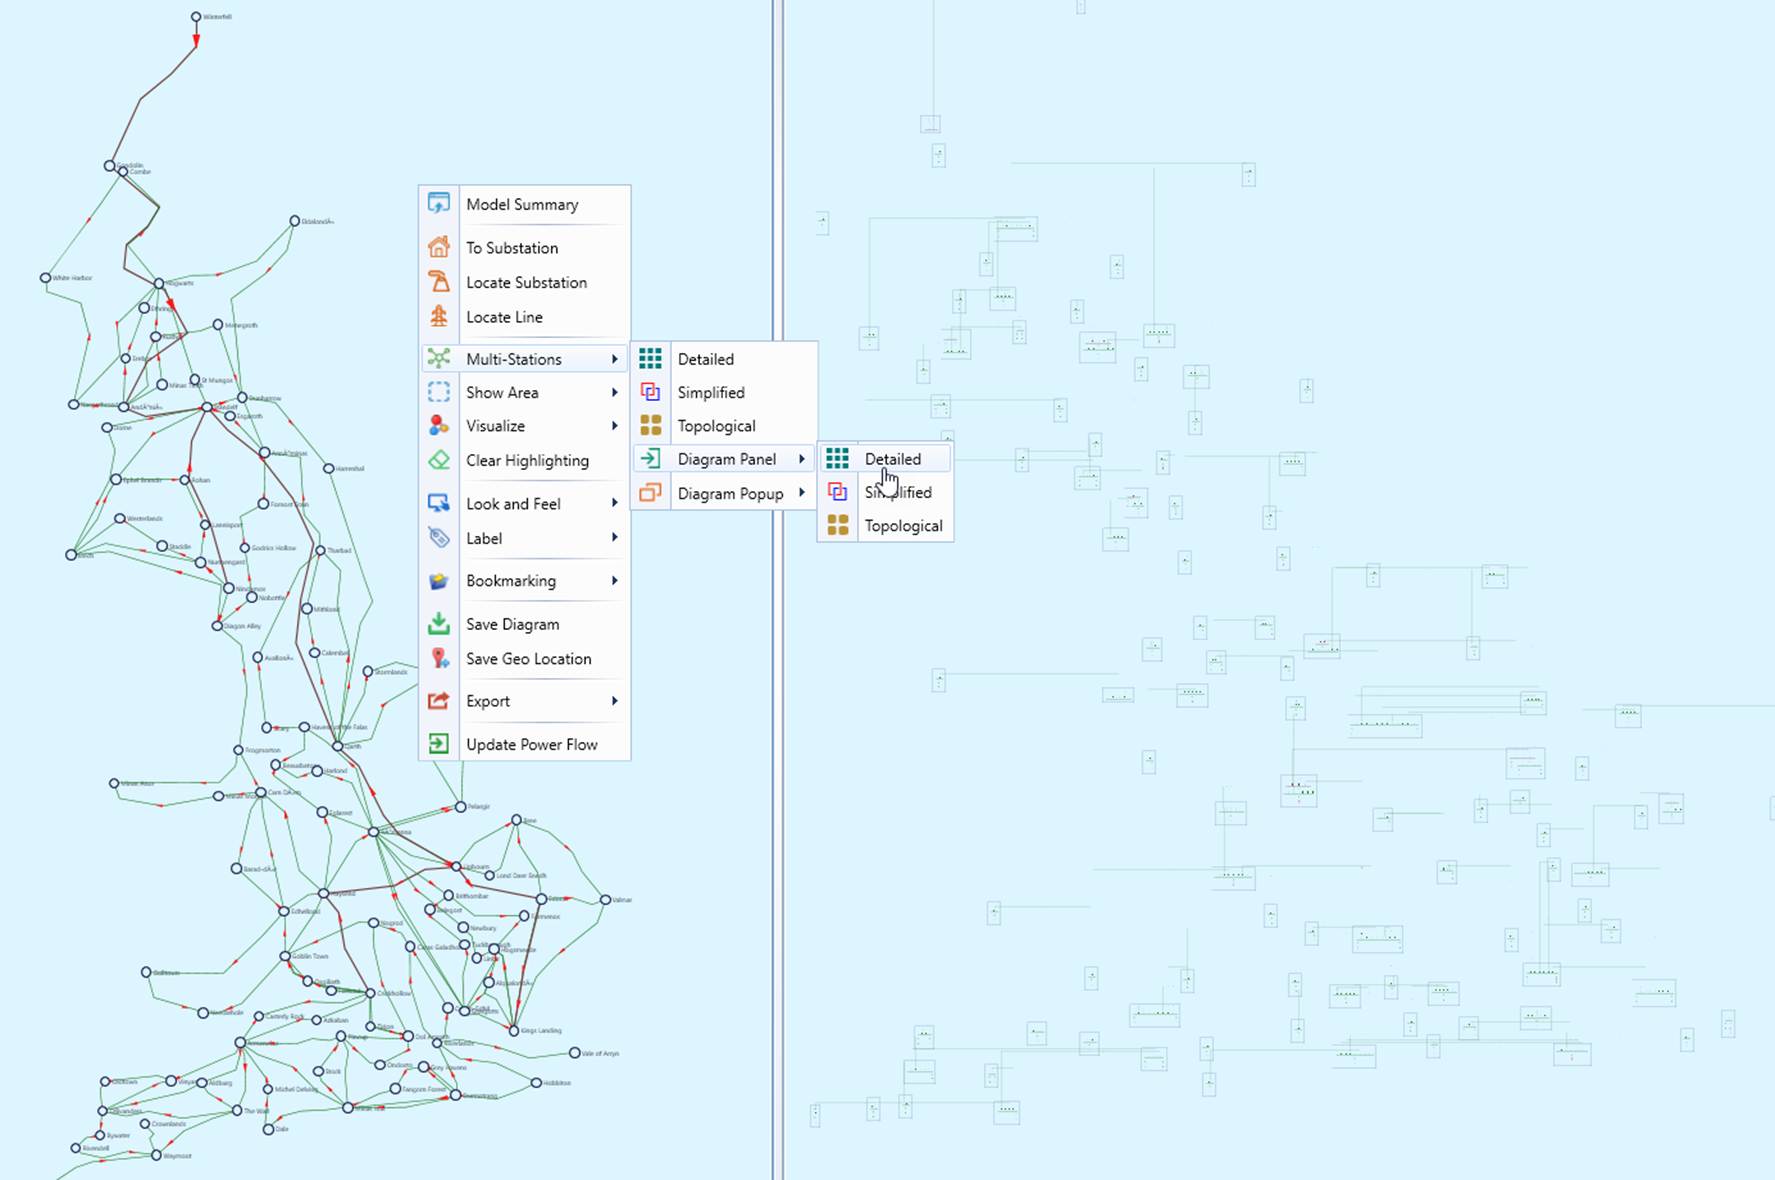
Multi-Station Diagrams provide detailed network representations, which can take a significant amount of time to generate. If the number of substations in the Geographical Diagram exceeds the predefined, configurable limit (e.g., 200), a warning message will appear, prompting users to confirm whether they wish to proceed.
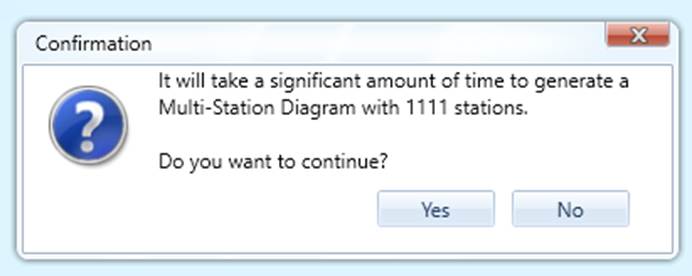
To improve performance when generating Multi-Station Diagrams, consider the following approaches:
- Generate the Multi-Station Diagram from a Regional Geographical Diagram instead of the full Geographical Diagram.
- Use a Geo Neighborhood Diagram as the source for the Multi-Station Diagram.
- Generate the Multi-Station Diagram for a selected portion of the Geographical Diagram rather than the entire diagram, using the same selection method described above.
Adjusting Multi-Station Diagram
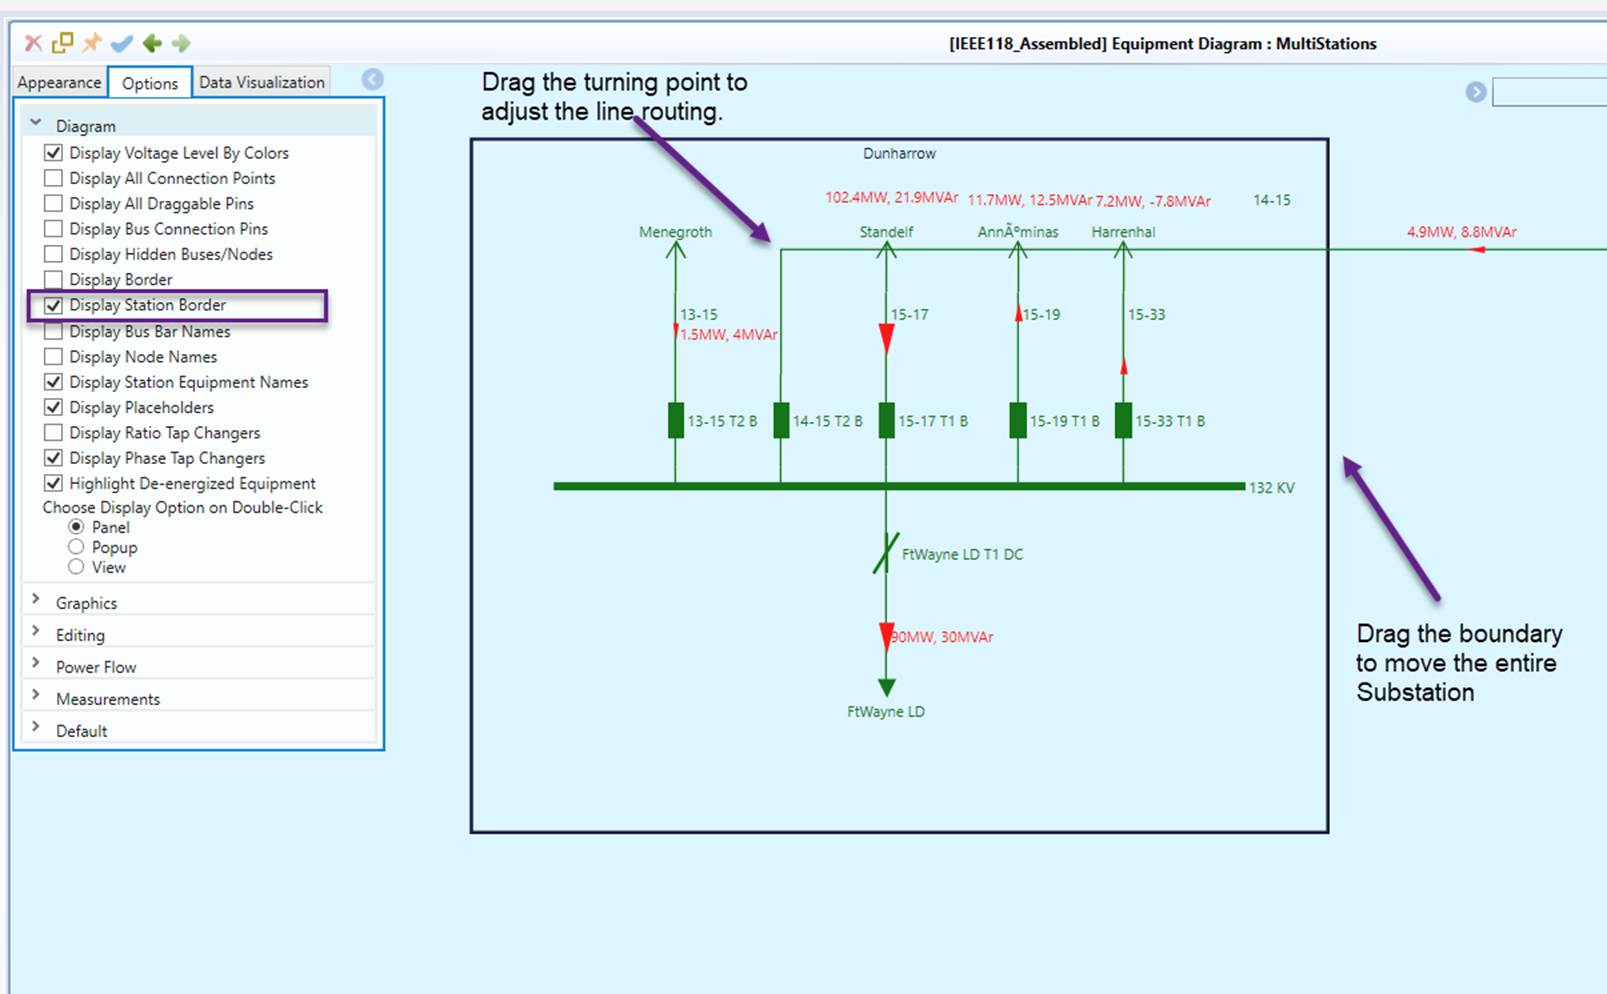
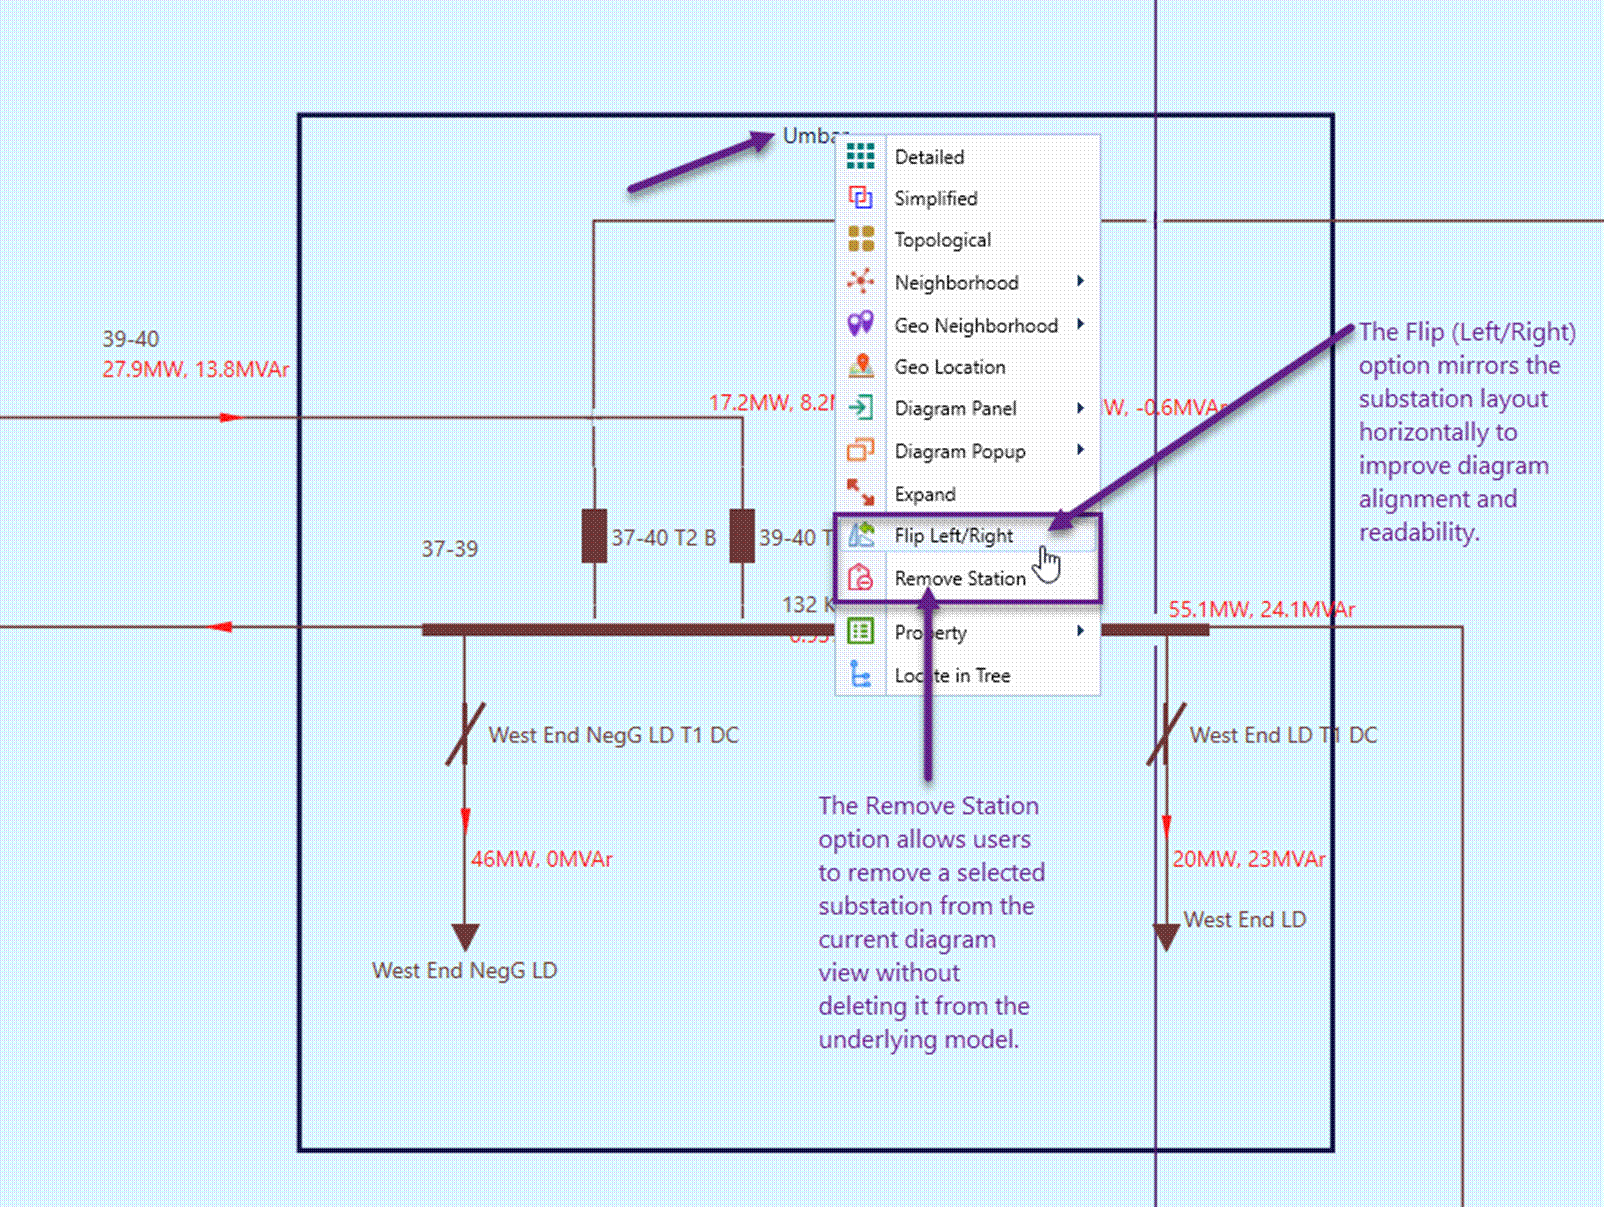
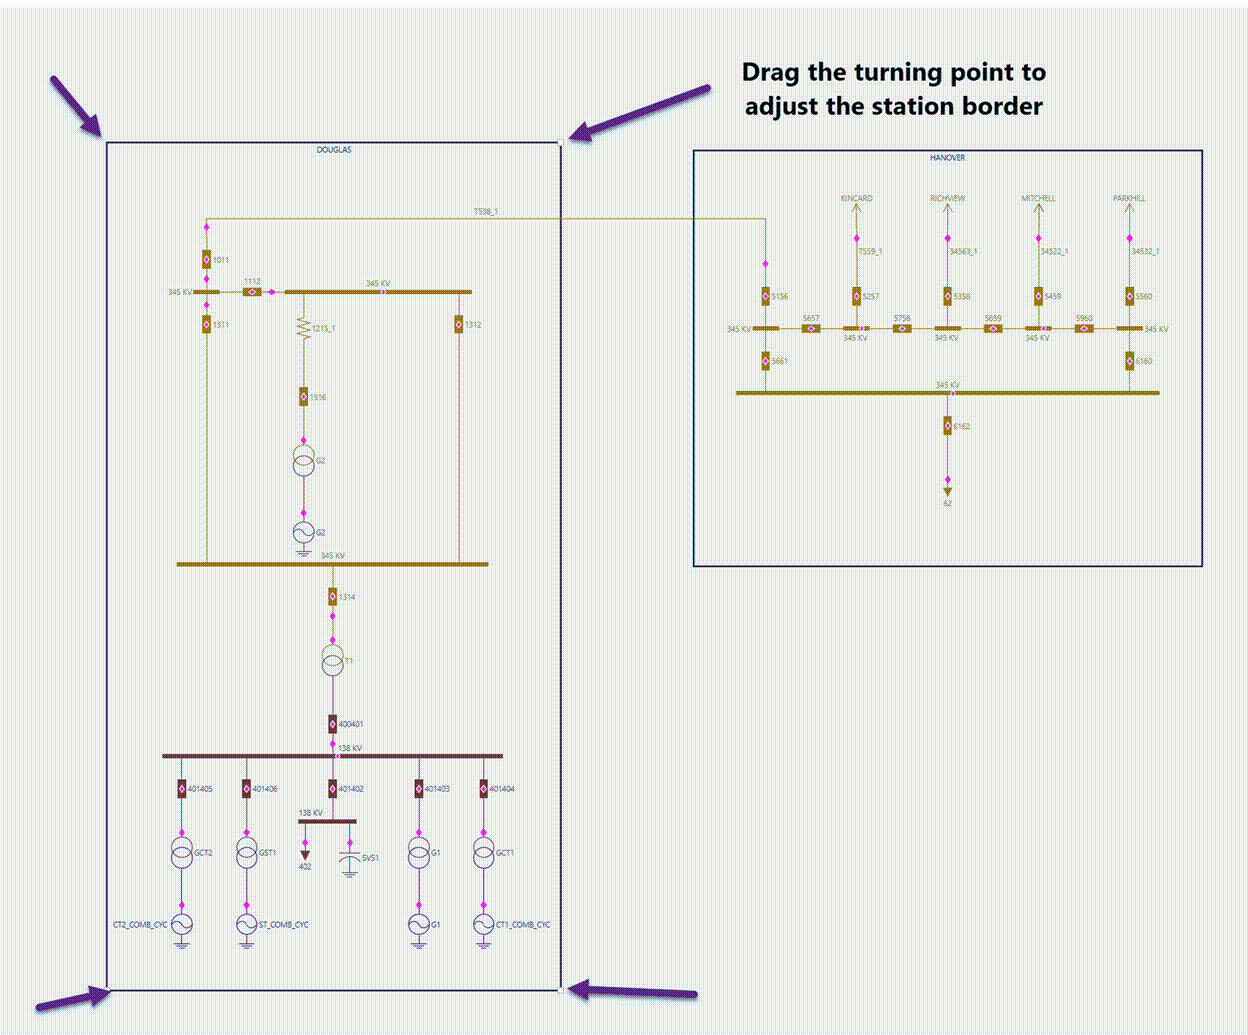
The Multi-Station Diagram can be adjusted similarly to a Substation Diagram. The following figure illustrates several features specifically useful for adjusting a Multi-Station Diagram. Among these, moving an entire substation by dragging and dropping its boundary is the most useful. This allows users to adjust the layout while treating the substation as a whole, ensuring a more structured and intuitive arrangement.