Semantically- rich Graphical Representation
The Tool is capable of generating various types of diagrams to help users visualize the model. Additionally, it uses a variety of graphical representations to encode the rich modeling information in the generated diagrams to help users better understand the model. The following lists some of the rich graphical representations that are used to convey the modeling information on the top of the generated diagrams
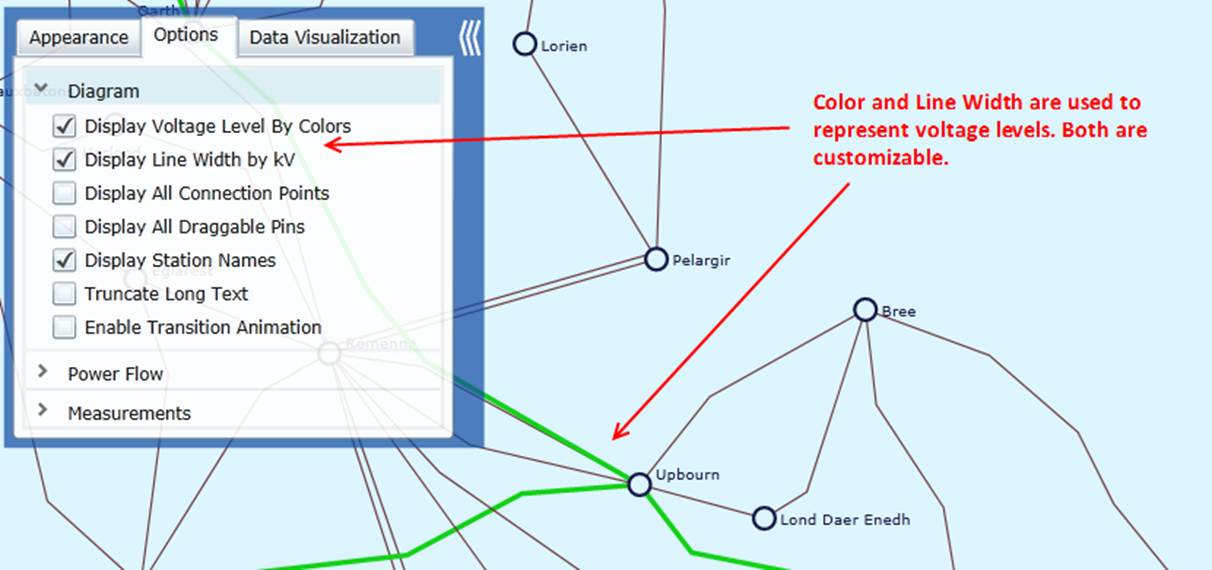
Displaying Voltage Levels
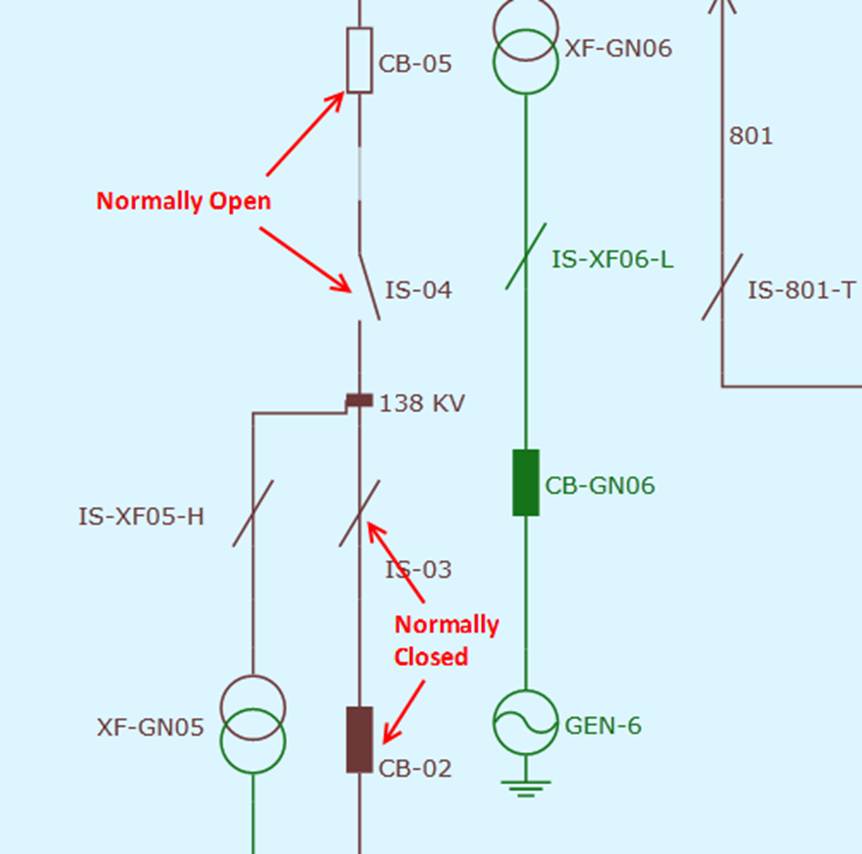
Displaying Switch Status
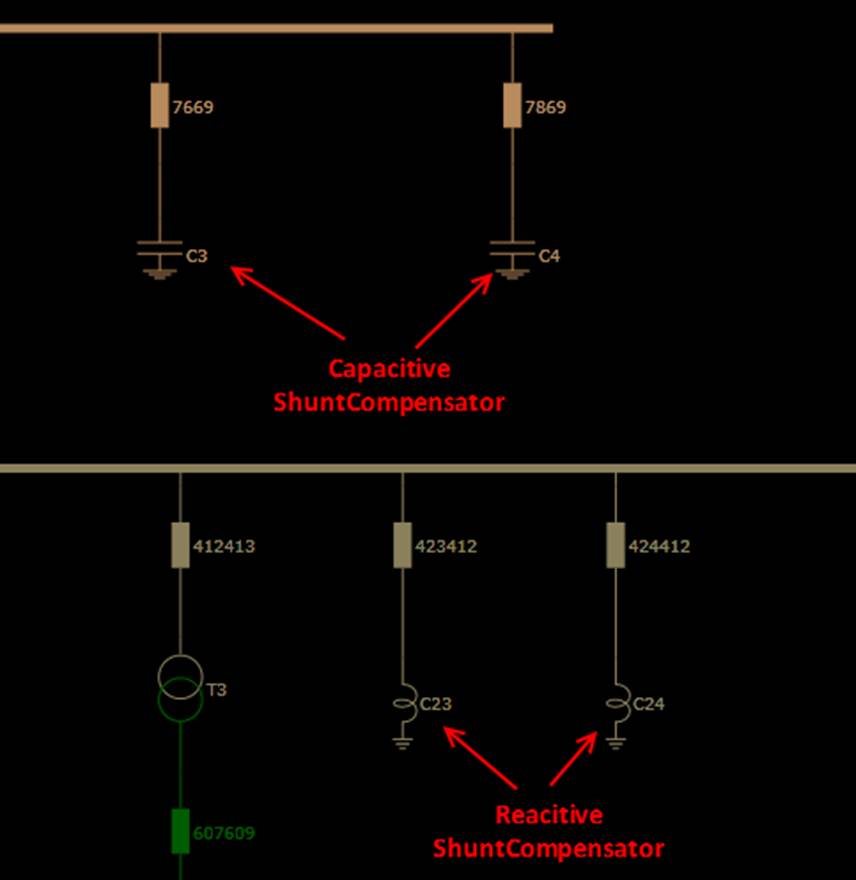
Displaying MVAR Compensation
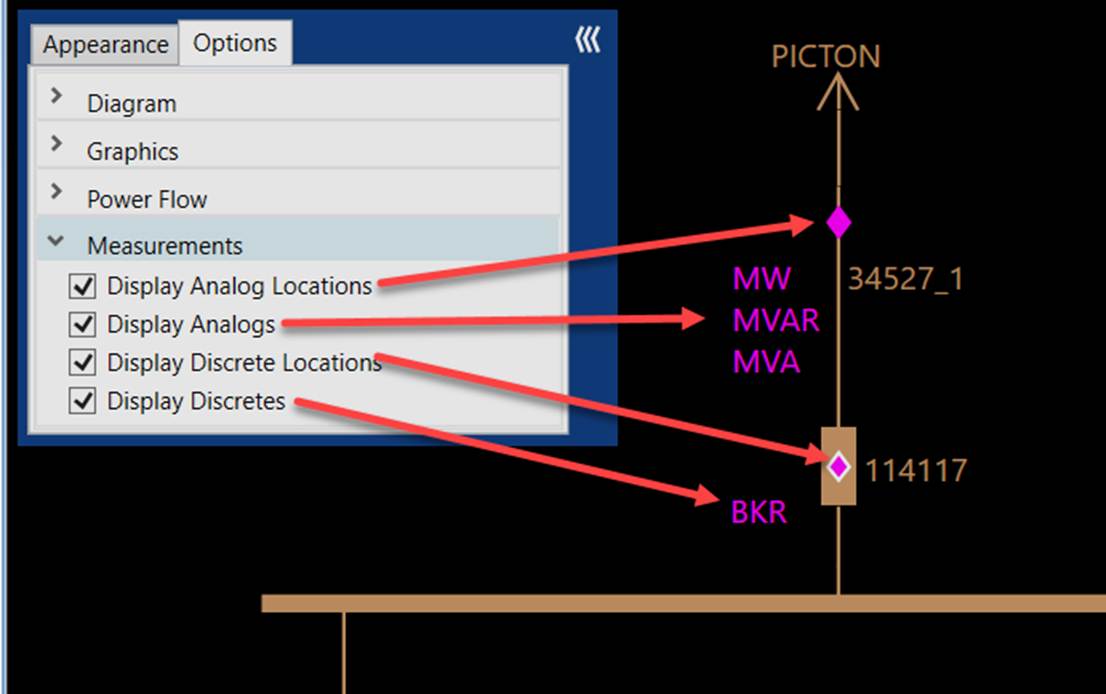
Displaying Equipment Measurements
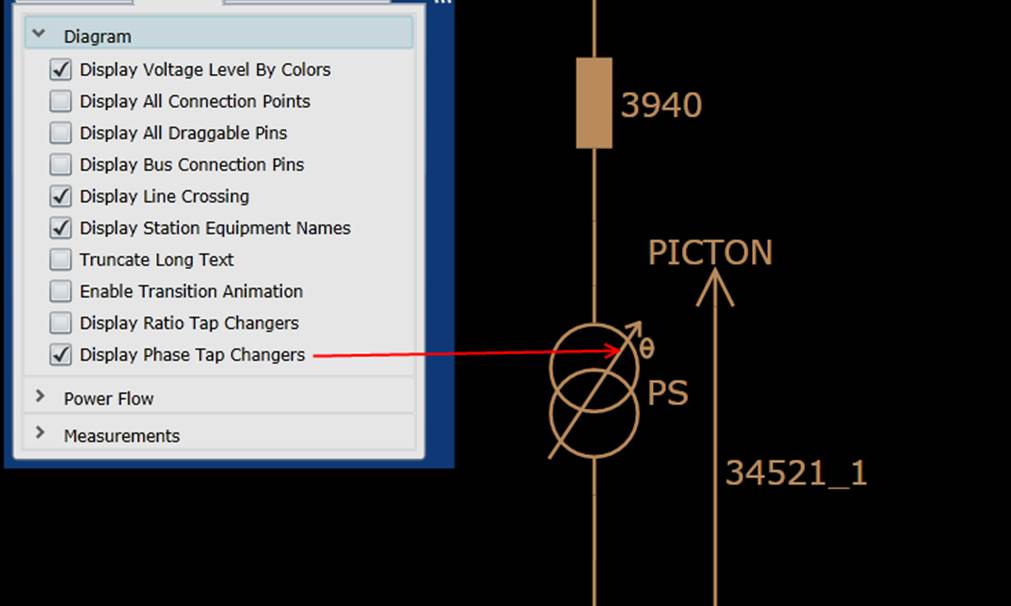
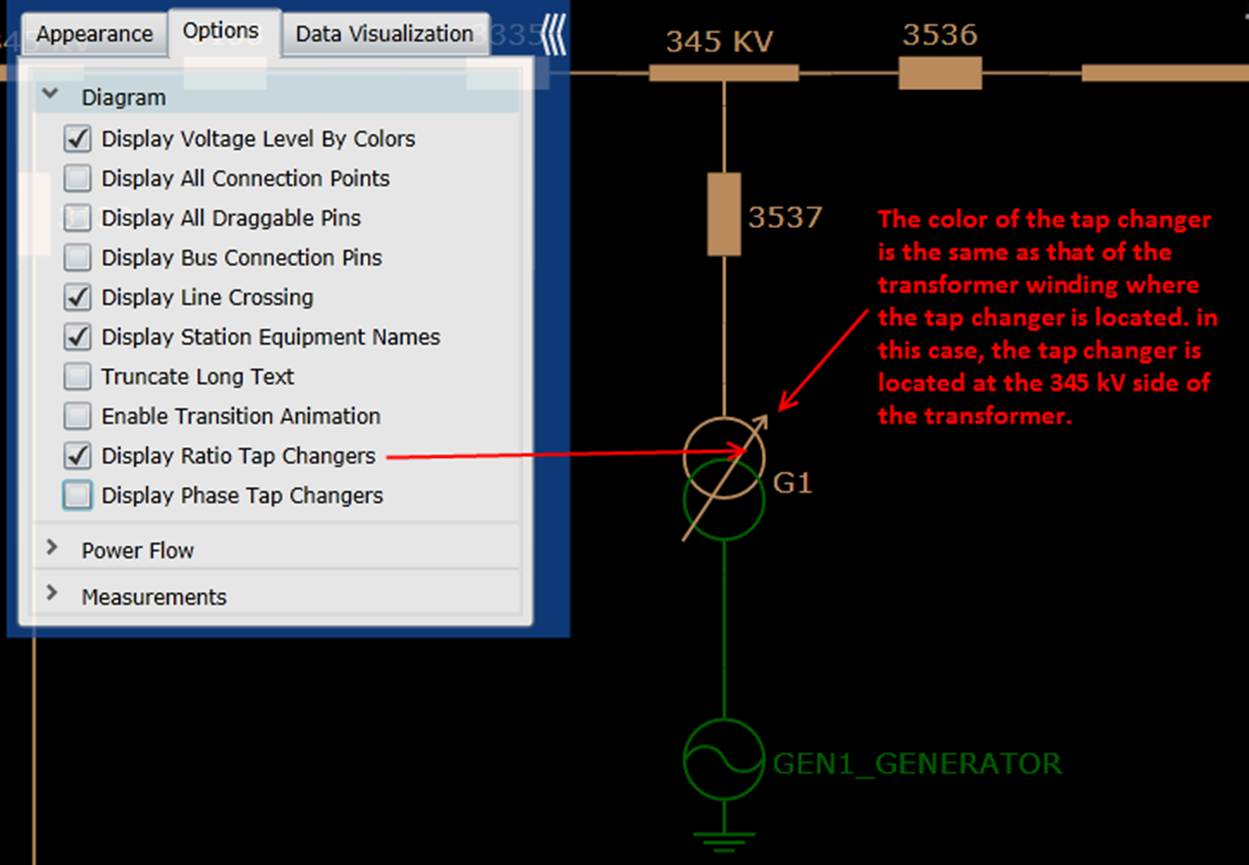
Displaying Ratio and Phase Tap Changers
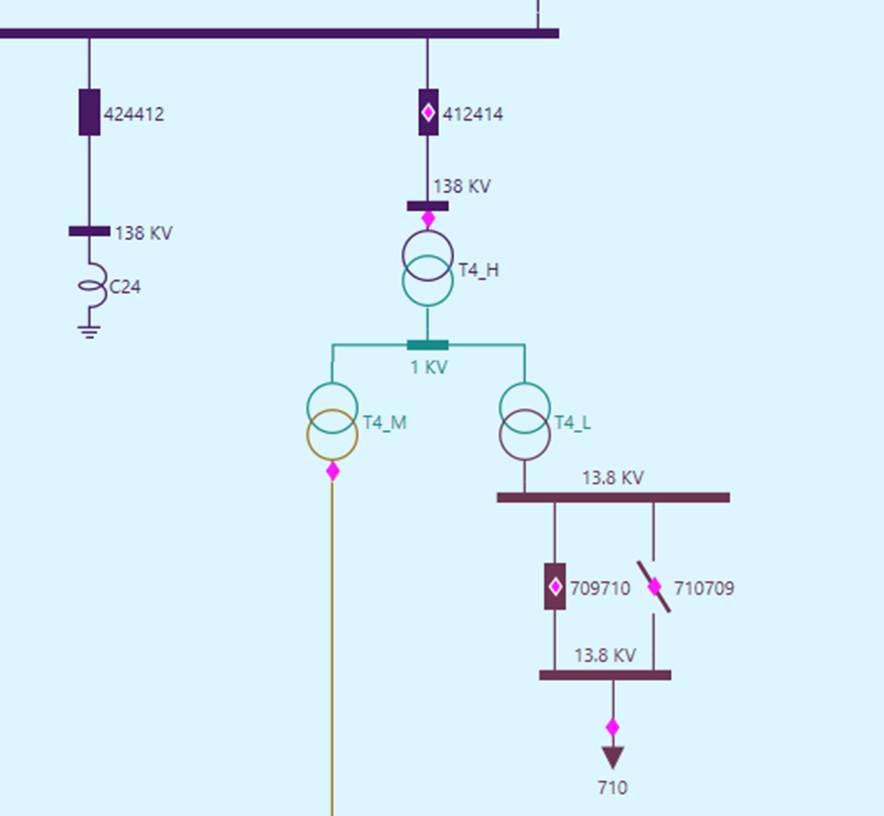
Displaying 3x2Winding Transformer
In many models, 3-winding transformers are decomposed into three 2-winding transformers to maintain compatibility with legacy tools and systems. Once such a decomposition is identified, the tool automatically renders the three 2-winding transformers in a layout that visually resembles a single 3-winding transformer, as illustrated below. This approach preserves data compatibility while improving diagram clarity and providing a more intuitive representation for users.