Diagram-Based Exploratory Data Analysis
Diagram-based Exploratory Data Analysis (EDA) involves visually exploring complex datasets interactively within diagrams. By leveraging this approach, users can intuitively analyze data, detect anomalies, and gain insights directly from the diagrams. This method enhances data interpretation by providing a structured and graphical representation of relationships, trends, and dependencies, allowing for more efficient data exploration and decision-making.
While Diagram-based EDA is primarily business-driven, the Tool provides built-in support for Diagram-based EDA, enabling users to customize the Tool to align with their specific business needs. This flexibility allows users to tailor data exploration capabilities, integrate domain-specific insights, and enhance decision-making through interactive diagram-based analysis.
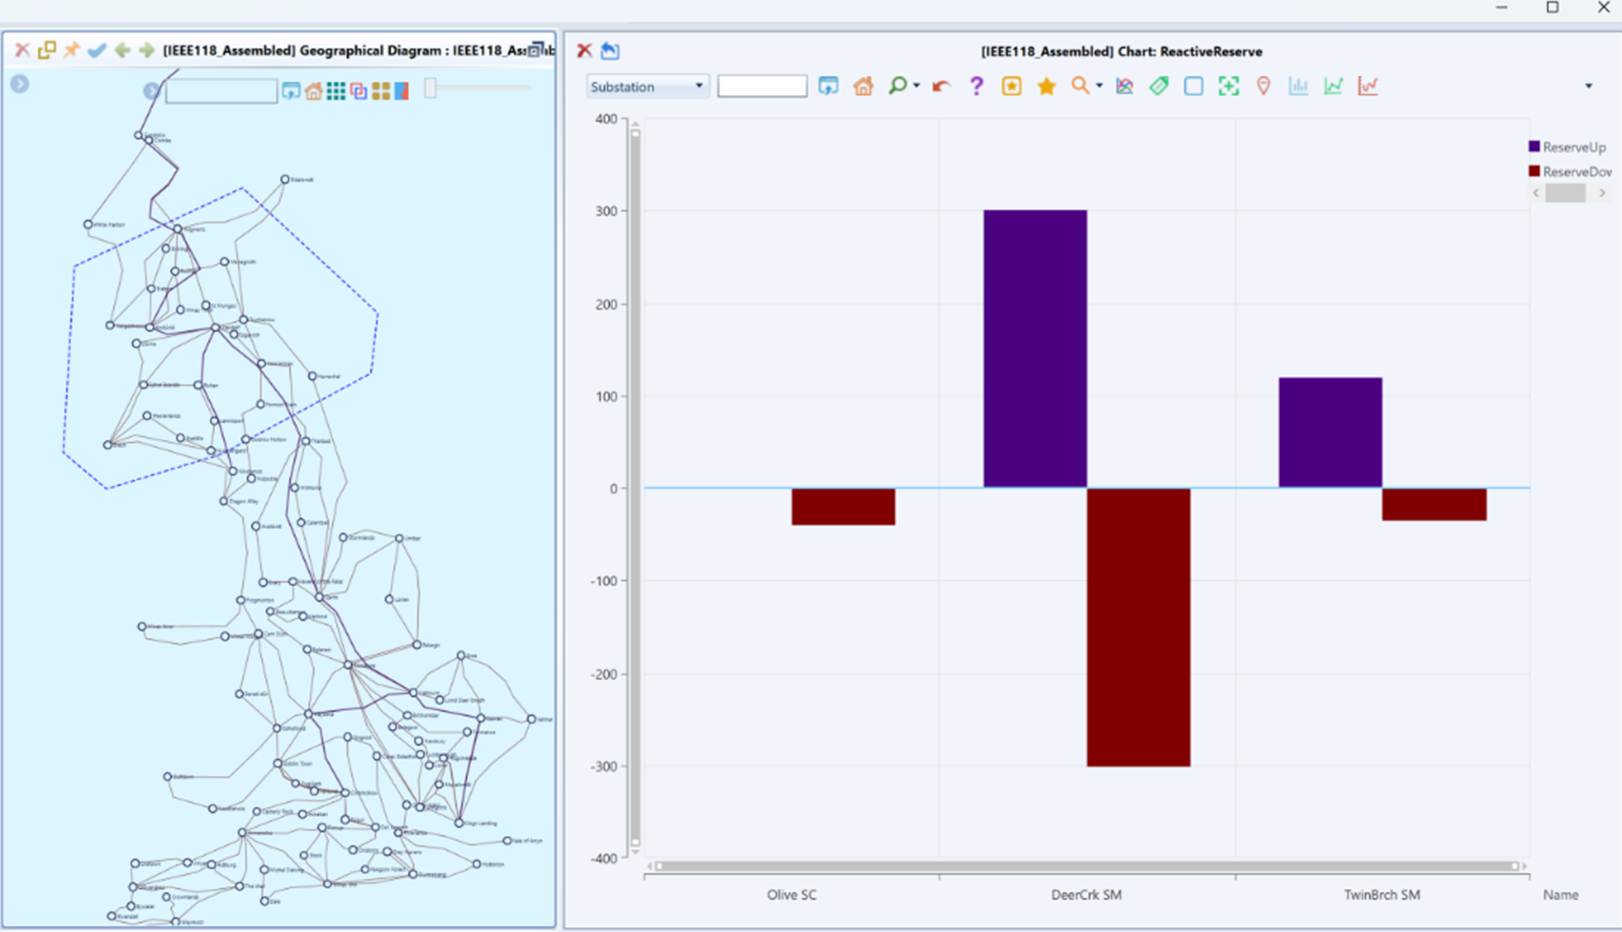
In this tutorial, we will use an example to show how a Diagram-based EDA solution can be rapidly built with the infrastructural support of the Tool. This example is designed to allow users to graphically select an area in a line-station diagram, such as Geographical Diagrams and Neighborhood Diagrams, and generate reports or charts to analyze generation (MW) and reactive (MVAr) reserve. This is a real-world use case that is particularly useful for power flow tuning, helping engineers analyze and optimize MW and MVAr reserves within a selected area of the network.
Hands-On Lab
- Objective: To understand how to show the generation and reactive reserve on the selected area using test model.
- Test Model: IEEE-118 CIM16 model.
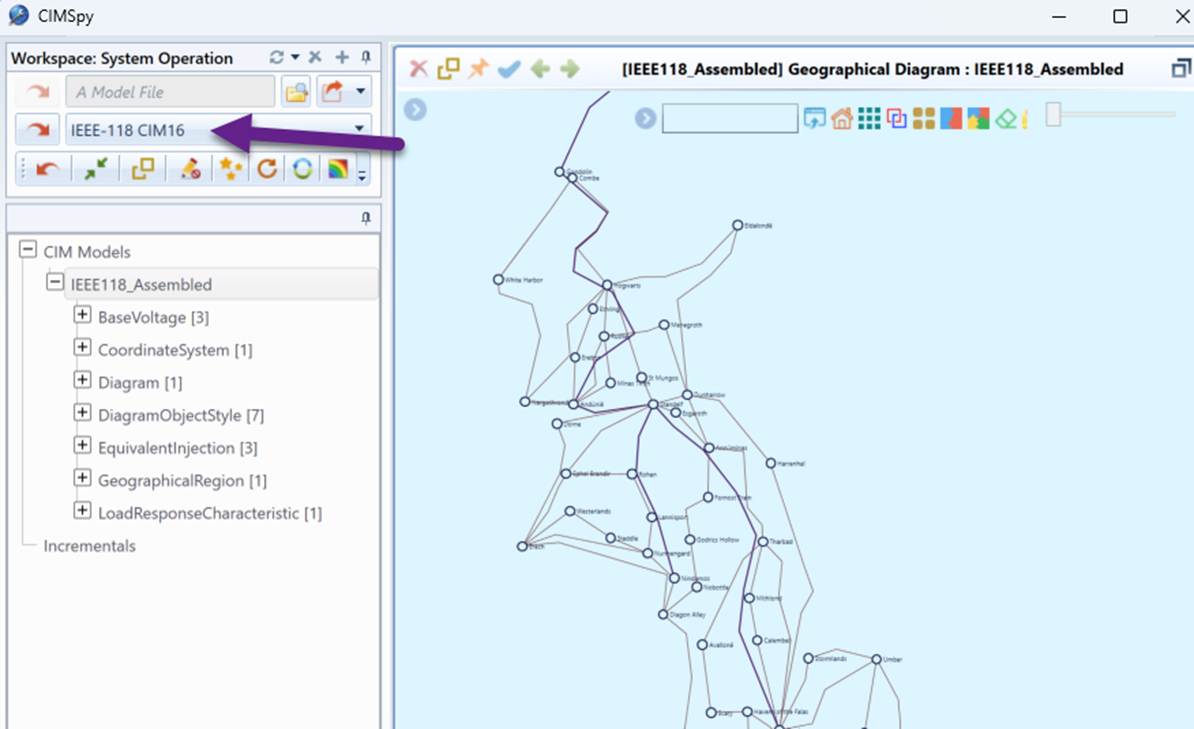
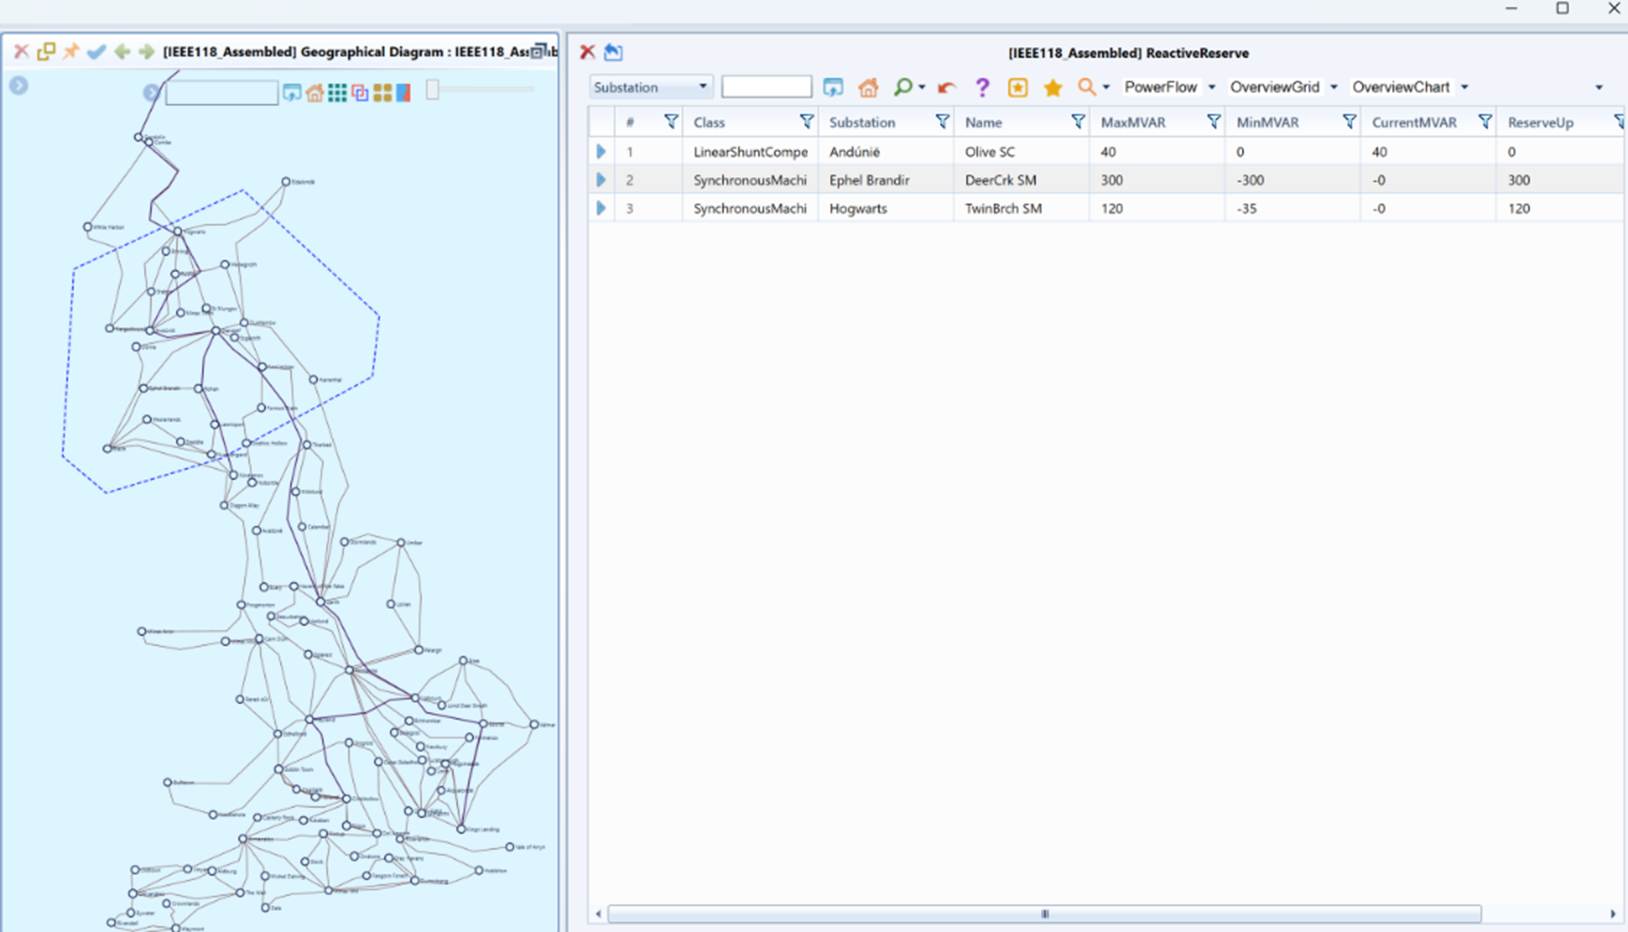
- Load “IEEE-118 CIM16 model” from data source dropdown list and bring the System Geographical Diagram, as illustrated.
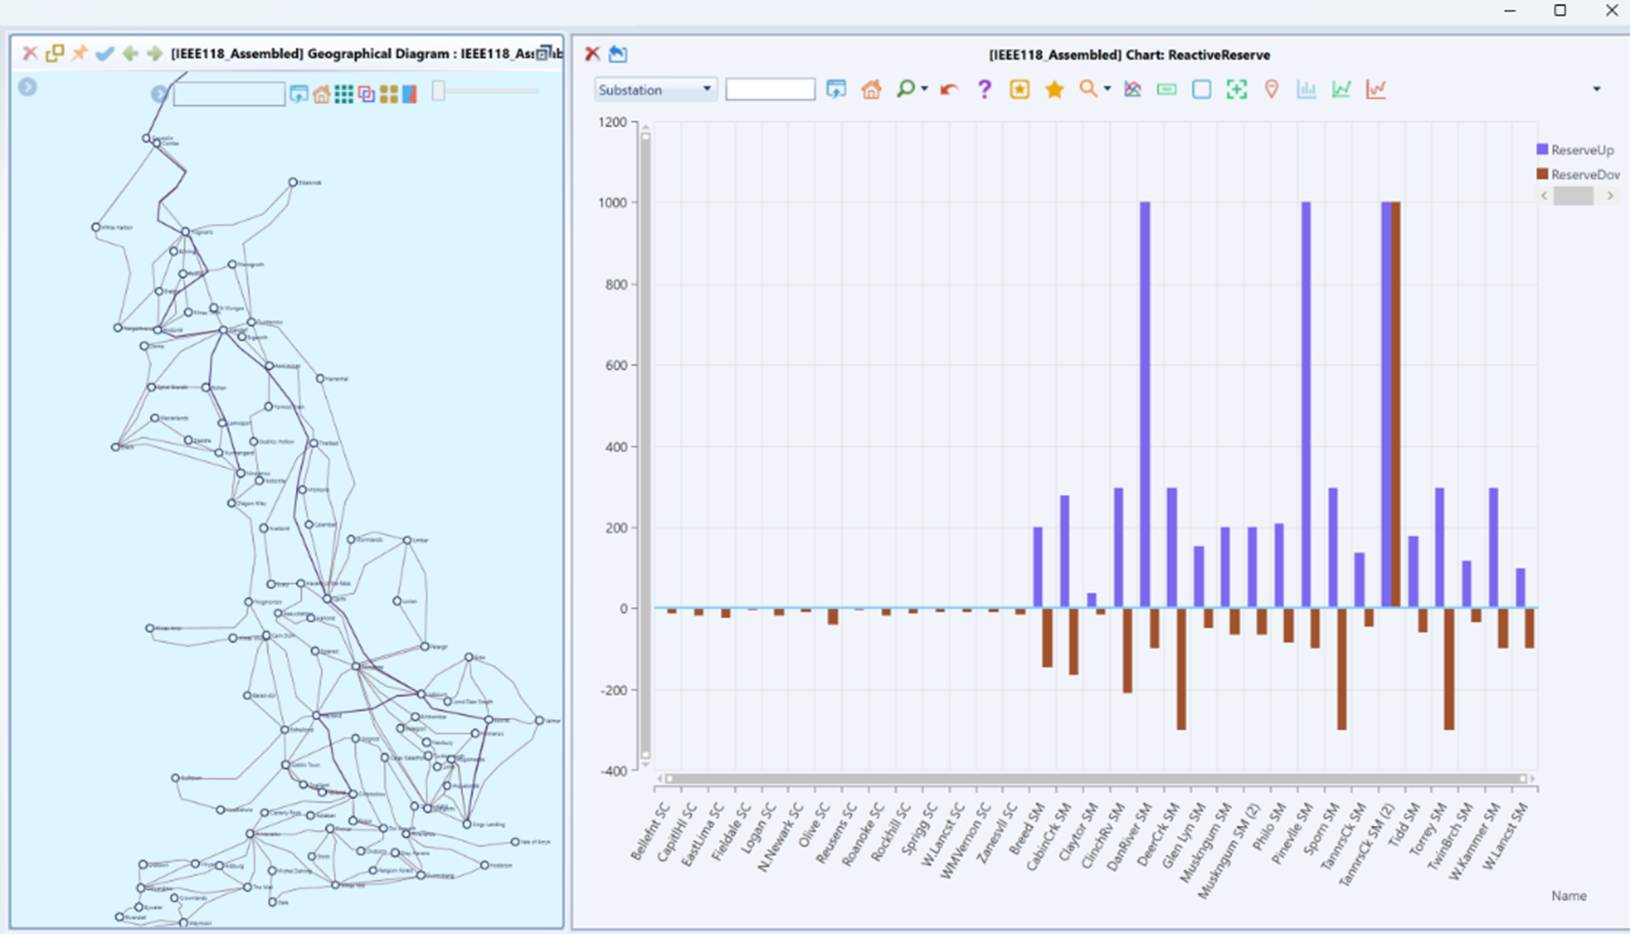
- Select an area from the Geographical Diagram. If no area is selected, the current viewport area will be the default area. Please refer to Multi Station Diagram on different ways of selecting an area.
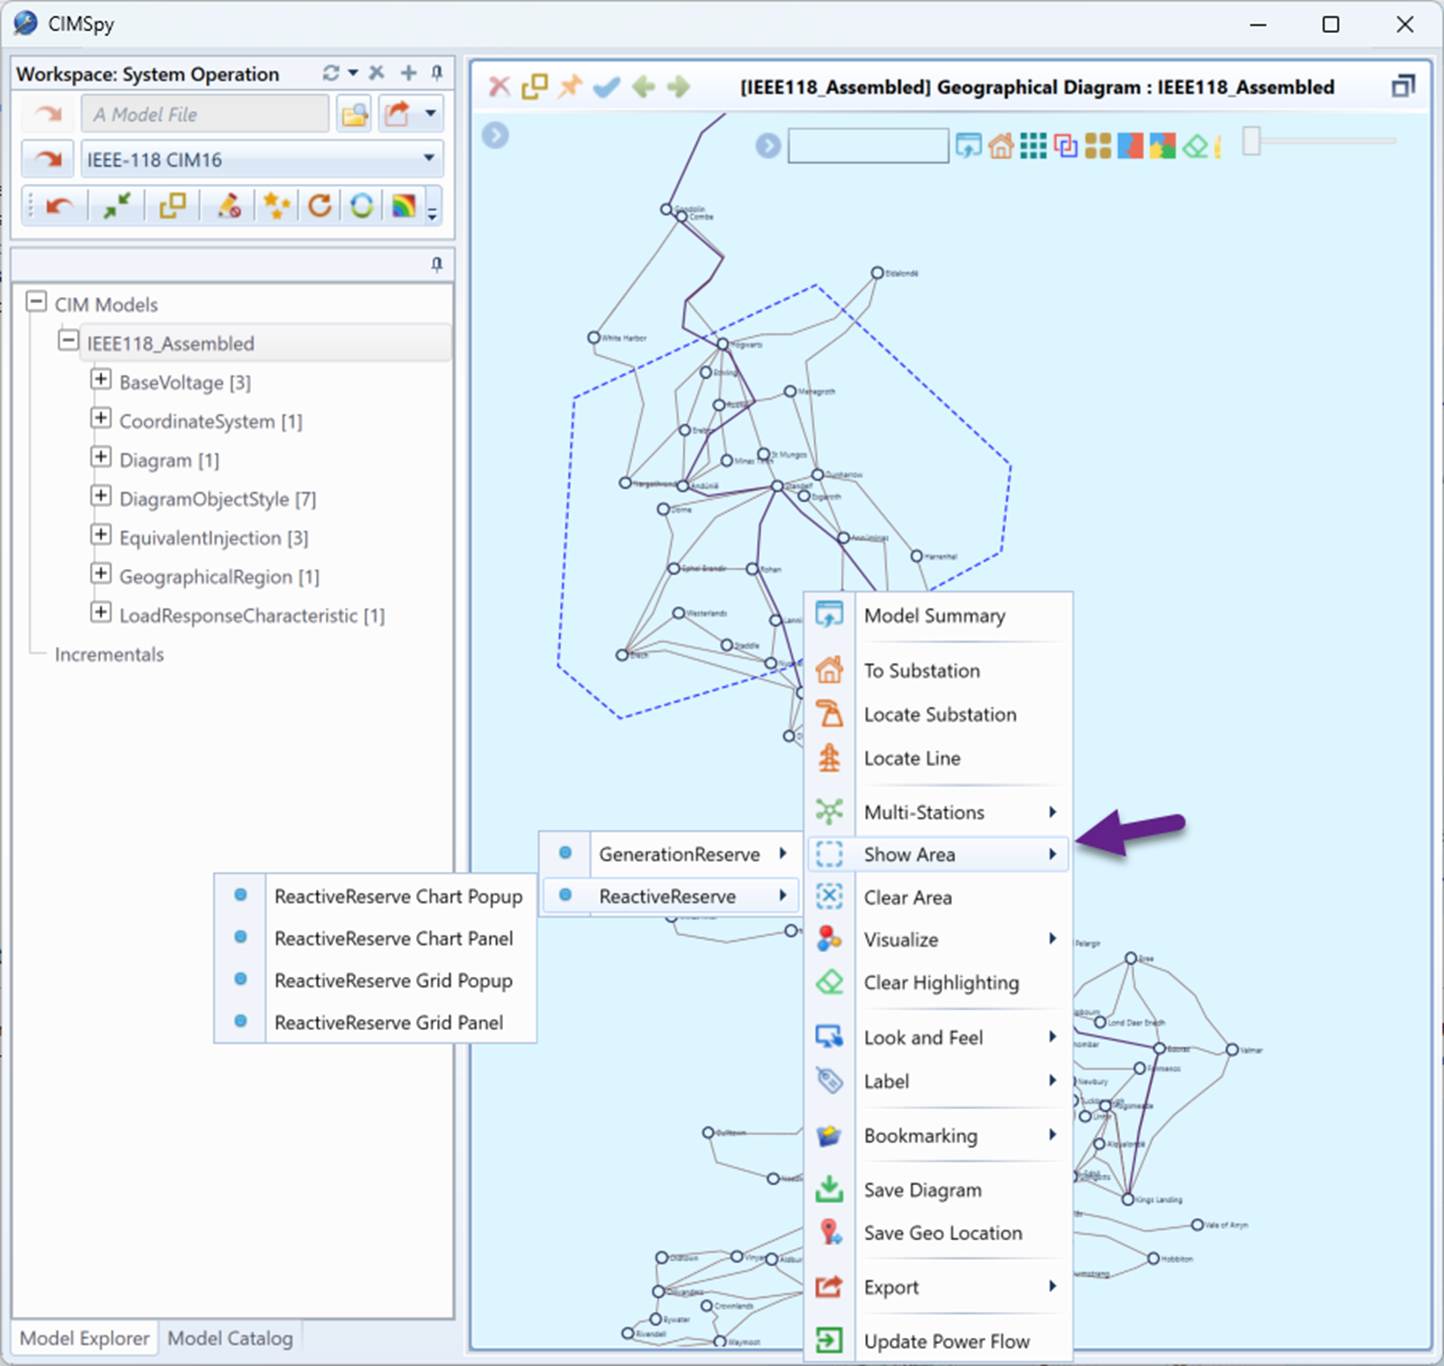
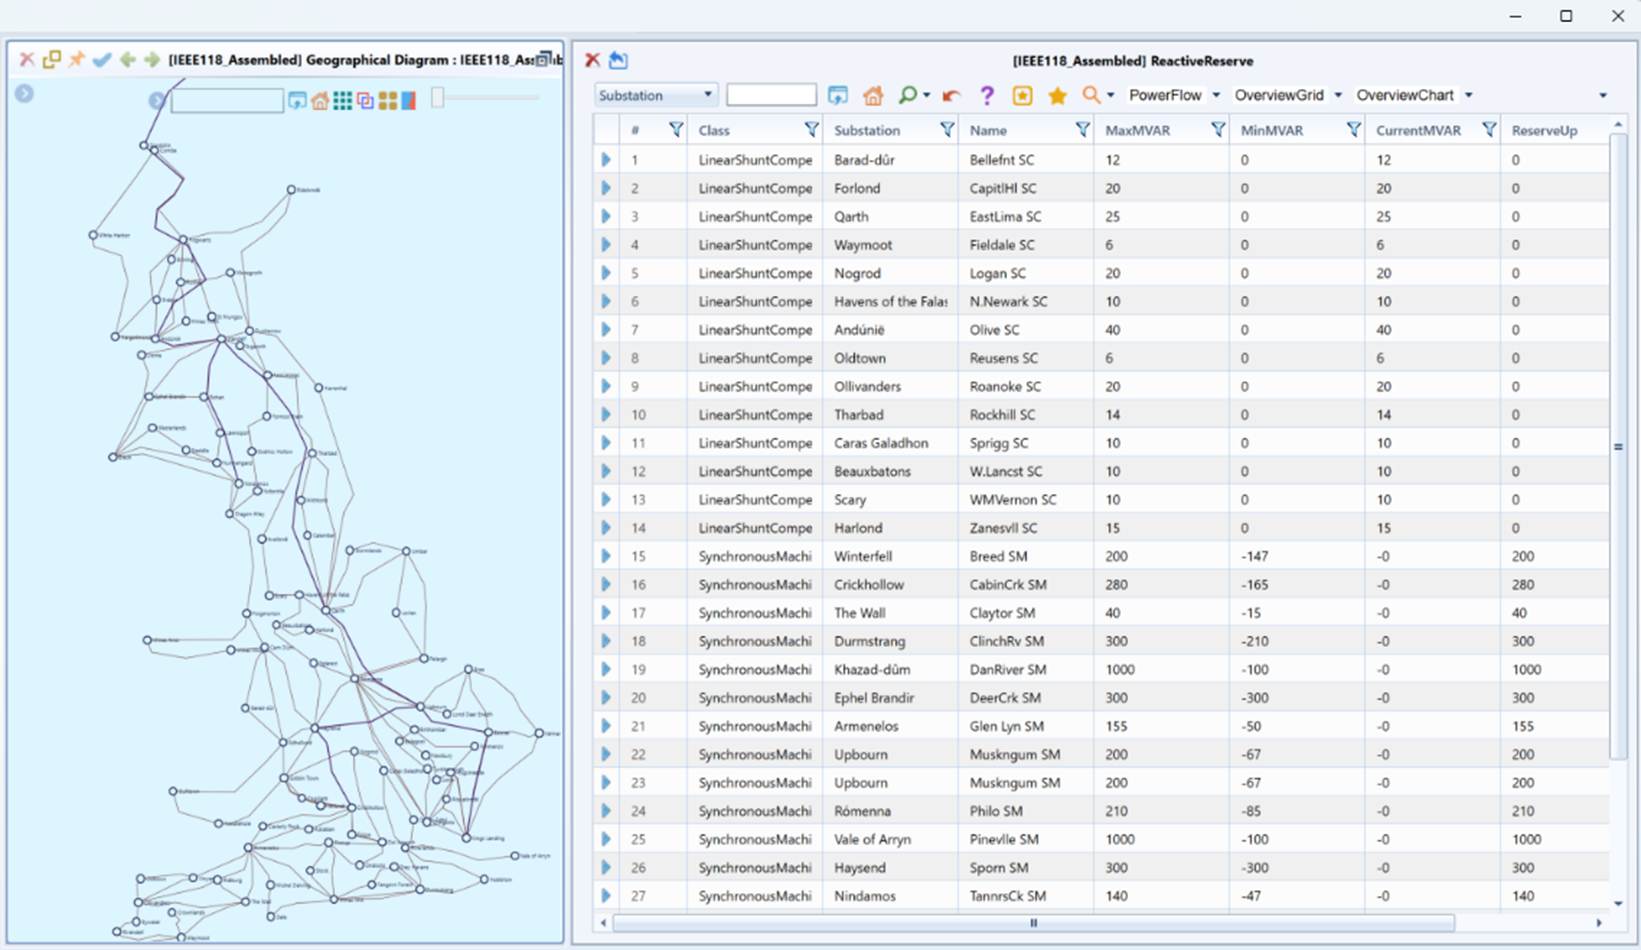
- Follow the context menu above to show the Generation Reserve and Reactive Reserve information in a Side Panel or Popup, in the format of Tabular Report (Grid) or Bar Chart.
How to Build a Diagram-based EDA Solution?
The above example can be rapidly built through meta-data definition, allowing for a flexible and efficient implementation. Similar Diagram-based EDA solutions can also be developed using the same approach. For example, users can display various other types of information, such as voltage, generation, and load, directly from the diagram by applying the same method outlined above with the following customizations:
- A new configuration file “SystemOverview.xml” is introduced under “\CIMSpy\config\view” folder. Customize this configuration file to include the Overview Data Groups and the associated data.
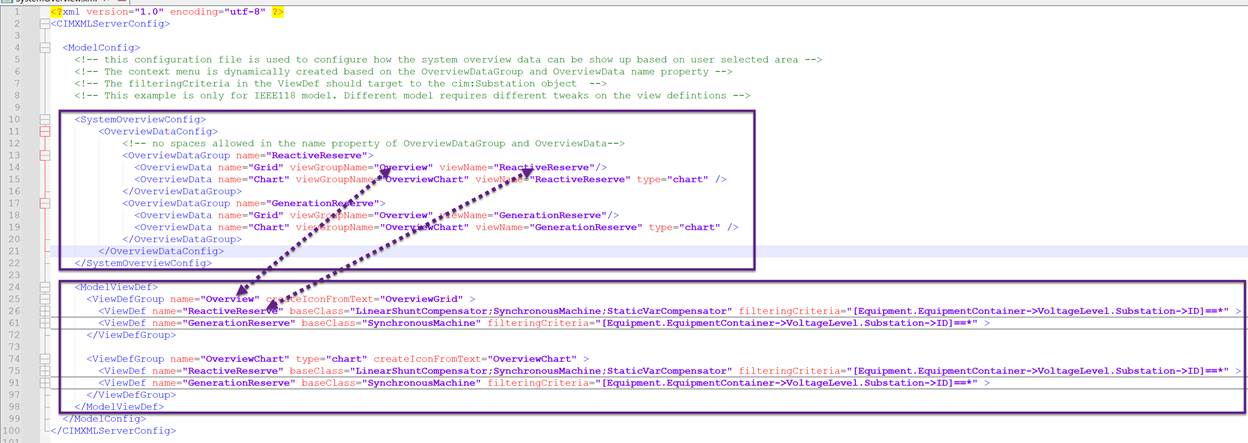
- OverviewDataGroup: Defines a group of overview data, such as reactive power or generation reserve. Each OverviewDataGroup is dynamically created as a sub-menu in the context menu, as shown below:
- name: The name property (spaces are not allowed).
- OverviewData: Defines the data associated with a view. Each OverviewData has the following properties:
- name: The name property (spaces are not allowed).
- viewGroupName: The name of the ViewDefGroup, which is customized below.
- viewName: The name of the ViewDef, which is customized below.
- type: The type of data presentation. Only chart or grid are supported. By default, is grid.
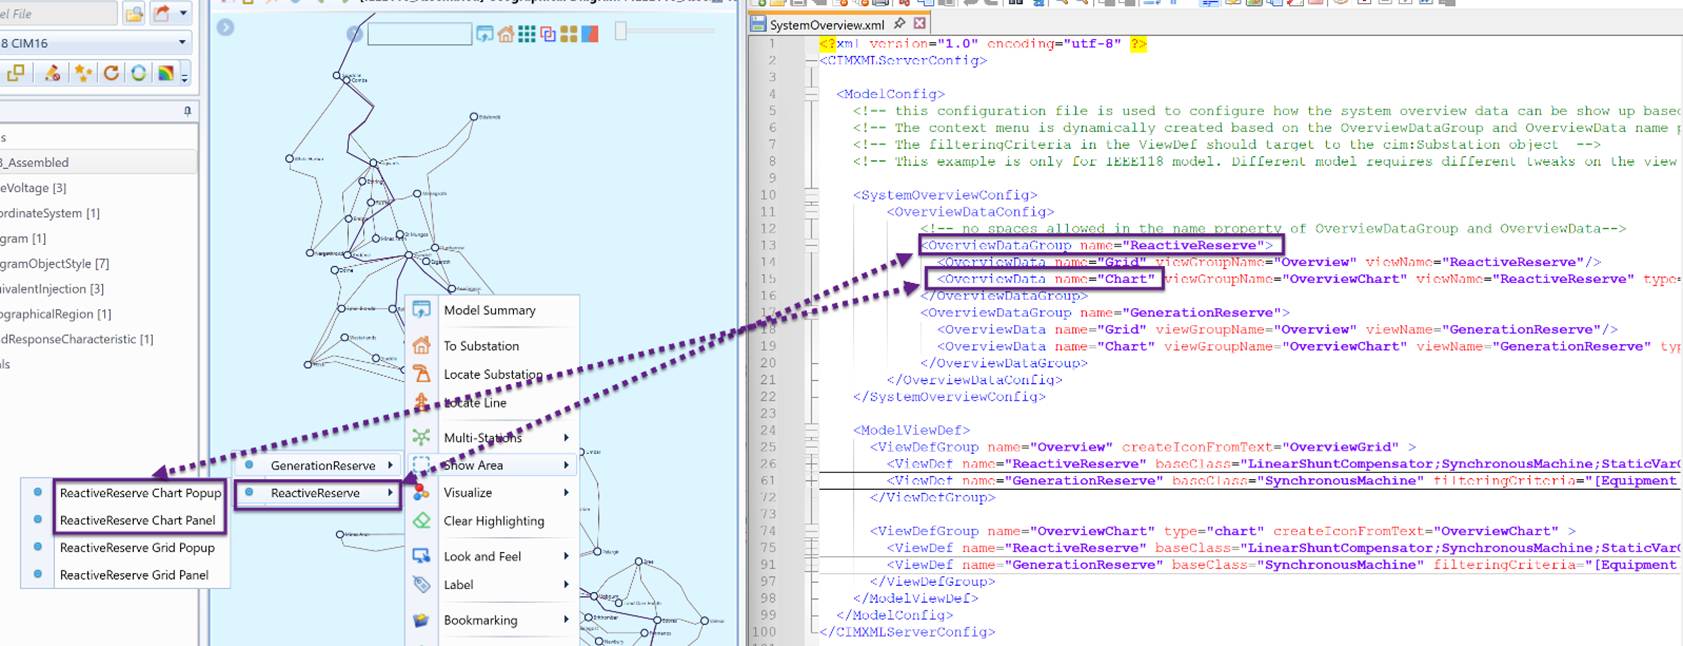
- Build customized ViewDefGroup and ViewDef to create the view for visualization.
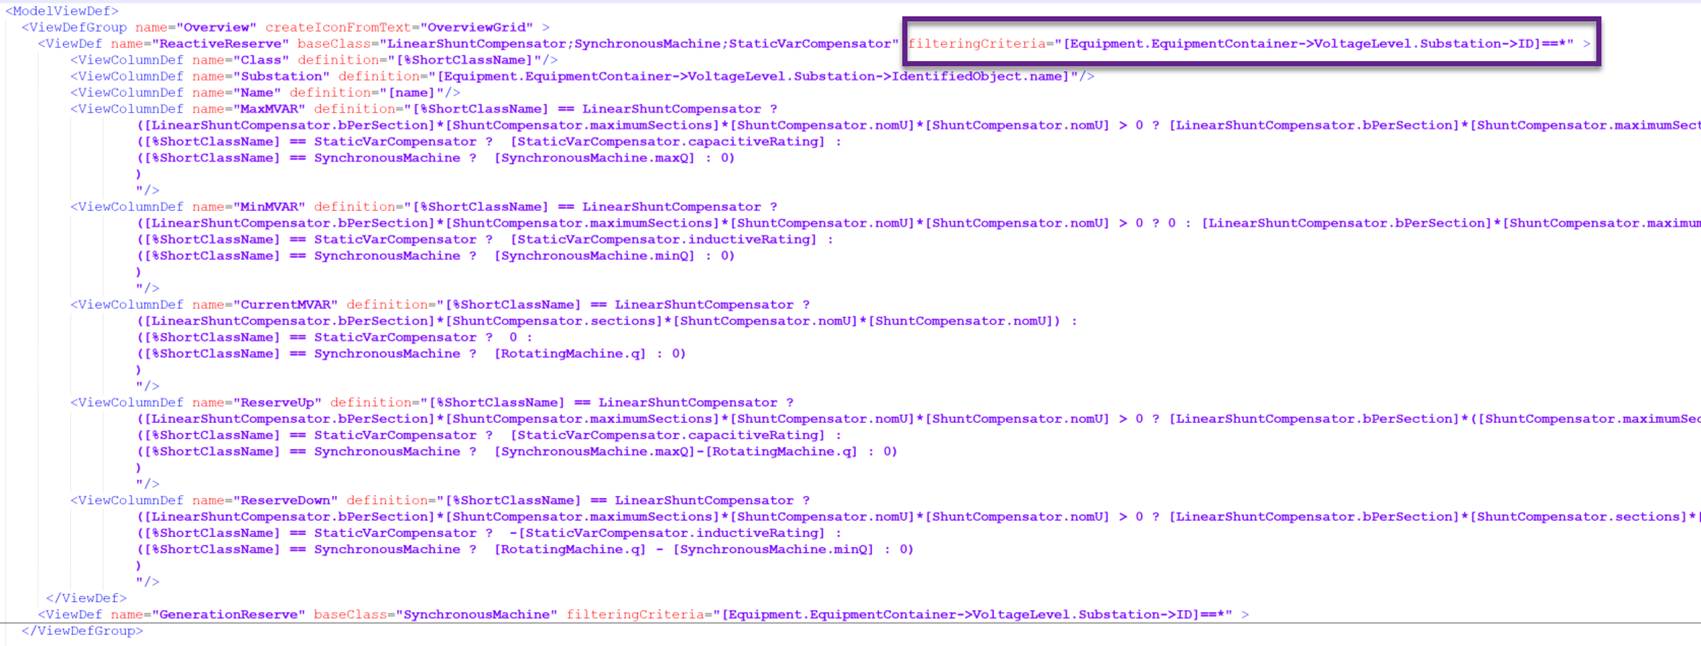
Note that the filteringCriteria in the ViewDef should filter at the cim:Substation class level. Use “*” as the wildcard to include all stations by default. Dynamic filtering will then be applied at runtime based on the stations within the user-selected area.
- Include the ViewDefGroup defined above in the CustomConfig.xml or any particular workspace configuration if workspaces are defined.
