Schematic Neighborhood and Geo Neighborhood Diagram
Neighborhood diagrams enable users to visualize a selected Substation and its connections to the neighboring Substations.
Understanding Schematic Neighborhood and Geo Neighborhood Diagram
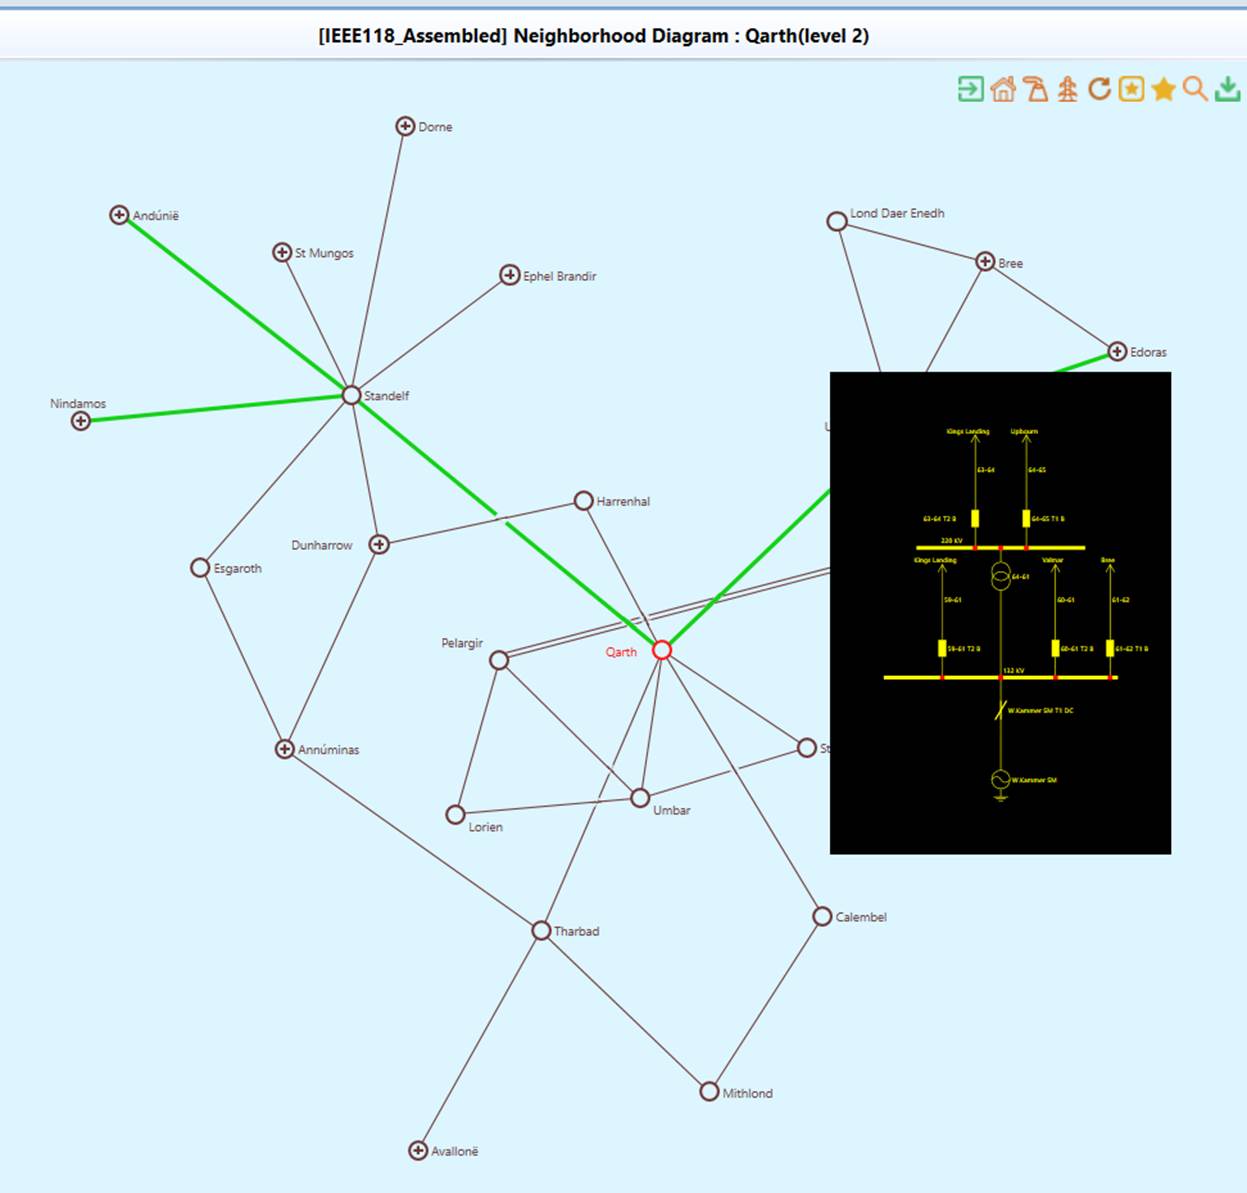
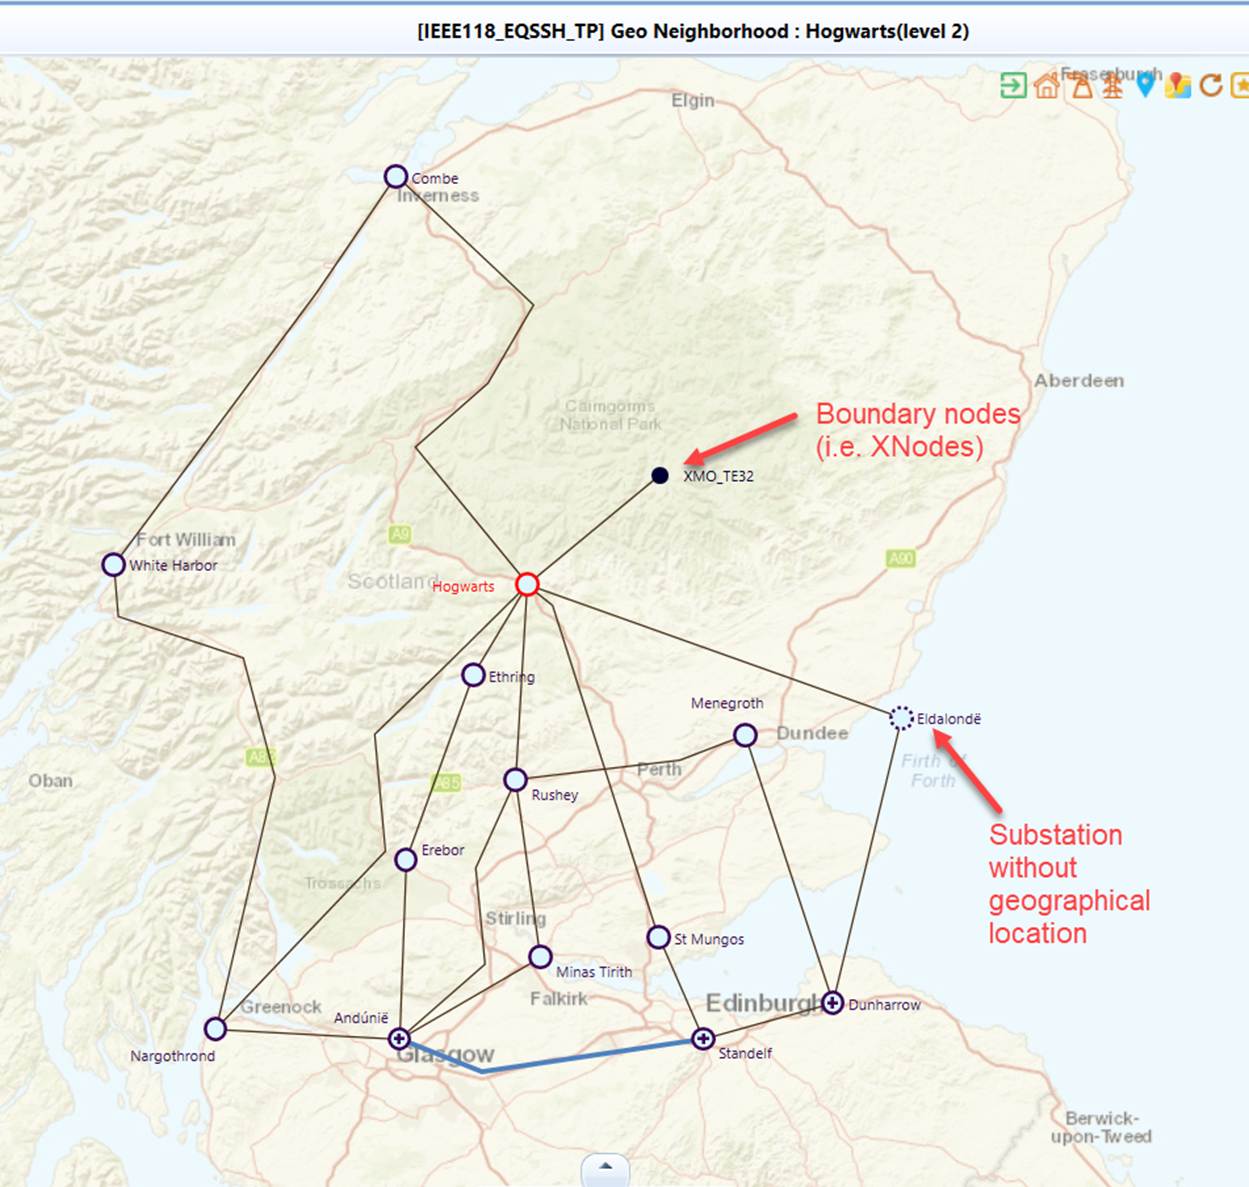
The Neighborhood Diagram was designed to support the model exploration at a Substation level. The diagram creation is user-driven. Users can specify the scope of the neighborhood diagrams, such as “displaying all of the neighboring stations that are two branches away”. The Tool allows users to display the surroundings of a selected Substation up to 4 levels. The following screenshot illustrates a level-2 neighborhood diagram. All of the neighboring substations within 2-branch distance are displayed along with the branch equipments connecting them. The selected substation, i.e. the starting point, is highlighted in red. Users can peek the detailed diagram of a Substation/ACLineSegment by moving the mouse over (mouse-over) the graphical symbol representing the selected Substation/ACLineSegment.
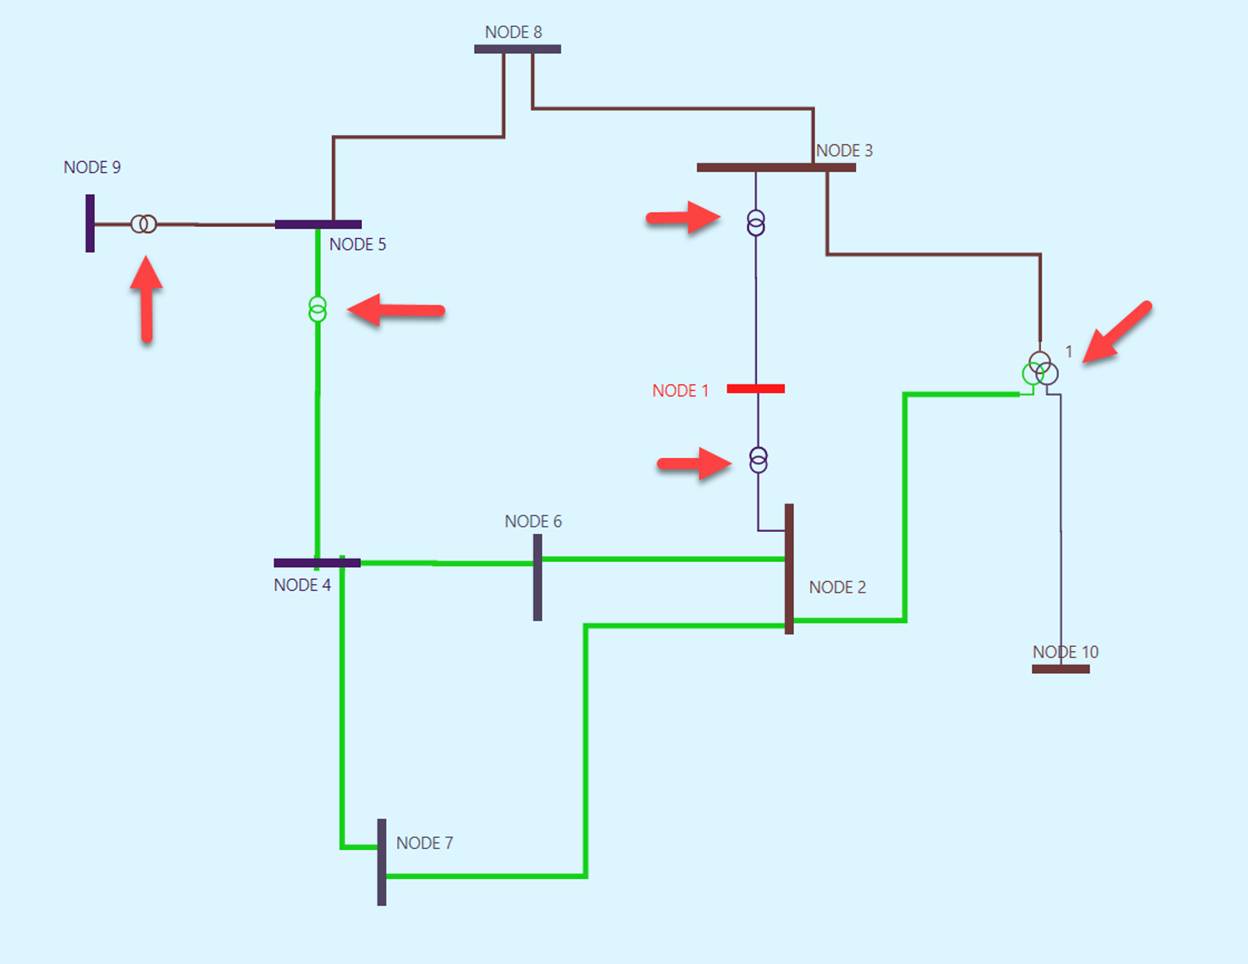
In the neighborhood diagram, the connections among neighboring substations are mainly transmission lines. But in some planning models, the connections could be also other type of branch equipments, such as switches or transformers. The following screenshot illustrates such a planning model, where two-winding and three-winding transformers are used to connect substations.
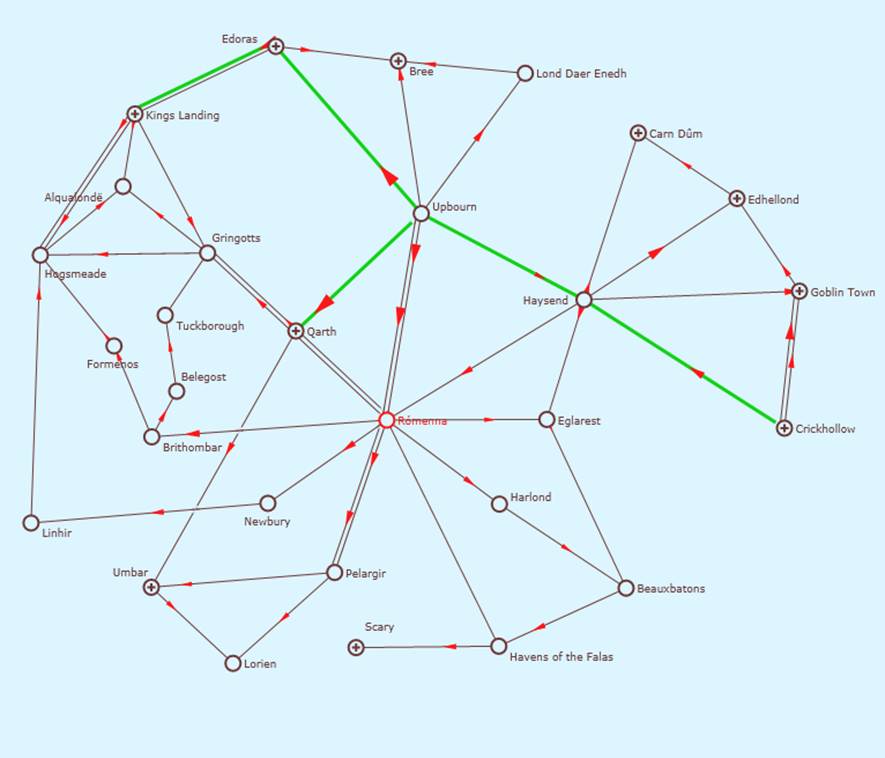
Schematic Neighborhood Diagram layout is auto generated through algorithm. Geo Neighborhood Diagram, on the hand, has substations positioned according to their geographic locations. The following shows a Schematic Neighborhood Diagram and its corresponding Geo Neighborhood Diagram.
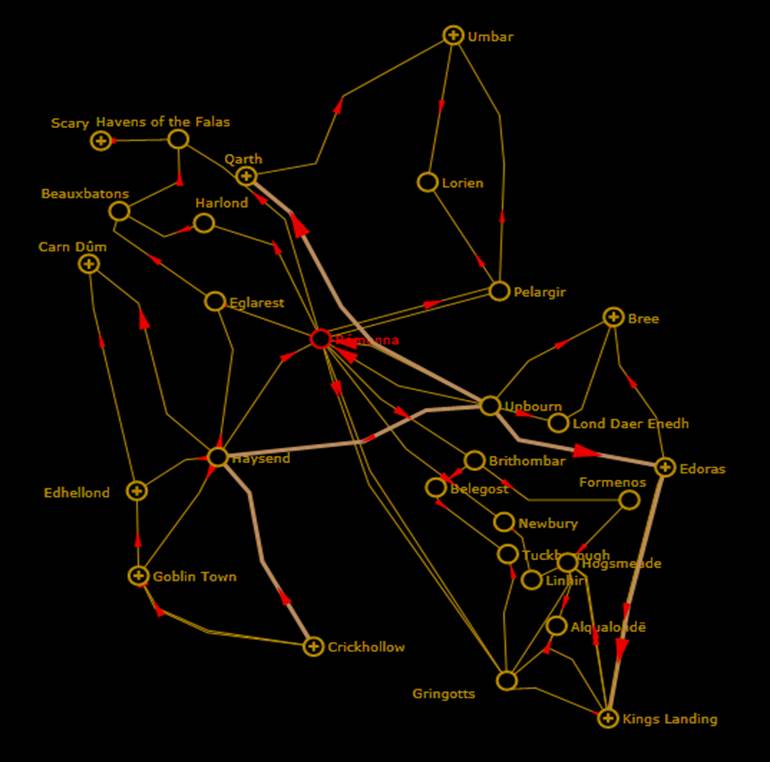
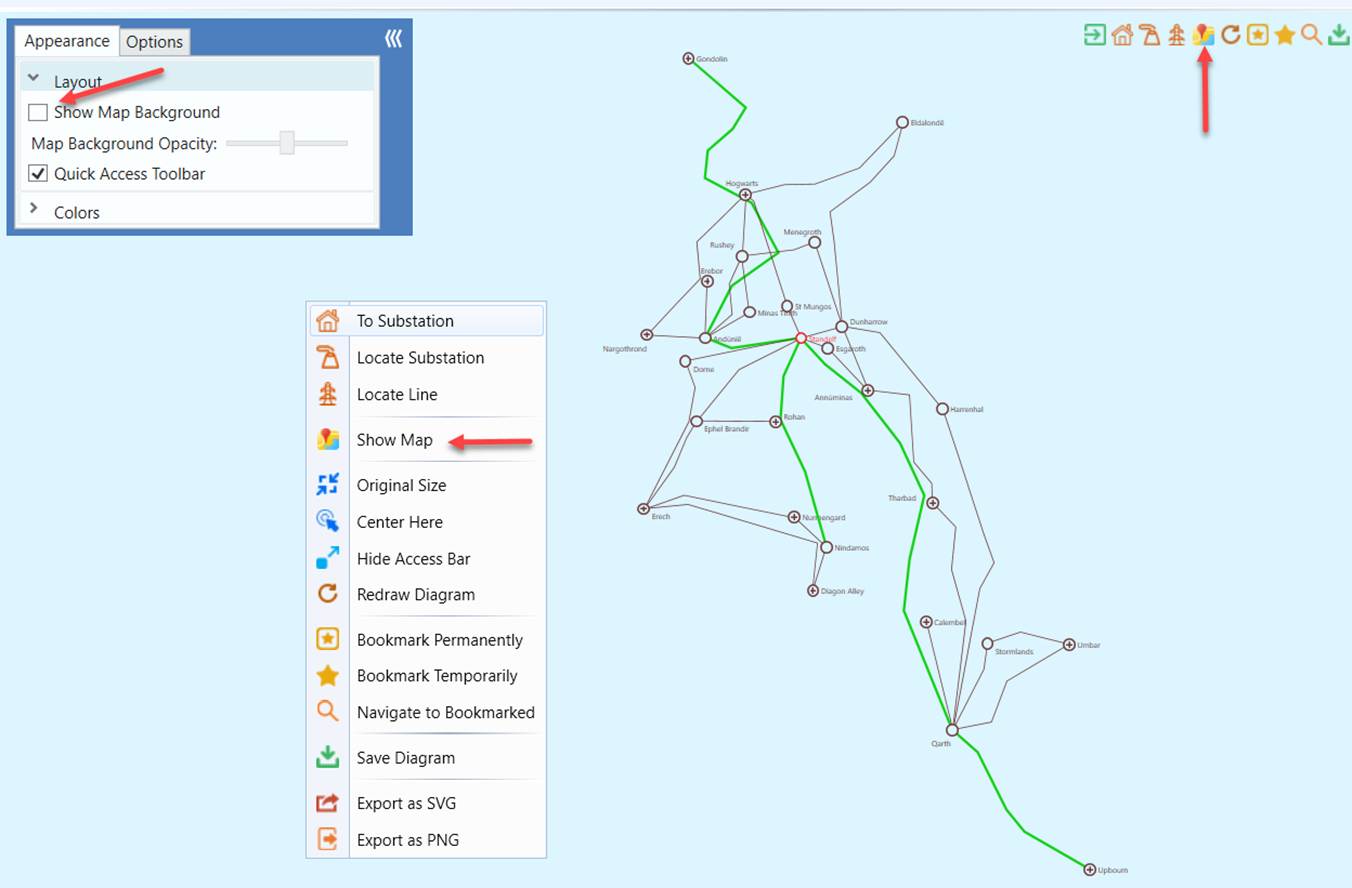
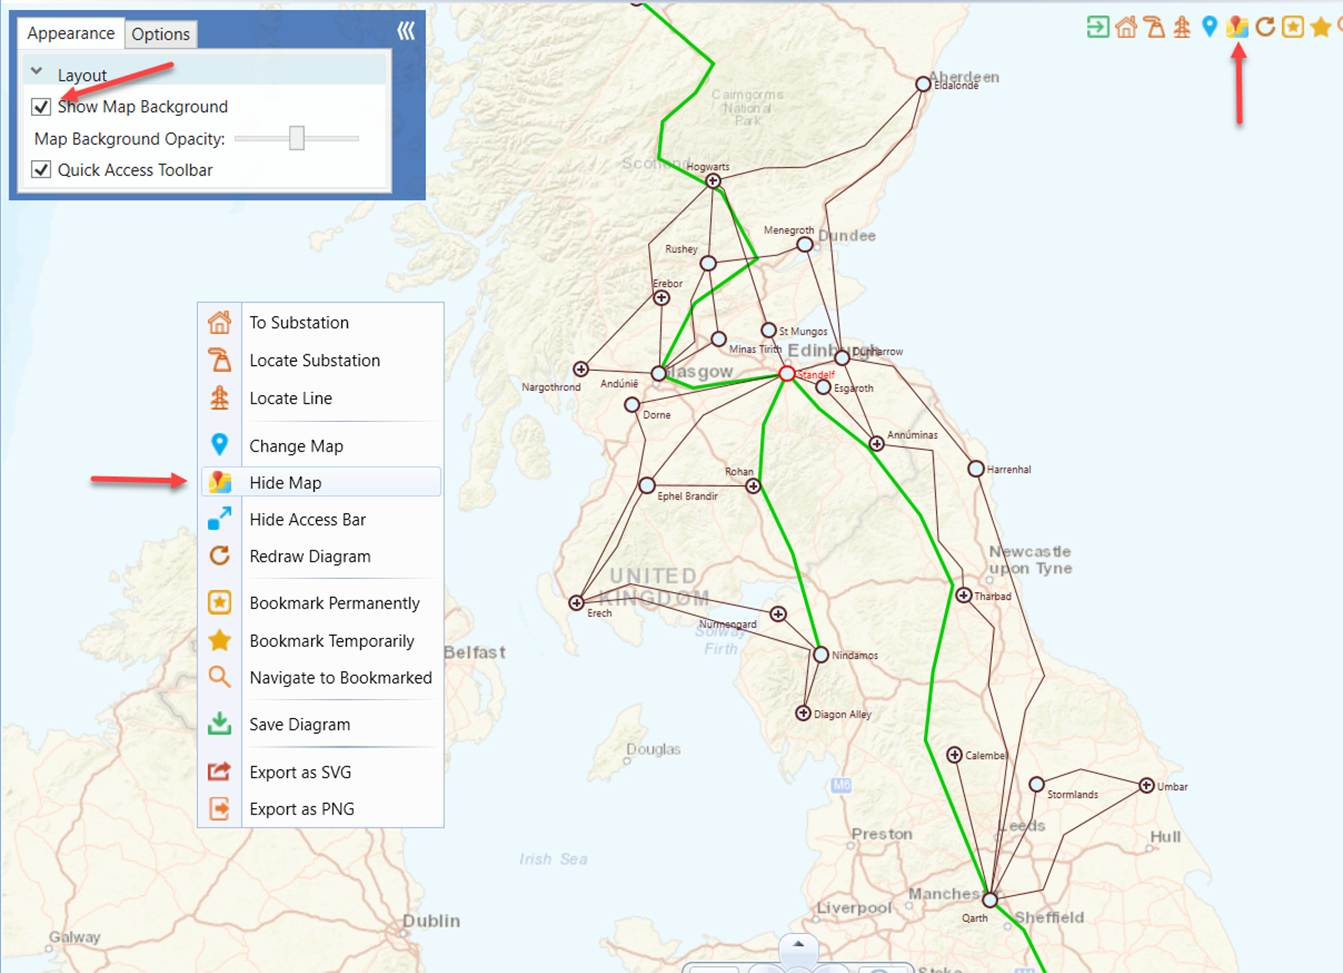
In a geographically enabled model, if geographic locations are provided to the substations, it is possible to render the neighborhood diagram according to their geographic locations. This diagram is called the Geo Neighborhood diagram. Not all substations in the geographically enabled model have the ability to call a Geo Neighborhood diagram. If a specific substation is not provided with geographic location, users are not able to call Geo Neighborhood diagram from it. Instead, only a Neighborhood diagram can be called. Substations without geographic location will be drawn as dotted circle in Geo Neighborhood diagram. Their context menu will not have Geo Neighborhood option. Users can choose to view Geo Neighborhood diagram with or without map background by toggling User Menu option Appearance -> Layout -> Show Map Background or via the diagram context menu.
Calling a Schematic Neighborhood Diagram
There are several ways to call Schematic Neighborhood Diagrams:
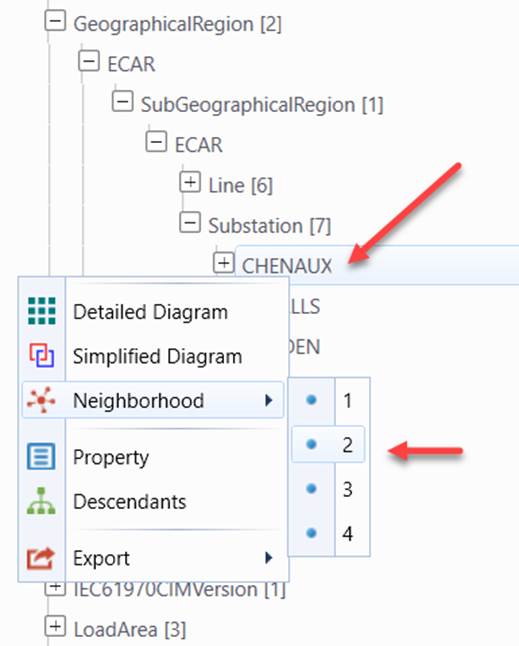
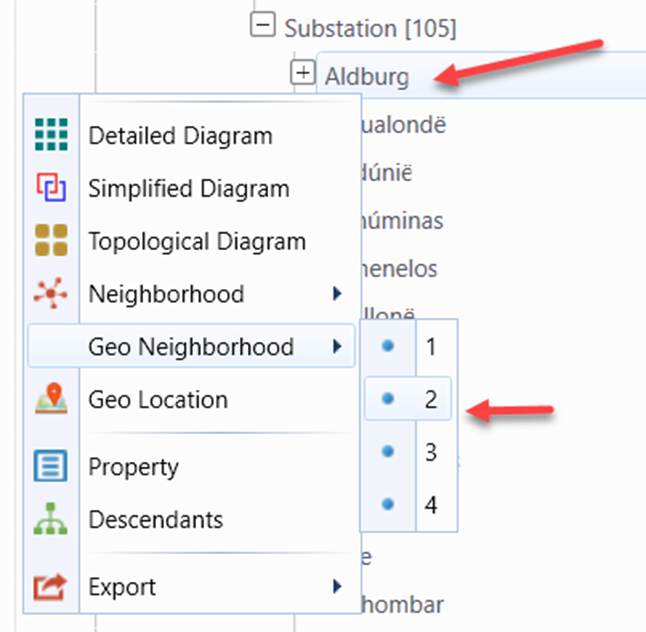
- Context menu associated with the Substation tree item in the navigation tree. If the Substation has no geographic location, users will only see Neighborhood Diagram menu.
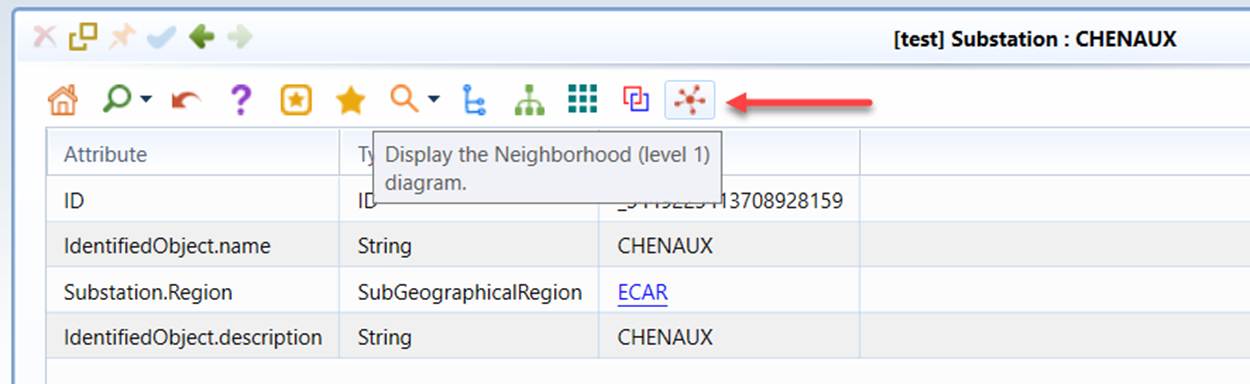
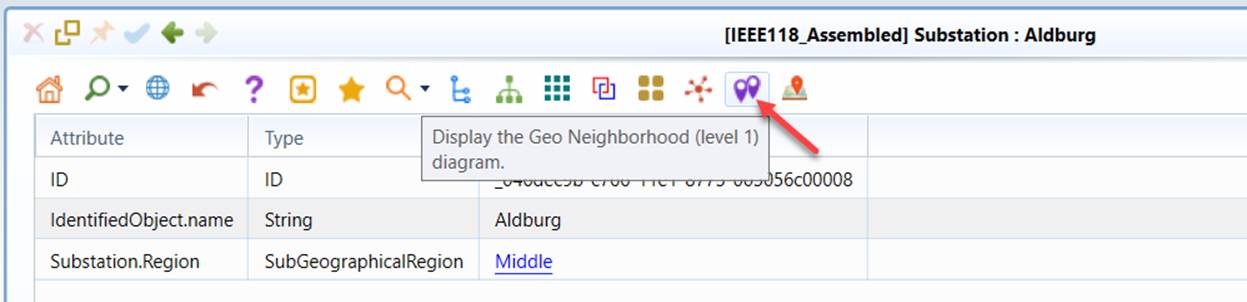
- Command Icon in the Substation Object Form.
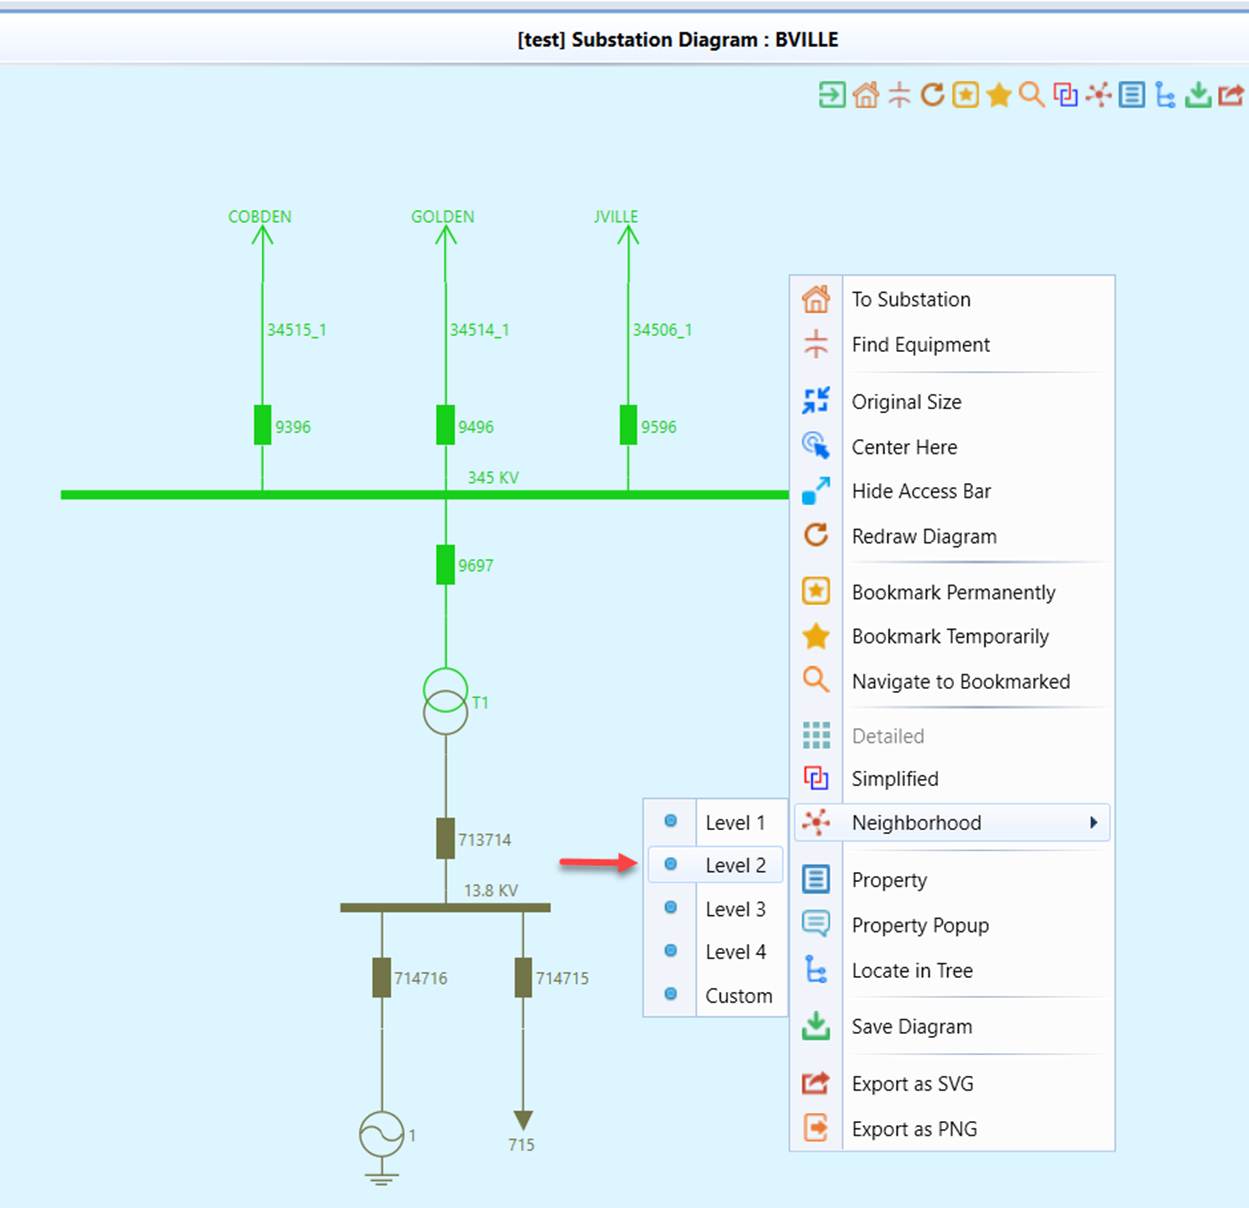
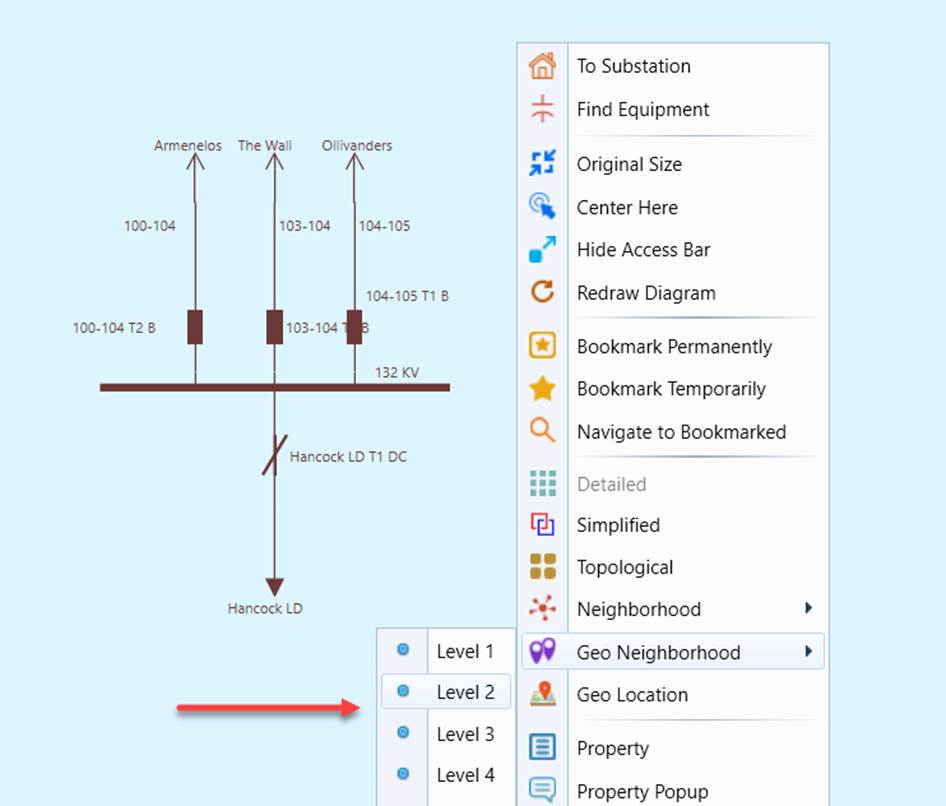
- Context menu in the Substation Diagram.
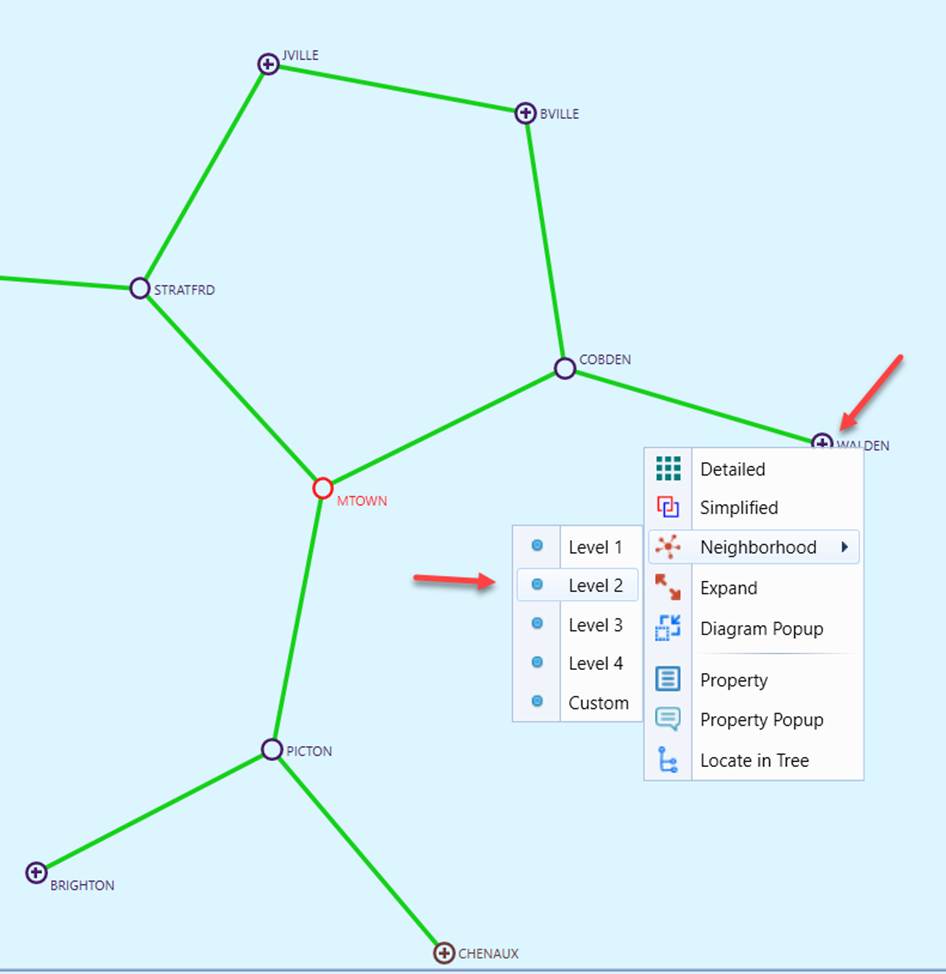
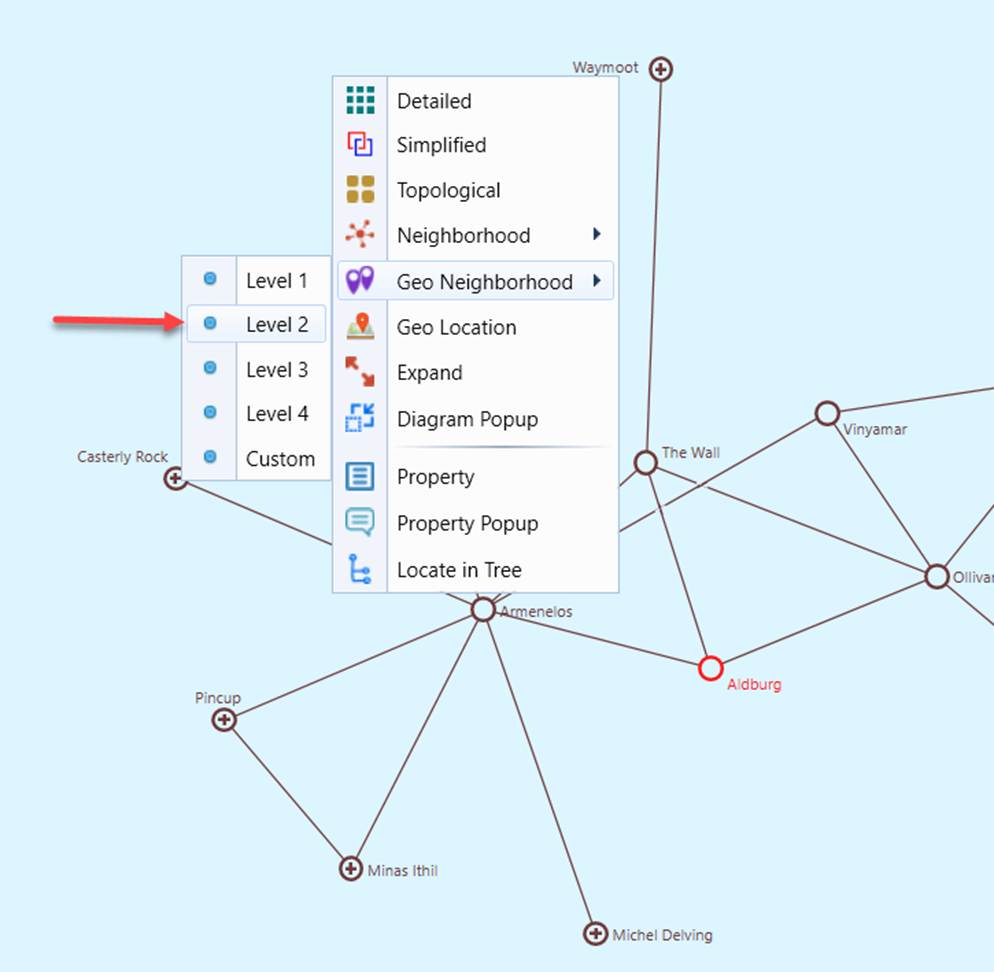
- Context menu in another Neighborhood Diagram.
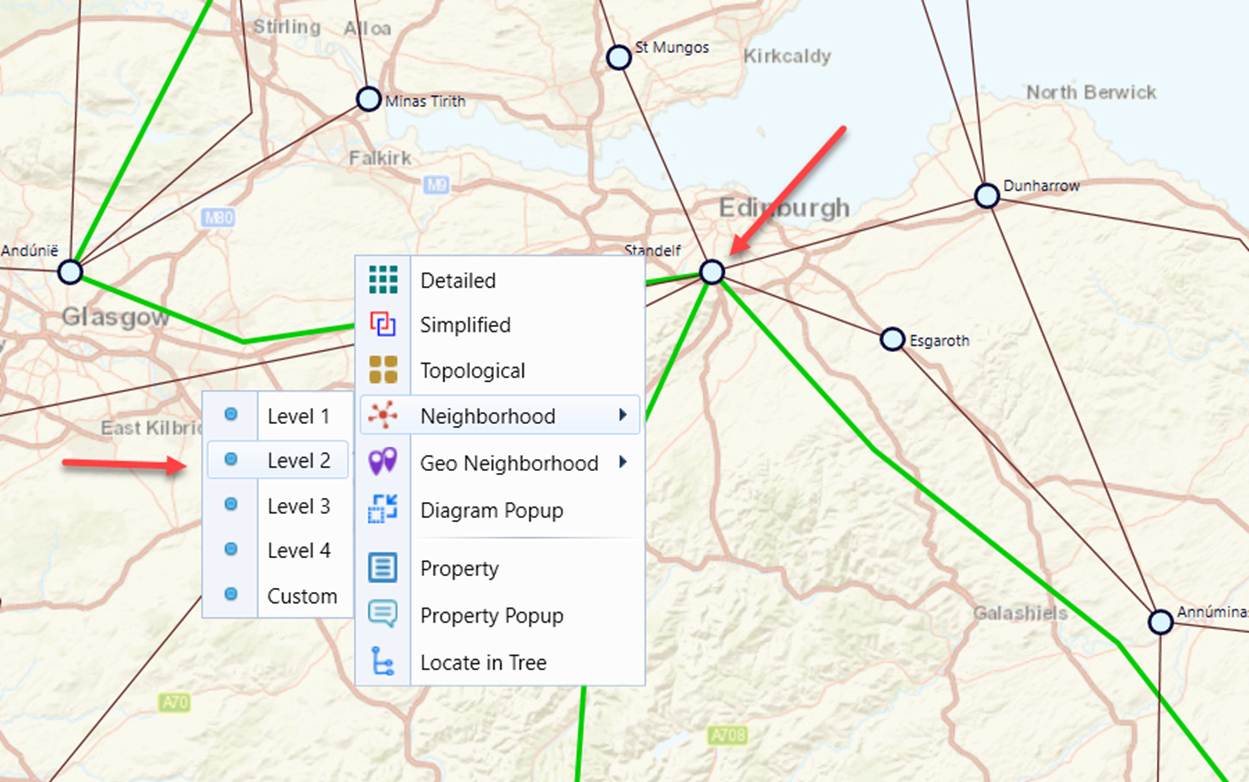
- Context menu in a Geographical Diagram.
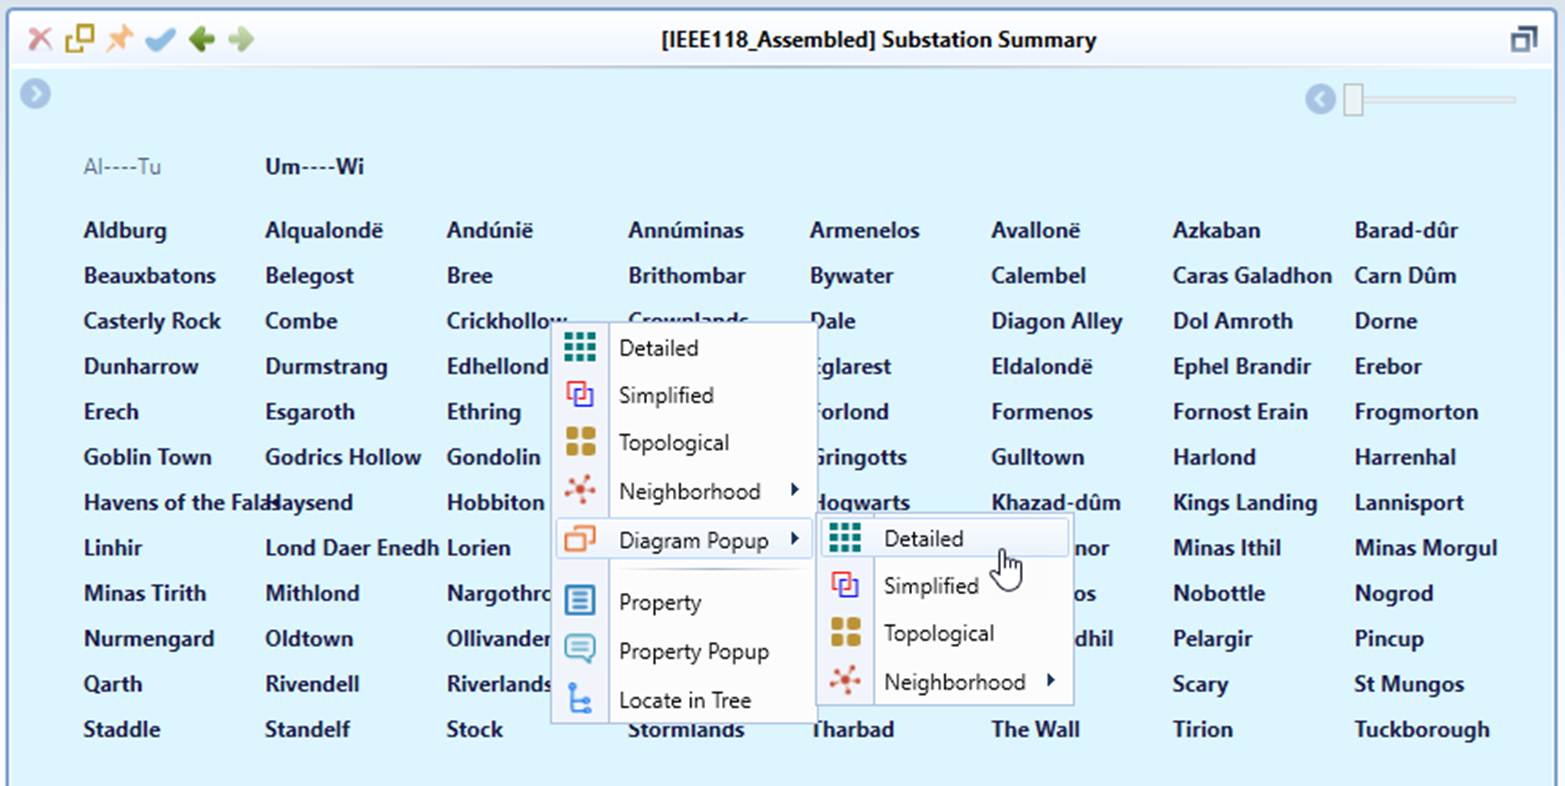
- Context menu or mouse-clicking in Diagram Summary
Calling a Geo Neighborhood Diagram
Not all substations in the geographically enabled model have the ability to call a Geo Neighborhood diagram. If a specific substation is not provided with geographic location, users are not able to call Geo Neighborhood diagram from it. Instead, only a Neighborhood diagram can be called.
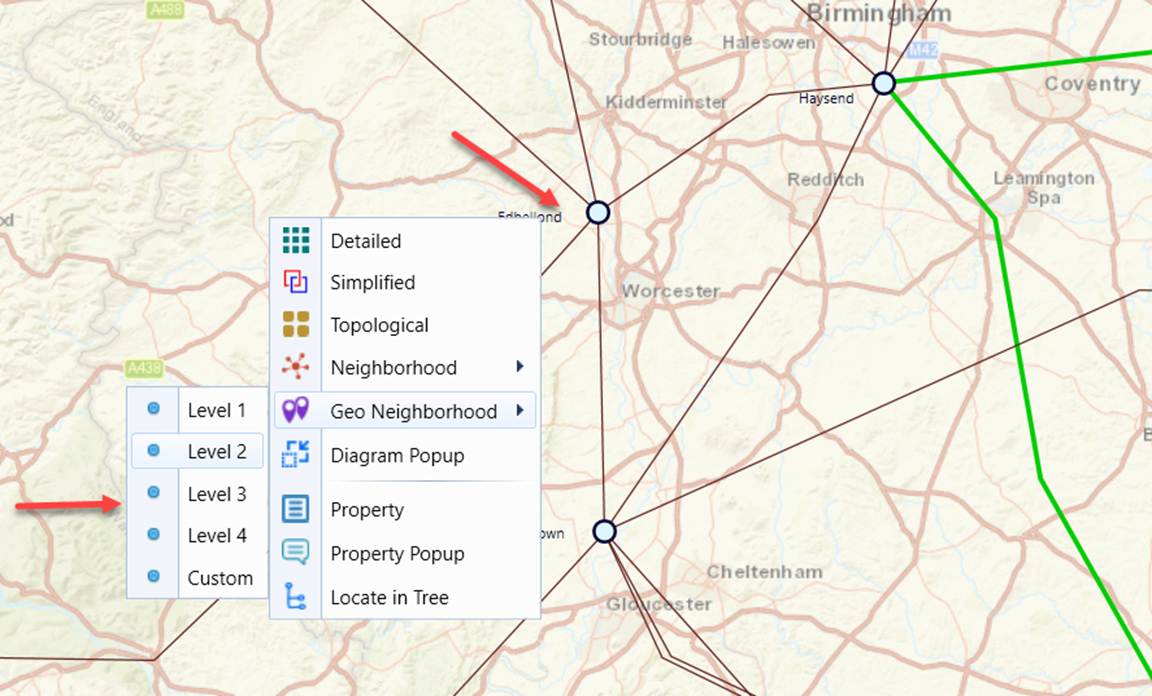
- If the Substation has geographic location, Geo Neighborhood Diagram menu will be available besides the standard Neighborhood Diagram menu.
- Command icon in the Substation Object Form. For substations with geographic location, there will be both Neighborhood Diagram and Geo Neighborhood Diagram options. Without geographic location, substations will only have Neighborhood Diagram menu.
- Context menu in the Substation Diagram. For substations with geographic location, there will be both Neighborhood Diagram and Geo Neighborhood Diagram options. Without geographic location, substations will only have Neighborhood Diagram menu.
- Context menu in another Neighborhood Diagram. For substations with geographic location, there will be both Neighborhood Diagram and Geo Neighborhood Diagram options. Without geographic location, substations will only have Neighborhood Diagram menu.
- Context menu in a Geographical Diagram. Again, for substations with geographic location, there will be both Neighborhood Diagram and Geo Neighborhood Diagram options. Without geographic location, substations will only have Neighborhood Diagram menu.
Note
The “Geo Neighborhood” navigation is data-driven. If Substations/ACLineSegments have no geo locations associated in the model, the “Geo Neighborhood” context menu items or hyperlinks will not be available for these Substations/ACLineSegments.
Calling a Shortest-Path Diagram
The Shortest Path feature allows users to identify and visualize the shortest connectivity path between two selected substations in both schematic and geographical diagrams. The calculated path is shown or highlighted directly in the diagram, enabling quick analysis of network connectivity and topology relationships. The Shortest Path feature helps users quickly analyze electrical connectivity between two substations by identifying the minimum network path between them. By visualizing the shortest path directly in schematic or geographical diagrams, users can more easily interpret network relationships and make informed operational or planning decisions.
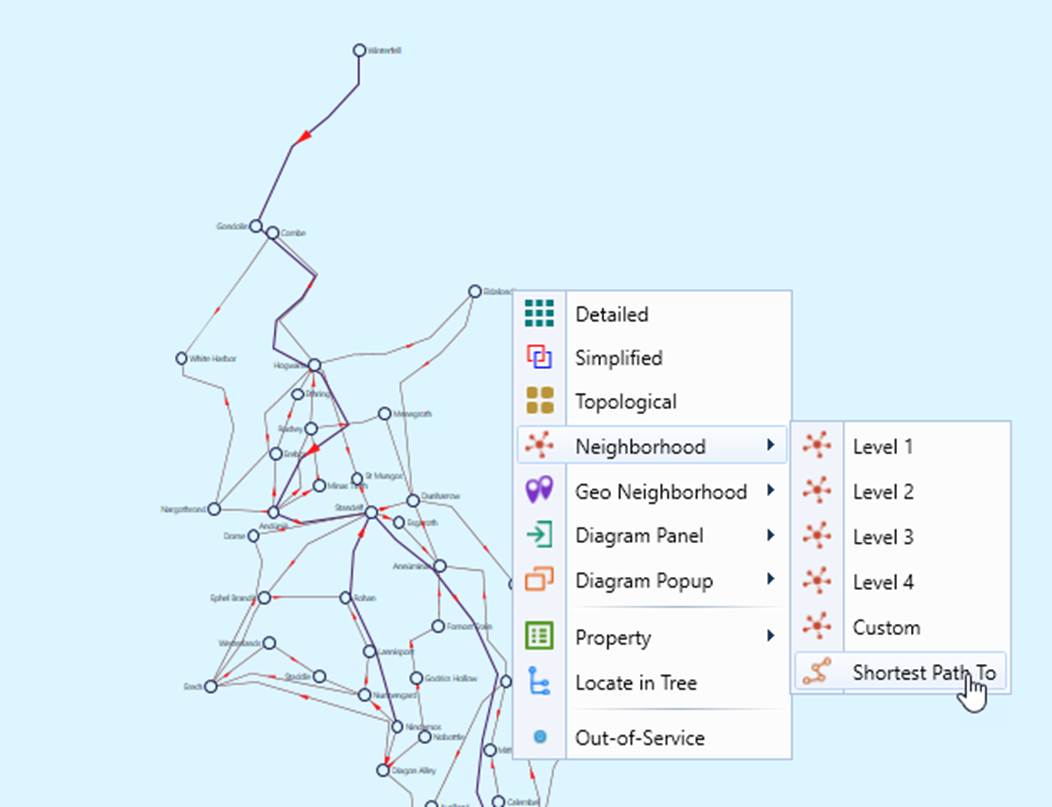
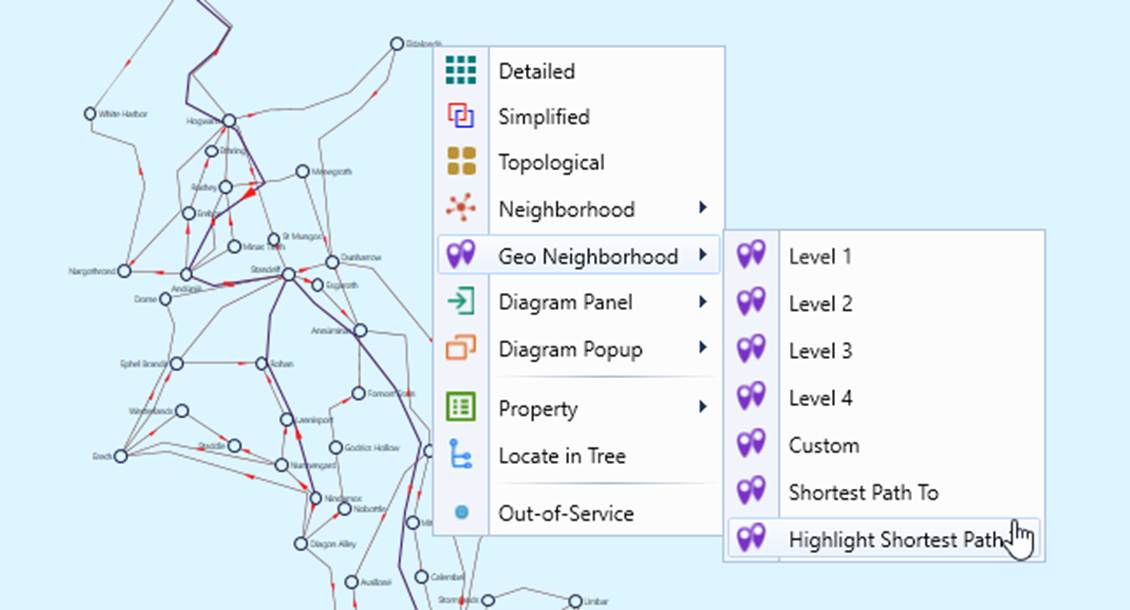
The Shortest Path diagram is treated as a special type of Neighborhood Diagram. It can be invoked from the diagram context menu, similar to other Neighborhood Diagram types, as illustrated below.
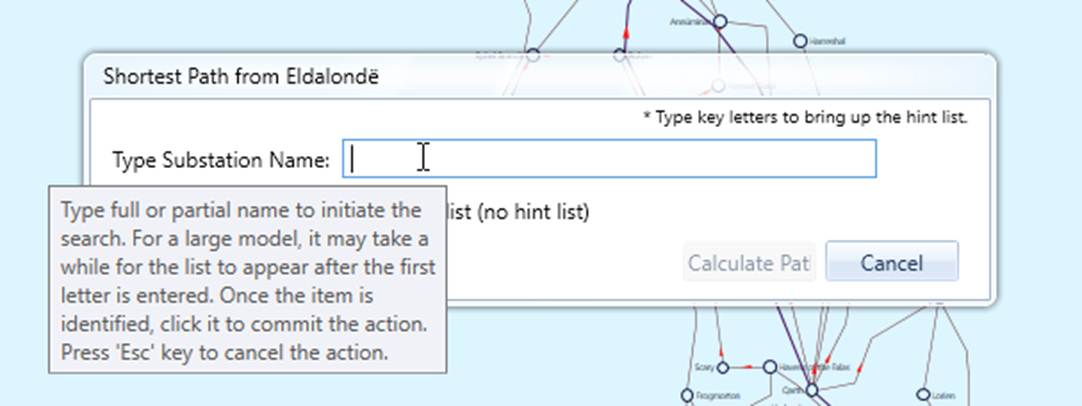
After invoking the feature, users are prompted to select the target substation, as shown below.
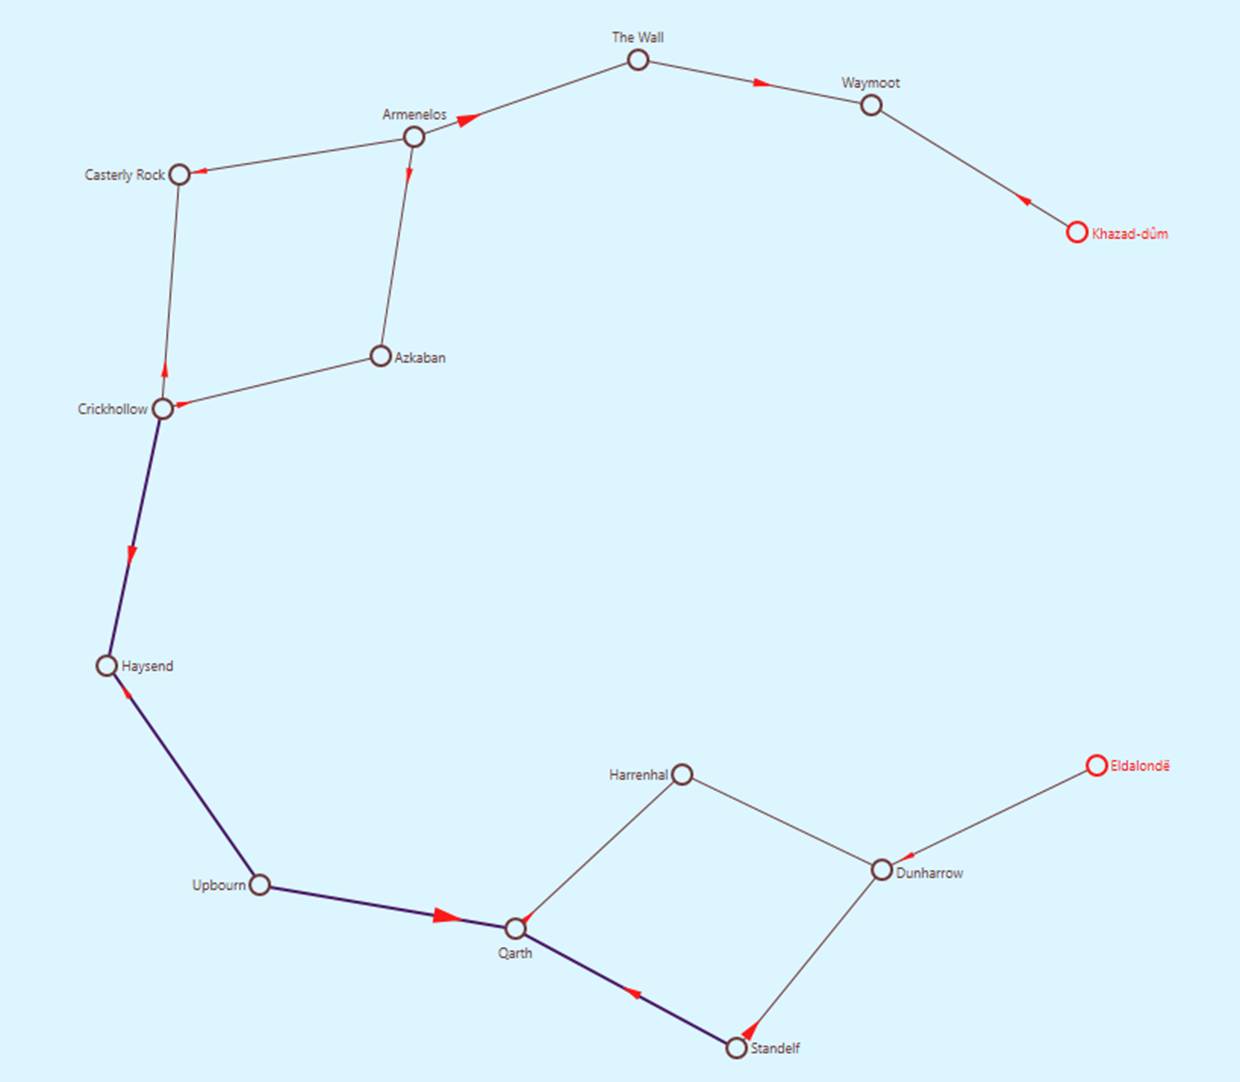
When launched from the schematic diagram, the Tool displays a schematic shortest-path diagram, as illustrated below.
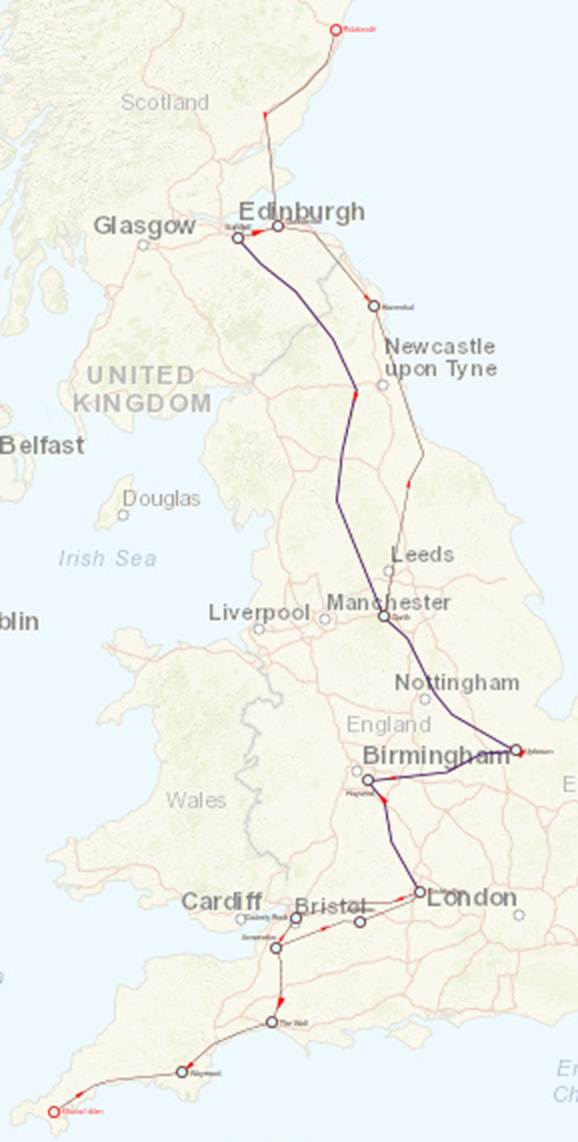
\ When launched from the geo diagram, the Tool displays a geo shortest-path diagram, as shown below.
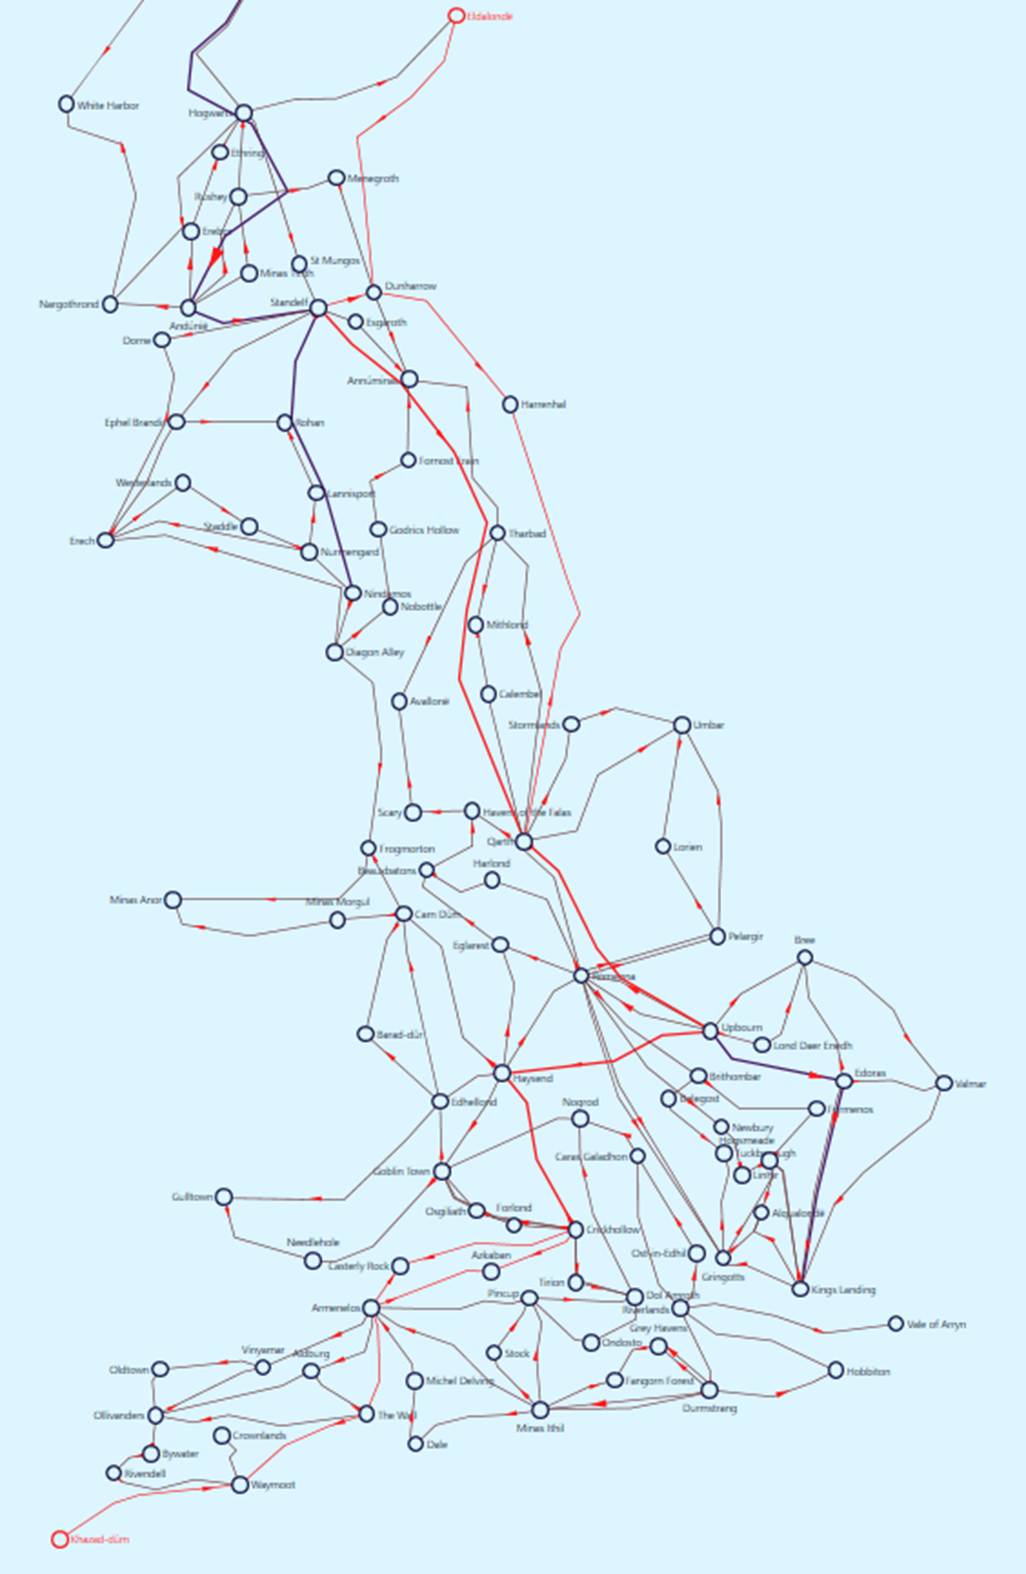
\ If “Highlight Shortest Path” is selected, the computed shortest path is highlighted directly within the geo diagram.
Expanding the Schematic Neighborhood/Geo Neighborhood Diagram
For both Schematic Neighborhood and Geo Neighborhood diagrams, once the diagram is generated, users can perform various tasks, the Tool provide a rich user experience for users to explore the model, including focusing on richly presented “interesting data” , seeking useful information using various interaction and navigation techniques, and customizing the displays for better look and feel. One of the interactive features specific to Neighborhood Diagram is called Neighborhood Expansion.
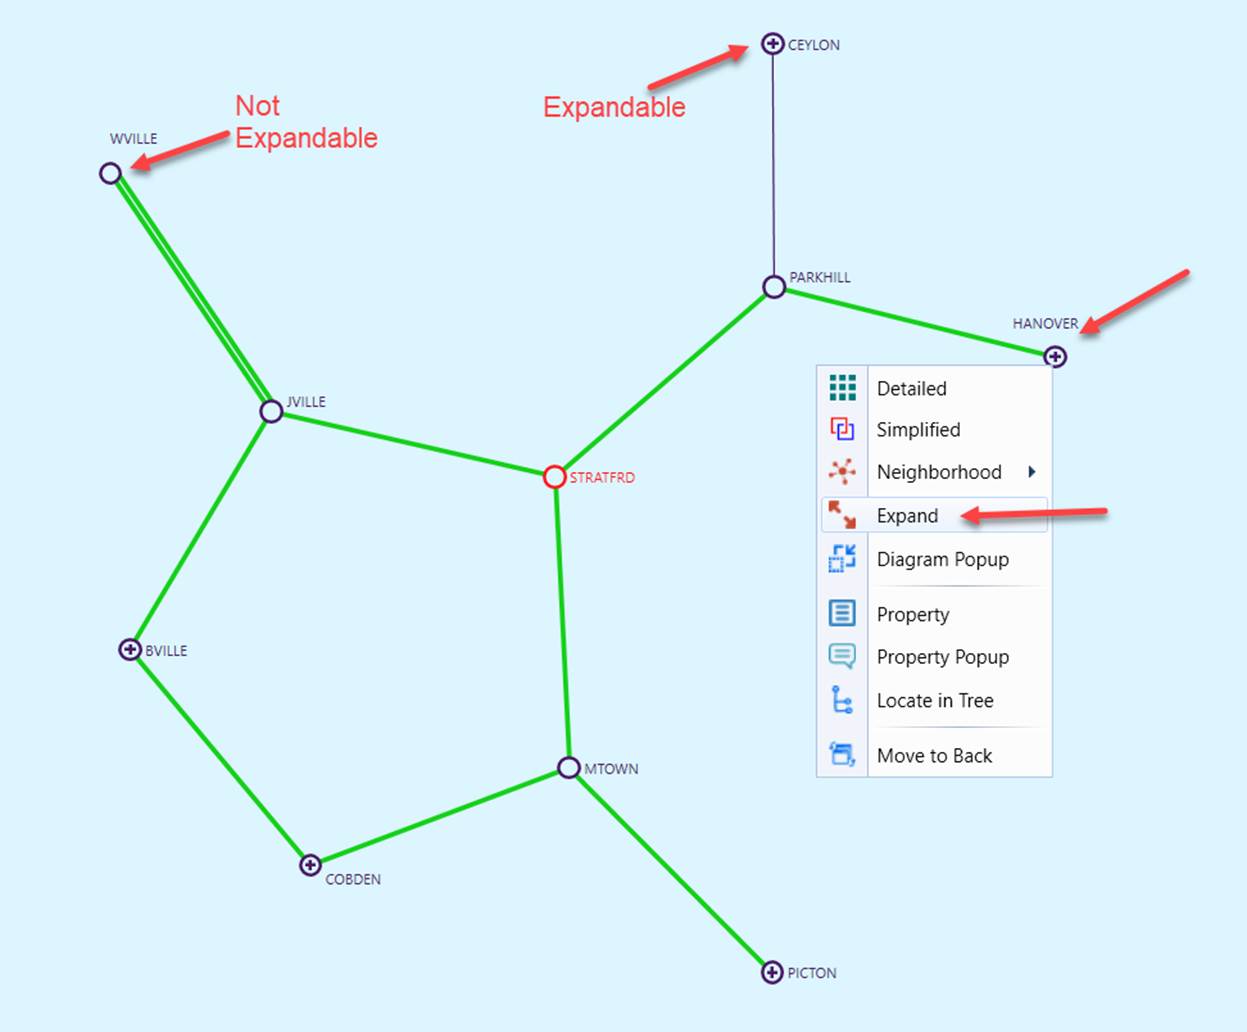
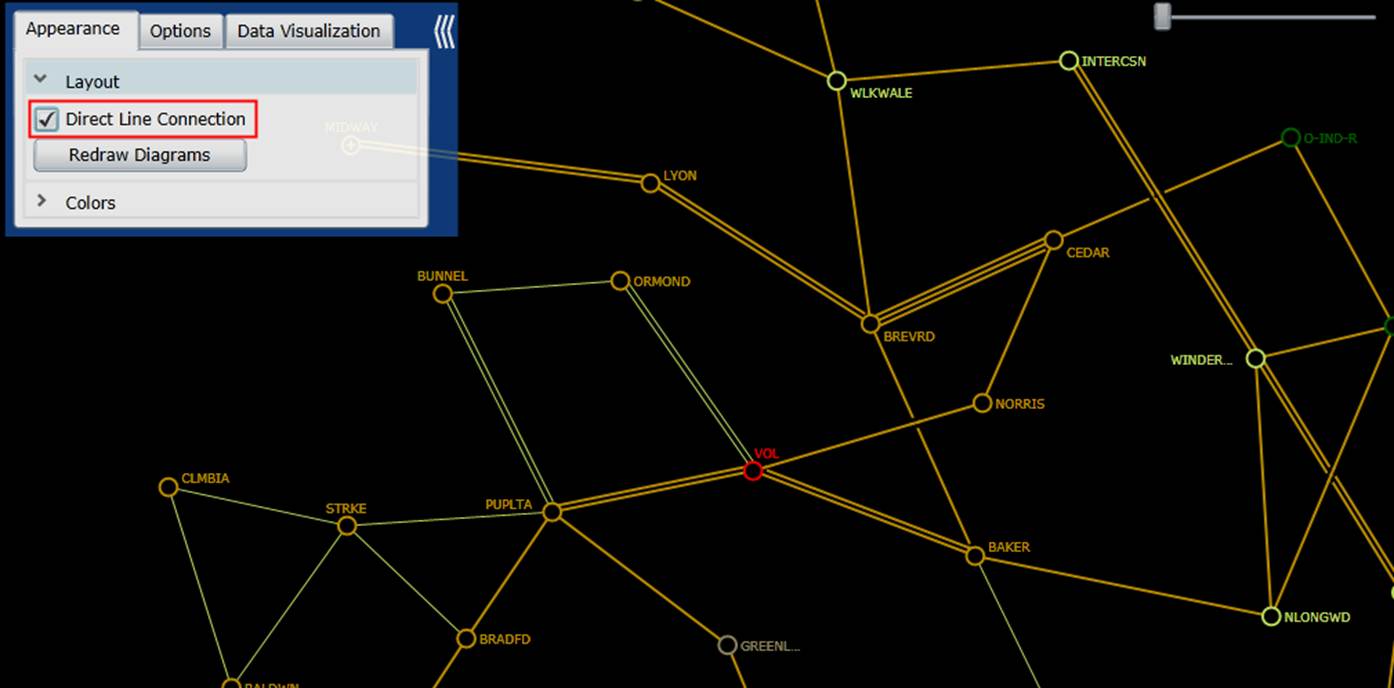
In a reality-based model, the station neighborhood diagram could become quite messy if users select a neighborhood of more than level-2. The Neighborhood Expansion feature is designed to help users explore the ‘interesting’ part of the model. This interactive feature enables users to expand (or ‘grow’) the generated neighborhood diagram from the select boundary substation. Typically, users call a neighborhood diagram of level-1, and then select one of the boundary substations to expand through the context menu associated with the boundary substation. For a direct-line neighborhood diagram, the boundary substations are marked as “expandable” with a “+” sign inside the circle that represents the substation, as illustrated below.
Once expanded, the neighborhood diagram will be updated and all of the external substations connected to the selected boundary stations will be included in the updated neighborhood diagram and become the new boundary substations. Users can continue this model exploration process by expanding the diagram from a new boundary substation.
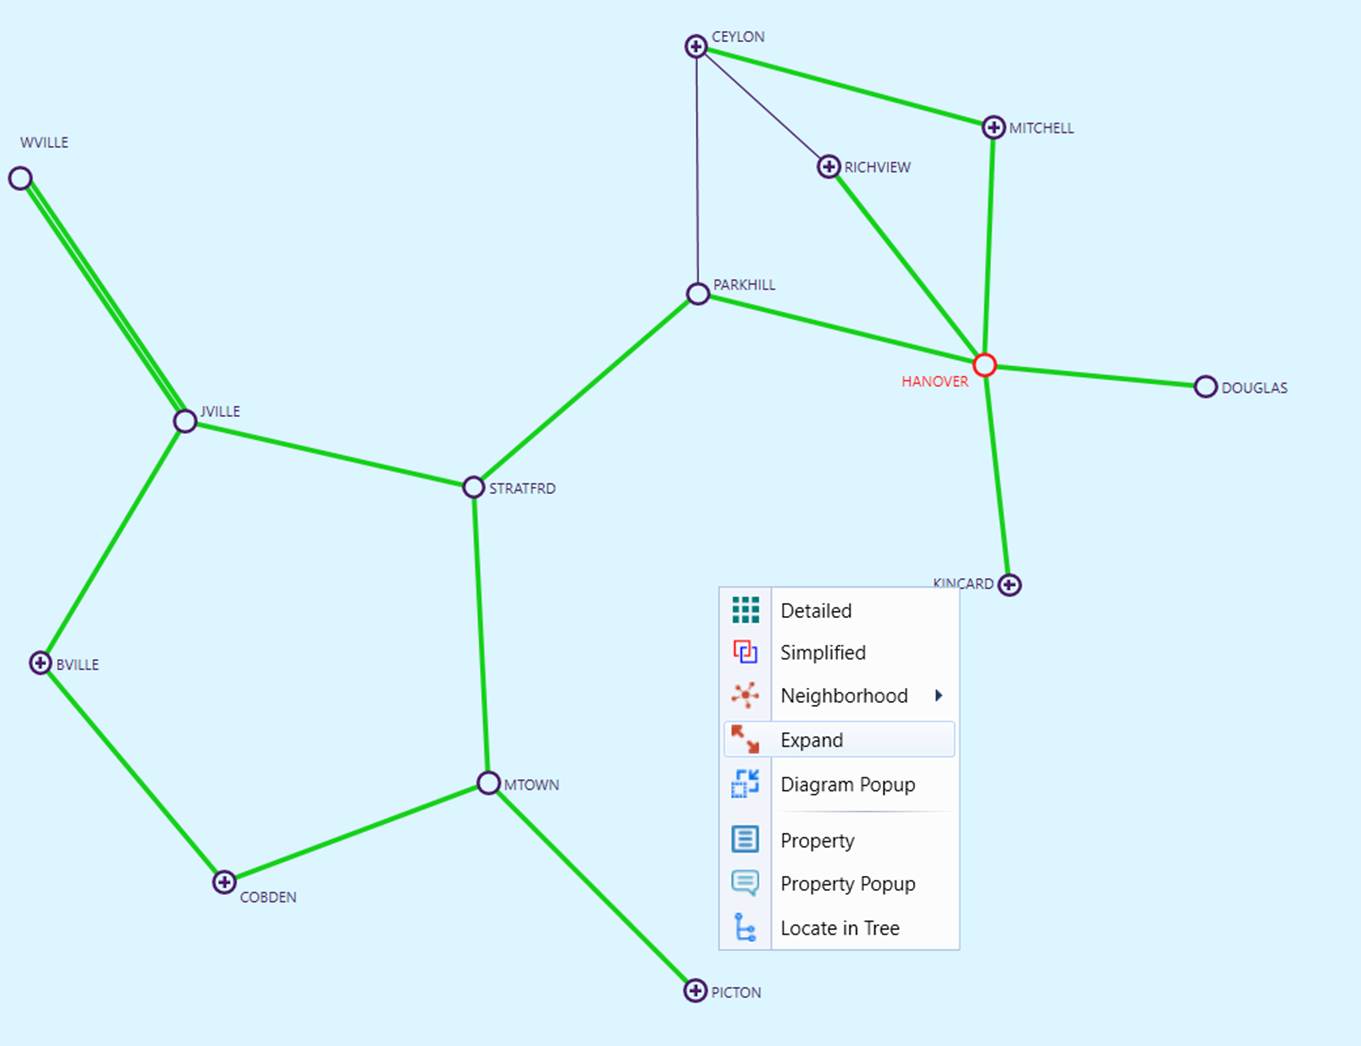
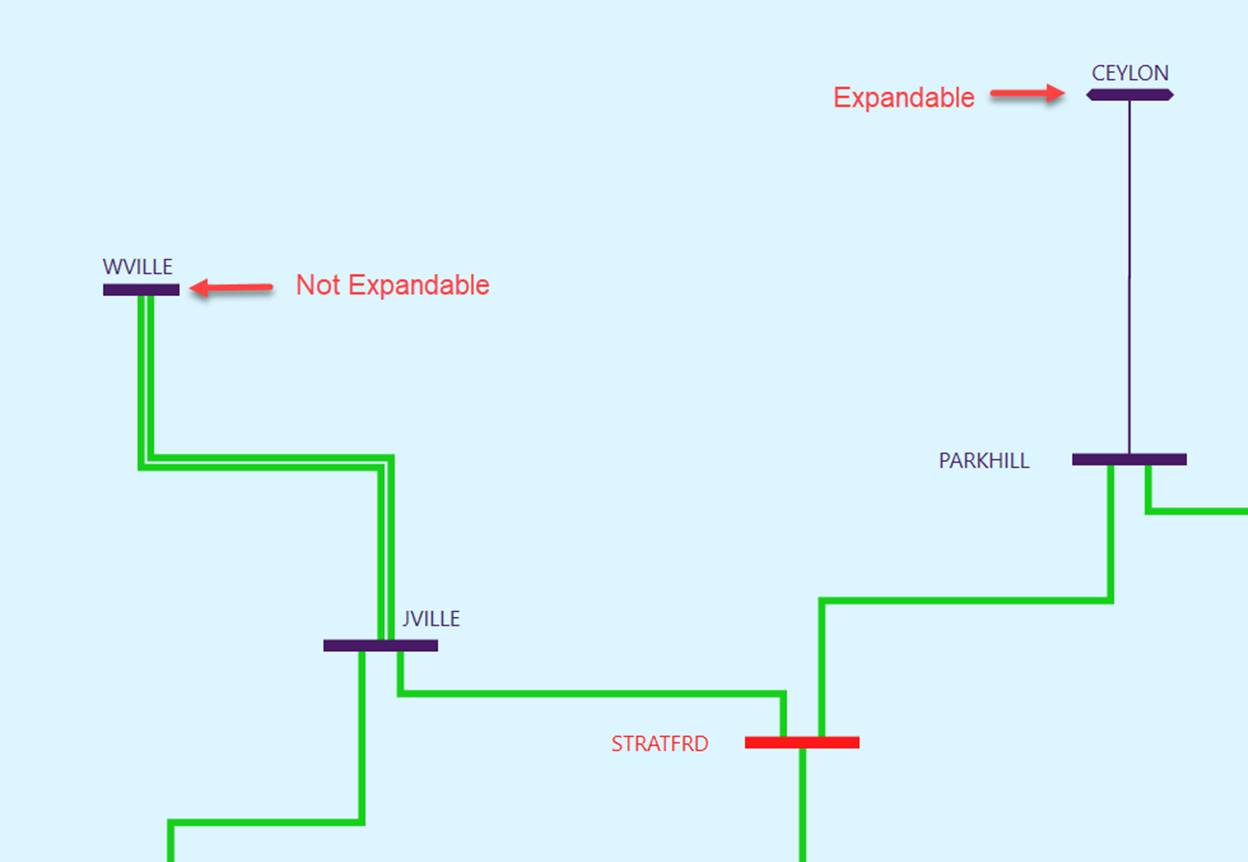
Horizontally/vertically connection is not available in Geo Neighborhood diagram. For a horizontally/vertically connected neighborhood diagram, the graphical symbol representing an expandable Substation is arrow-ended, meaning that it can grow, as shown below.
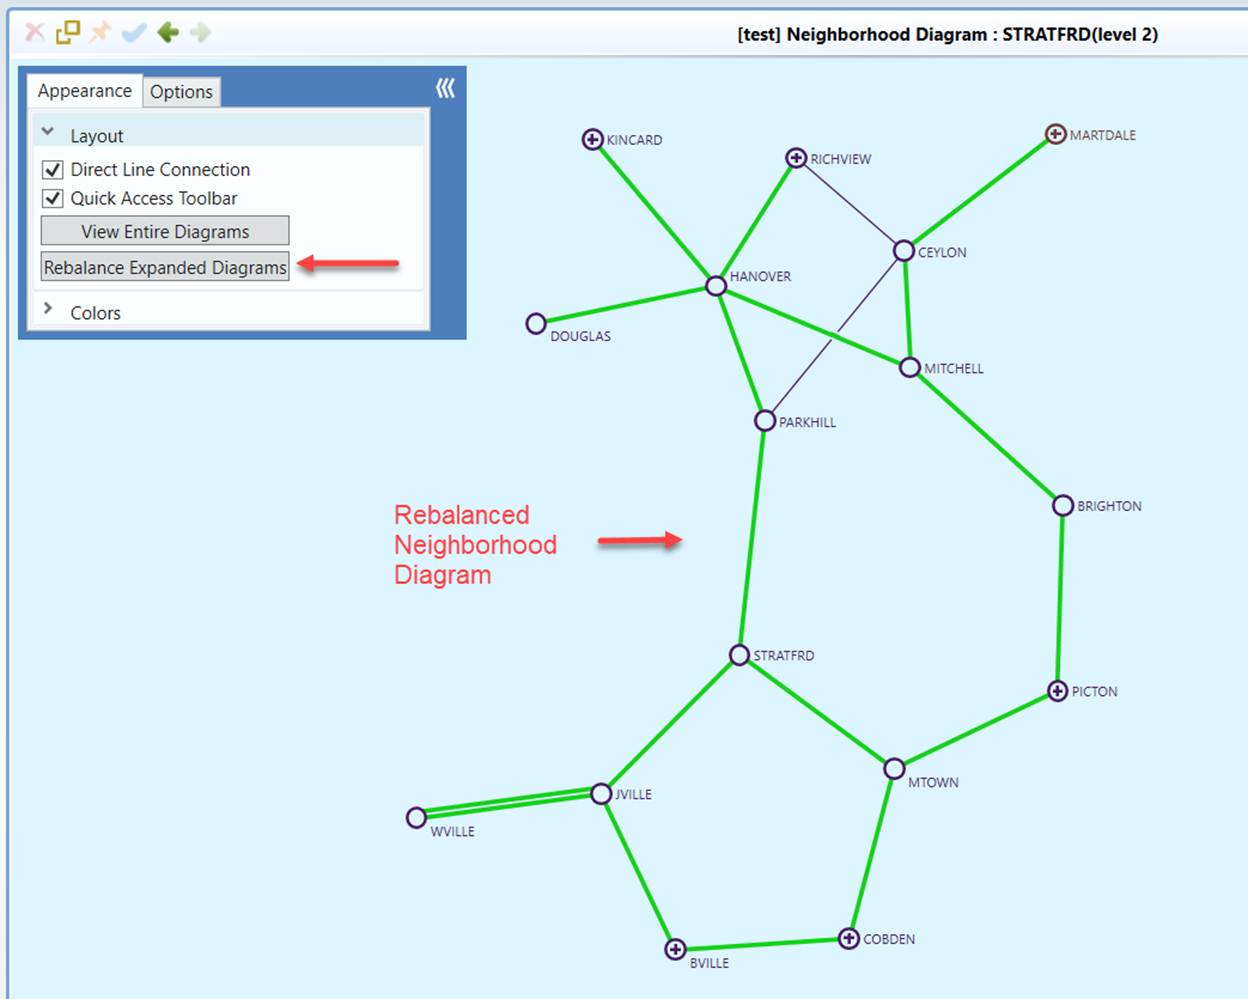
Users can further enhance the clarity of the expanded neighborhood diagram by resizing/re-balancing the layout of the expanded neighborhood diagram, as illustrated in the following screenshot. Note that Rebalance function is not available in expanded Geo neighborhood diagram as the layout is already optimized by geo locations.
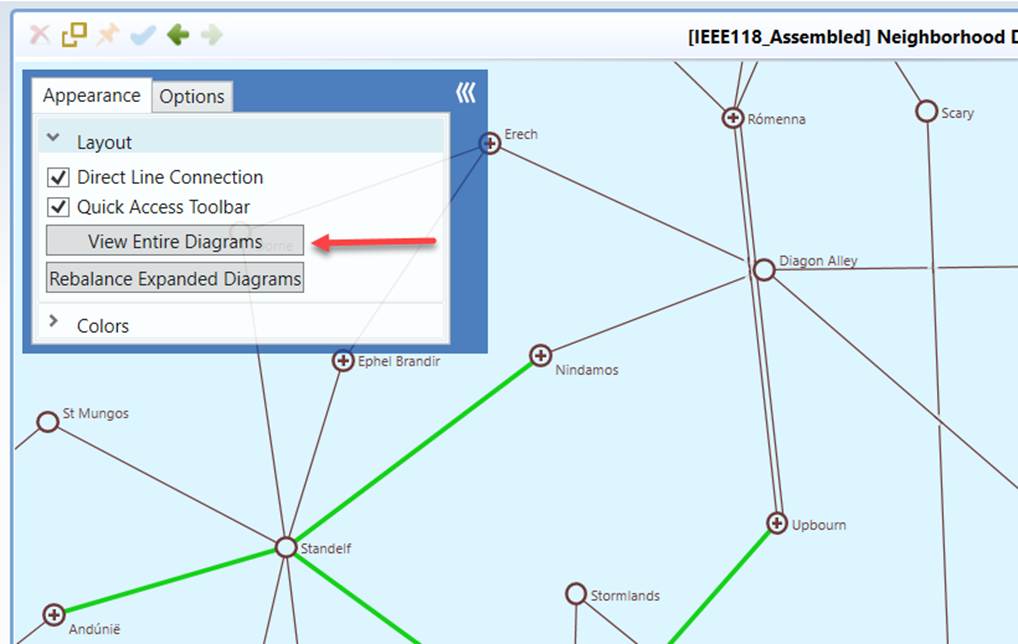
View Entire Geo Neighborhood Diagram after Expand
Sometimes, expanded diagram becomes too large to fix the screen. With map background, users can always use map zoom-out function to view the entire diagram. Without map background, users have a limit for zoom range. If the entire diagram is not viewable at the minimum zoom, users can click the View Entire Diagram button to readjust the diagram to fit into the screen. This is similar to Neighborhood Diagram without geo locations. However, Geo Neighborhood Diagram does not have Rebalance Expanded Diagrams menu, as the substation positions are already optimized and fixed by geographic locations.
Customized Schematic Neighborhood/Geo Neighborhood Diagram
Custom neighborhood level is available in both Schematic Neighborhood and Geo Neighborhood diagrams. By default, the Tool displays the neighboring Substations at all voltage levels. Users can customize the neighborhood diagram by restricting the search within a certain voltage range. The resulting is called customized neighborhood diagram.
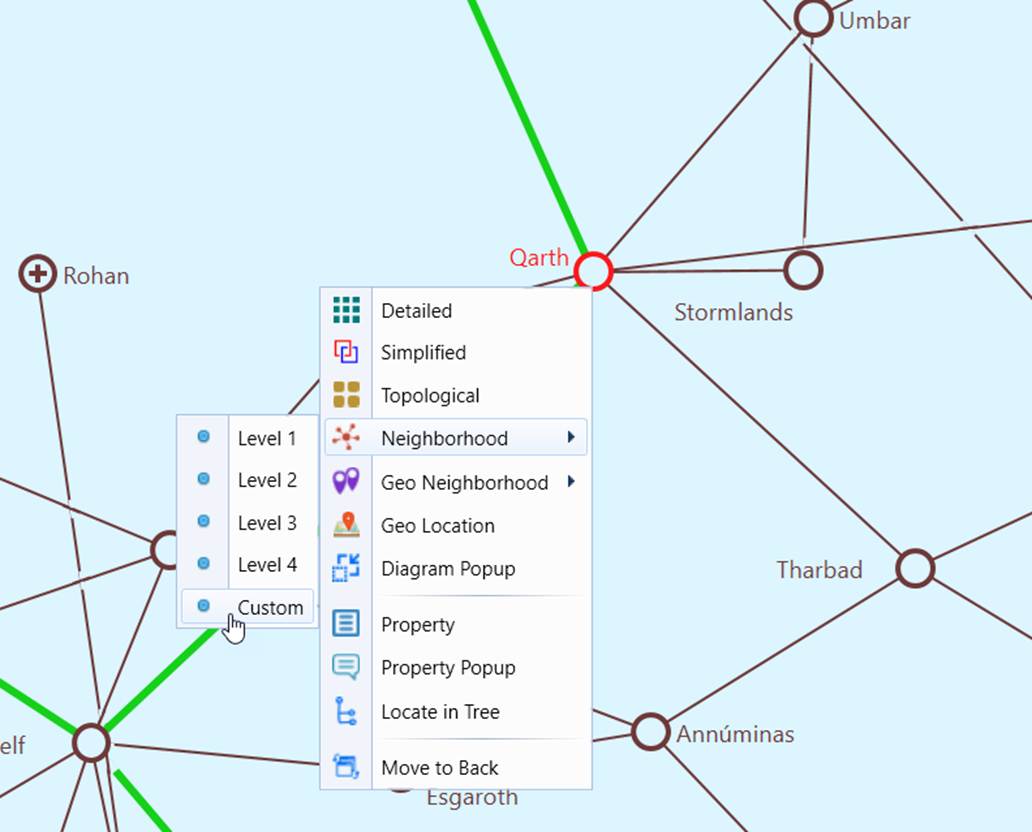
To generate a customized neighborhood diagram, users should right-mouse-click a selected Substation and then select the “Custom” context menu. In the following example, the selected Substation, JDM_1491, connects 5 neighboring Substations at two voltage levels.
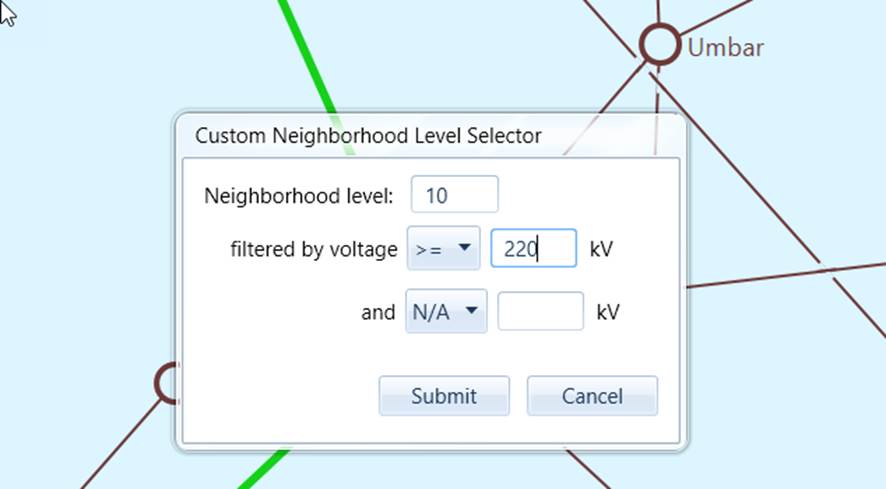
Once selecting the ‘custom’ option, users will be prompted to enter the customized search criteria, including neighborhood level and voltage filtering criteria. In the following example, users select to display 10-level neighboring substations at 220 kV or above.
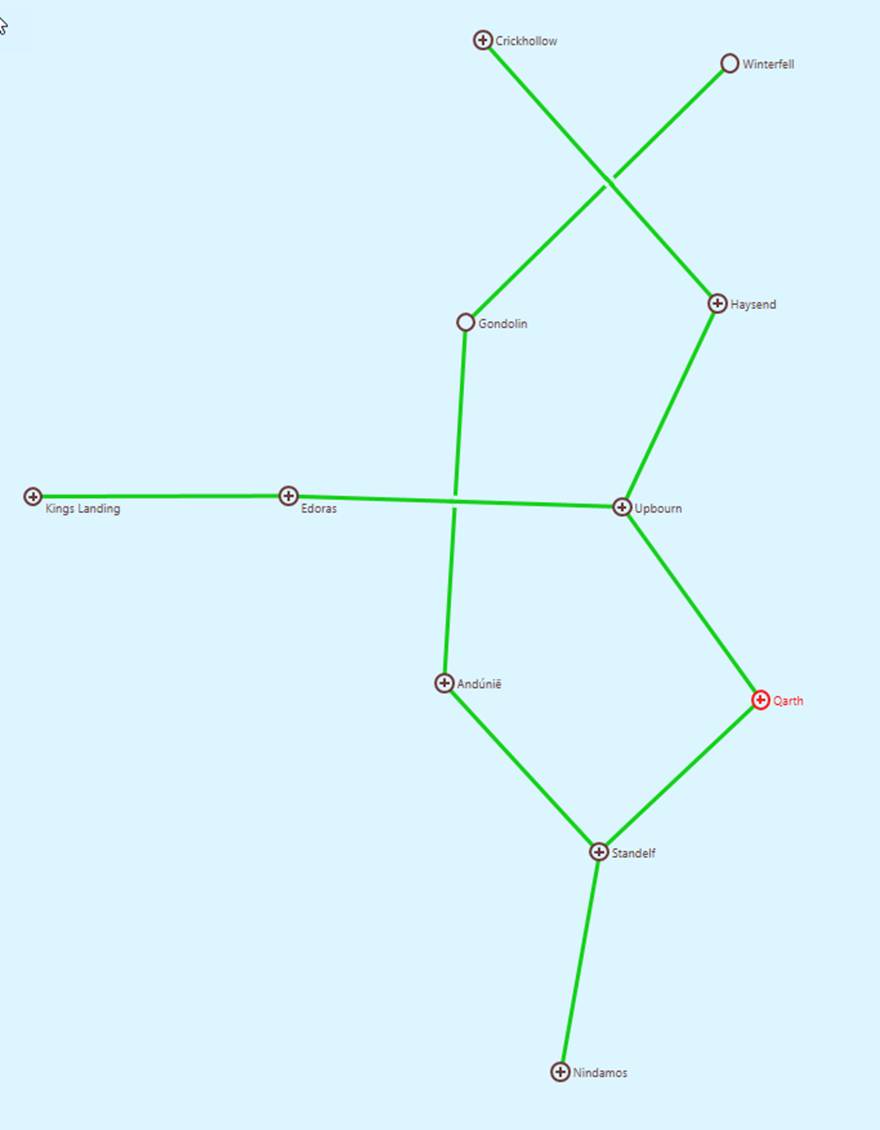
As shown from the following diagram, the customized neighborhood diagram shows only the high-voltage neighboring Substations.
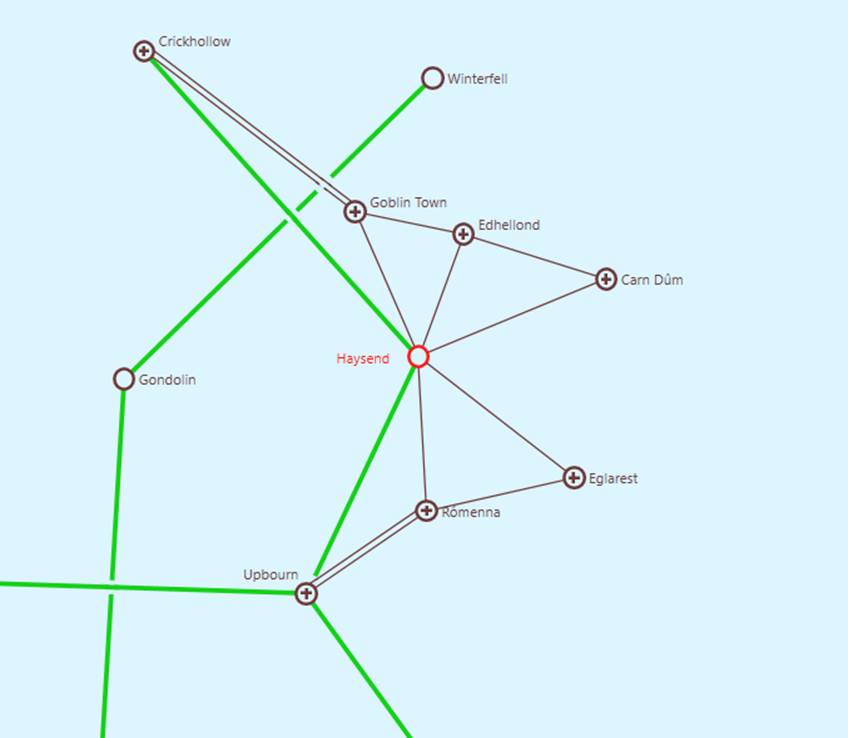
Users, however, can still expand any “expandable” Substations to show the neighboring Substation at other voltage level.
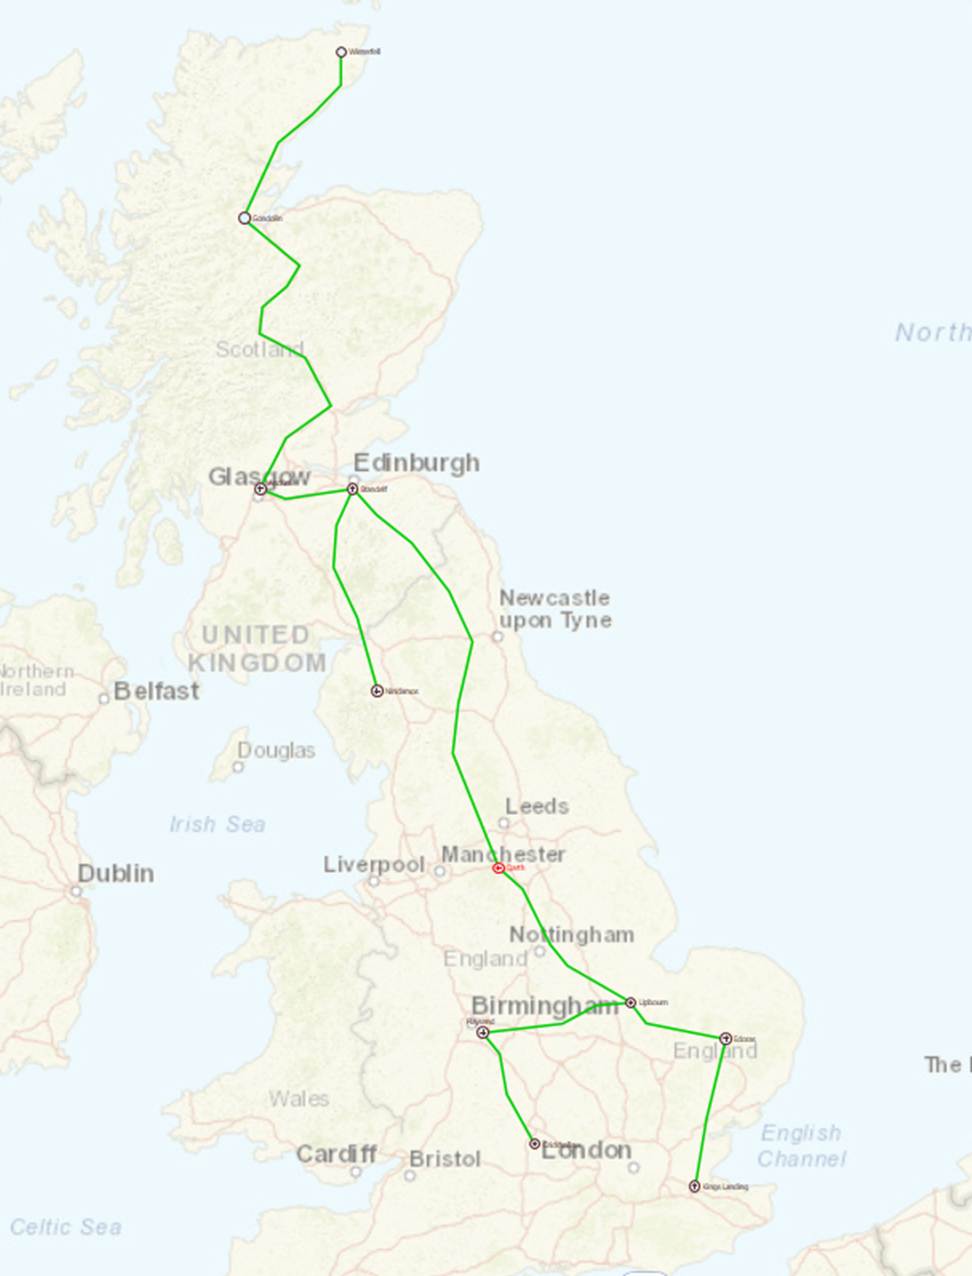
Custom Neighborhood Diagram can also be called from a Geo Neighborhood Diagram. The following displays 220 kV and above Geo Neighborhood Diagram on a geographical map.
Calling Substation Diagrams from Neighborhood Diagram
While navigations are provided between Neighborhood Diagram and Substation Diagram, users may want to call Substation Diagram directly from Neighborhood Diagram (schematic or geographical) through a popup Window. This feature will allow users to drill down into a Substation from Neighborhood Diagram without losing the context. Substation Diagrams can be called from Neighborhood Diagrams in the following two ways:
- Double-click the graphical symbol or label of the selected Substation
- Right-mouse-click the graphical symbol or label of the selected Substation and select Popup Diagram
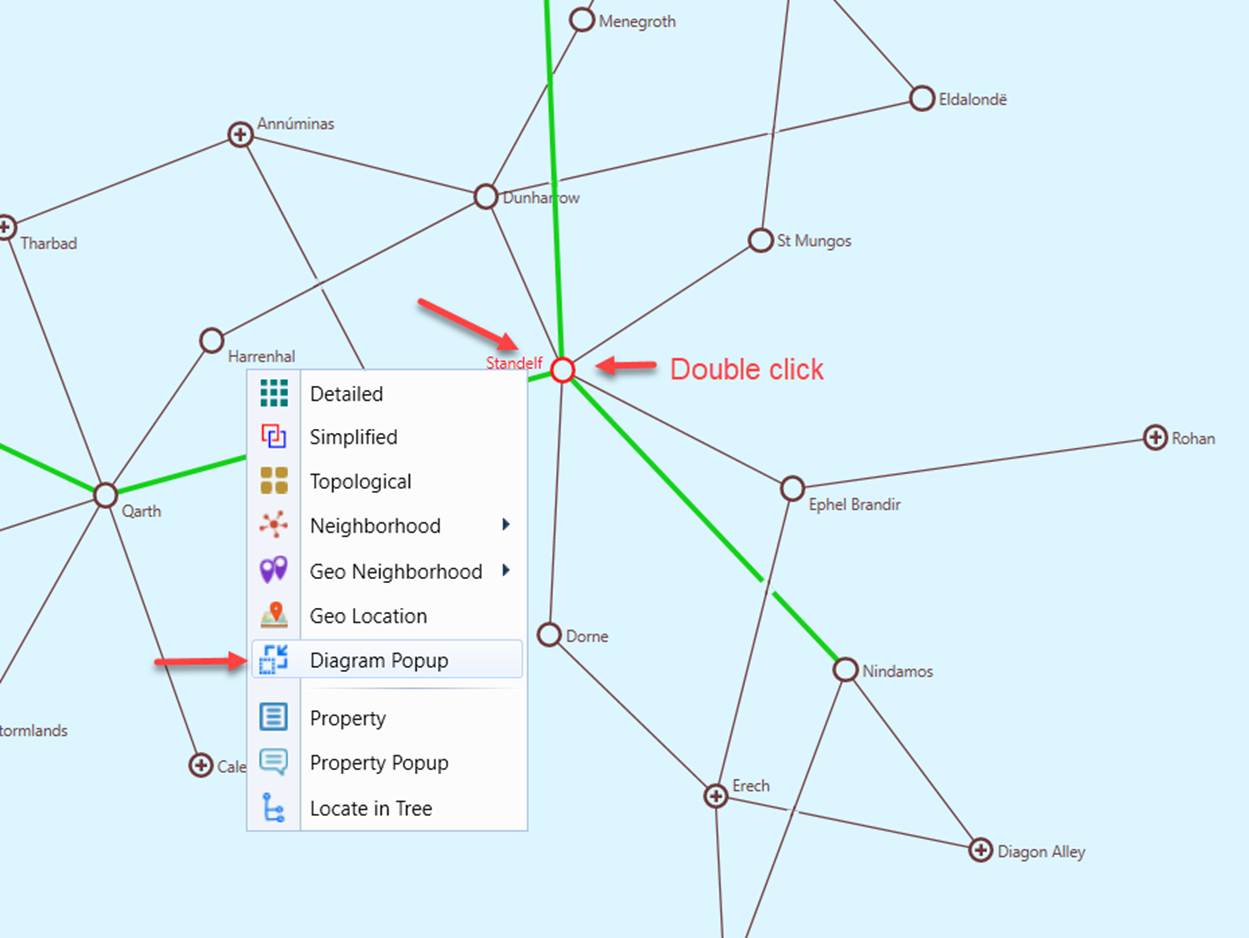
Once invoked, a separate Windows will pop up on top of the current Geographical Diagram to display the default type of the Substation Diagrams (typically the Detailed Substation Diagram). Users can always change the type of the Substation Diagrams using context menu, as illustrated.
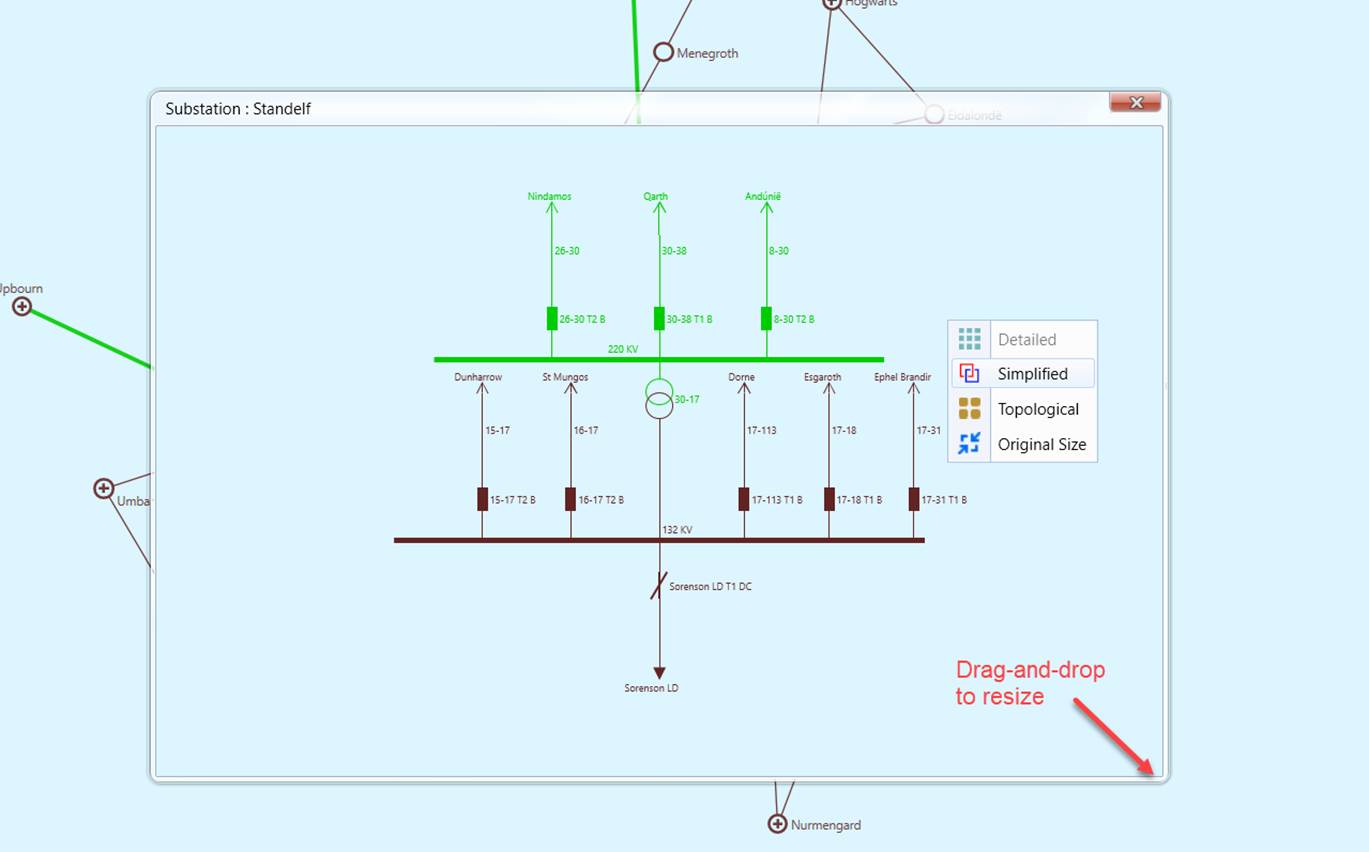
A popup Substation Diagram is just like a typical Substation Diagram in appearance. It inherits all of the current user preference settings. Users can also zoom and pan the diagrams in a popup Substation diagram. But there are some limitations or restrictions in functionality and navigation. For example, popup Substation Diagram is read only. The only navigation link provided in a popup Substation Diagram is to the neighboring substations via double-clicking of the selected symbol/label representing neighboring substations. Popup Window can be resized by dragging-and-dropping the boundary and the boundary corner.
Popup Substation Diagrams can also be invoked from Geographical Diagrams.
Visualization of Regions in a Neighborhood Diagram
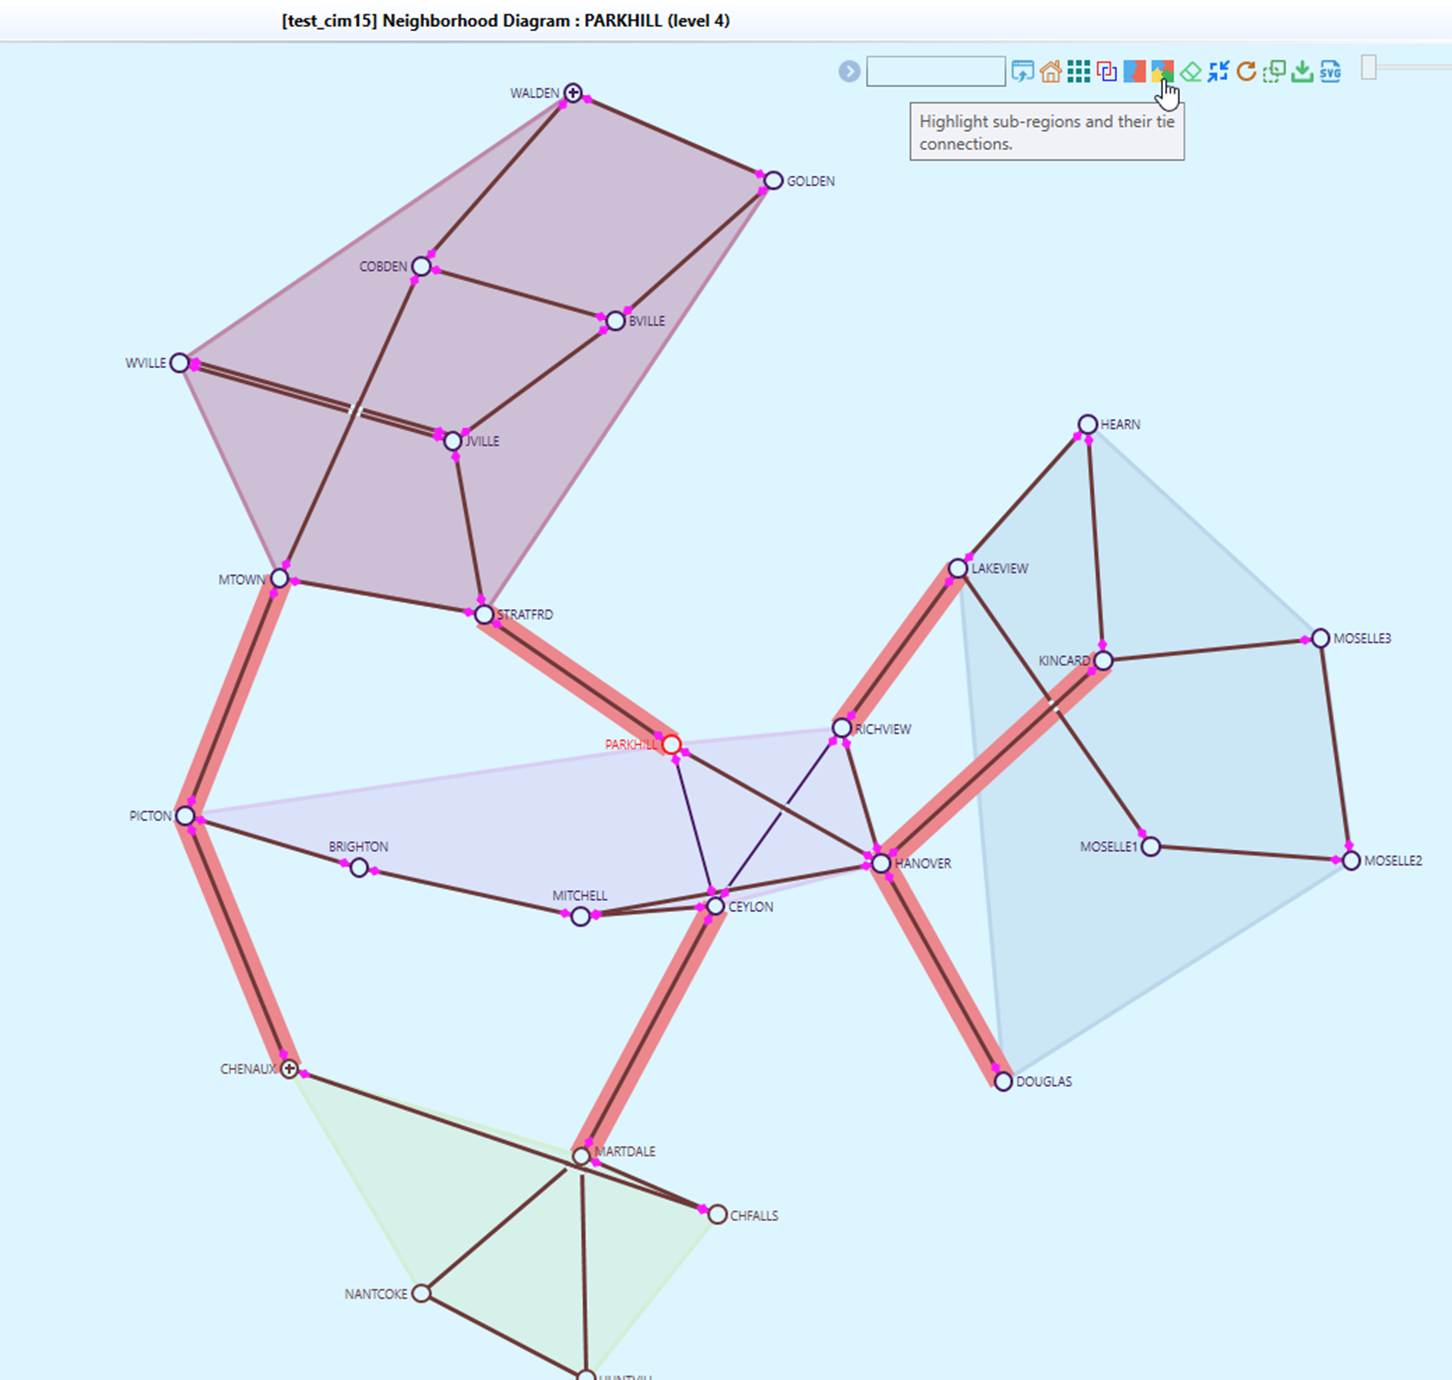
The Tool allows users to visualize regions (GeographicalRegion or SubGeographicalRegion) within a neighighborhood diagram, as illustrated below. Once enabled, a colored polygon overlay is generated for each region, highlighting the geographical area it covers. Additionally, tie-lines connecting different regions are also highlighted, providing a clear representation of interconnections.
Schematic Neighborhood/Geo Neighborhood Diagram Display Options
The Tool provides a variety of options, enabling users to display/hide the information in a neighborhood diagram. The following screenshots illustrate what display options are available for a neighborhood diagram.
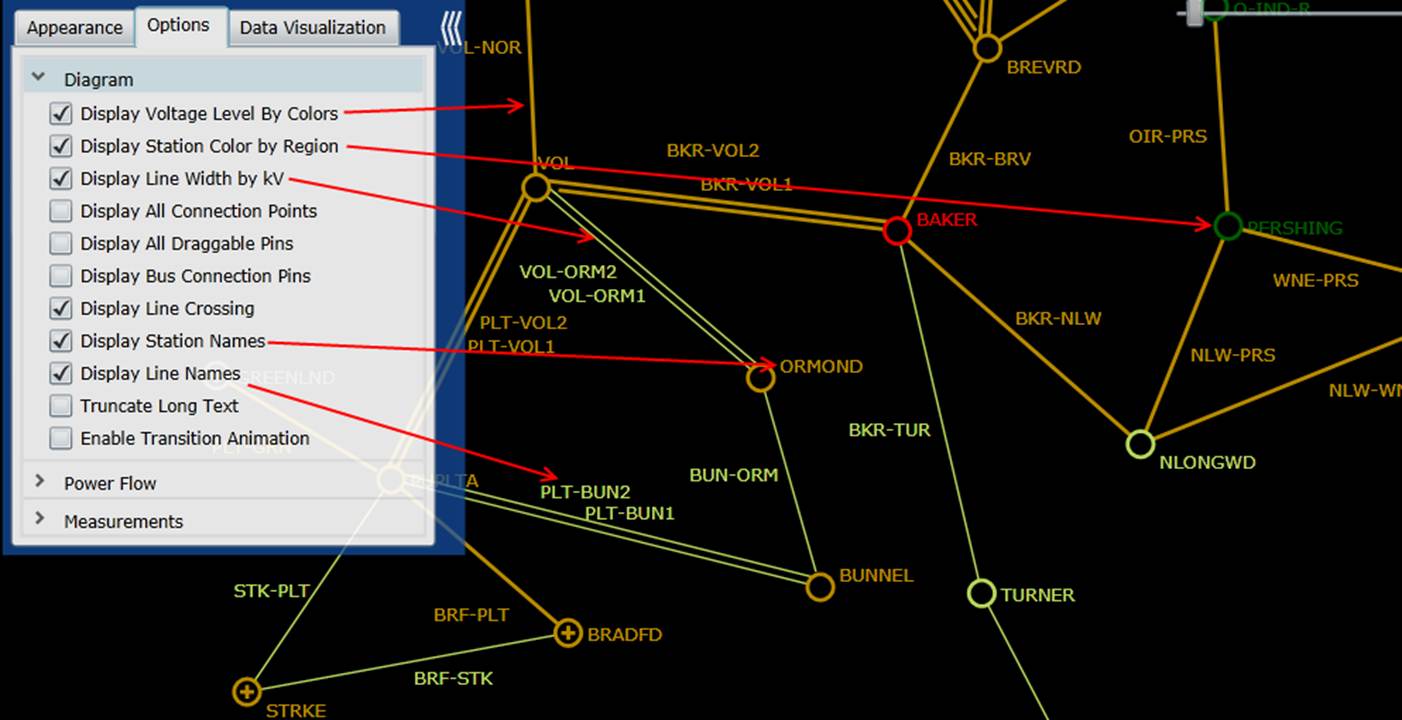
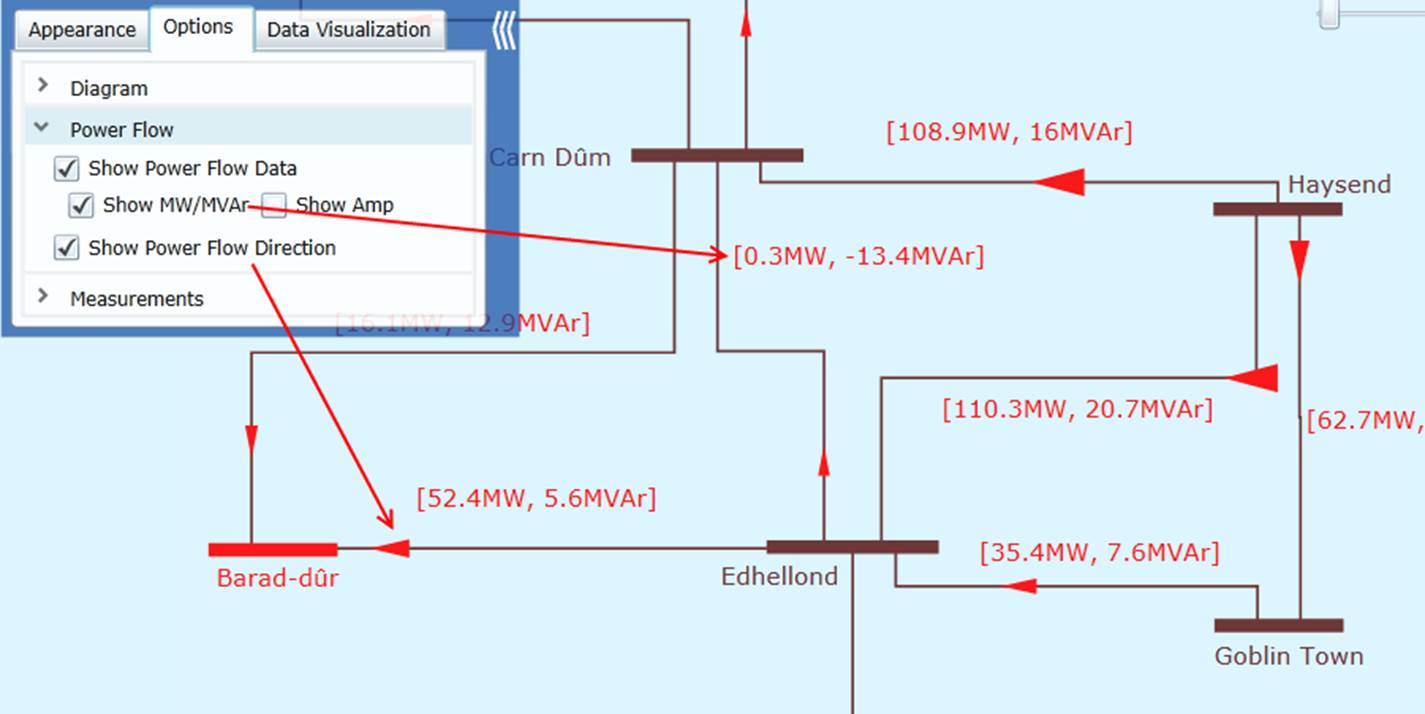
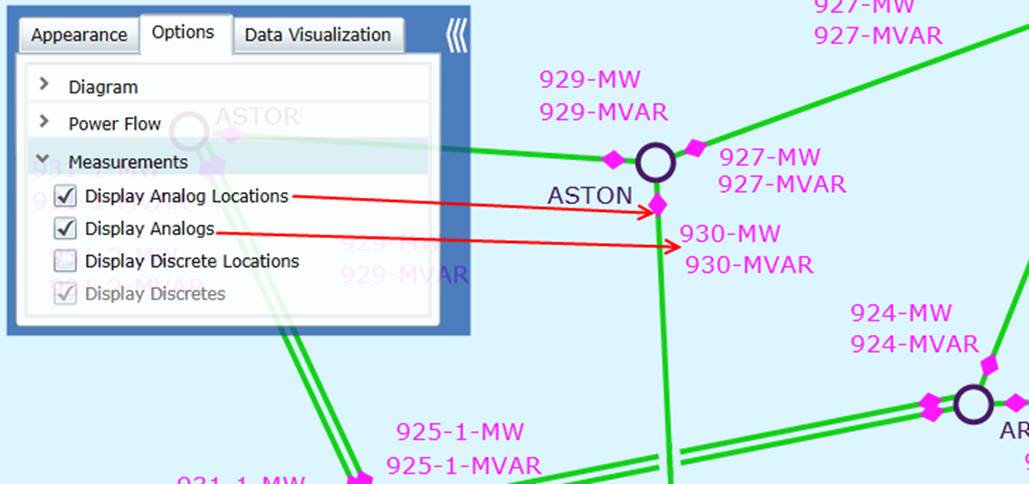
Schematic Neighborhood Diagram Look and Feel
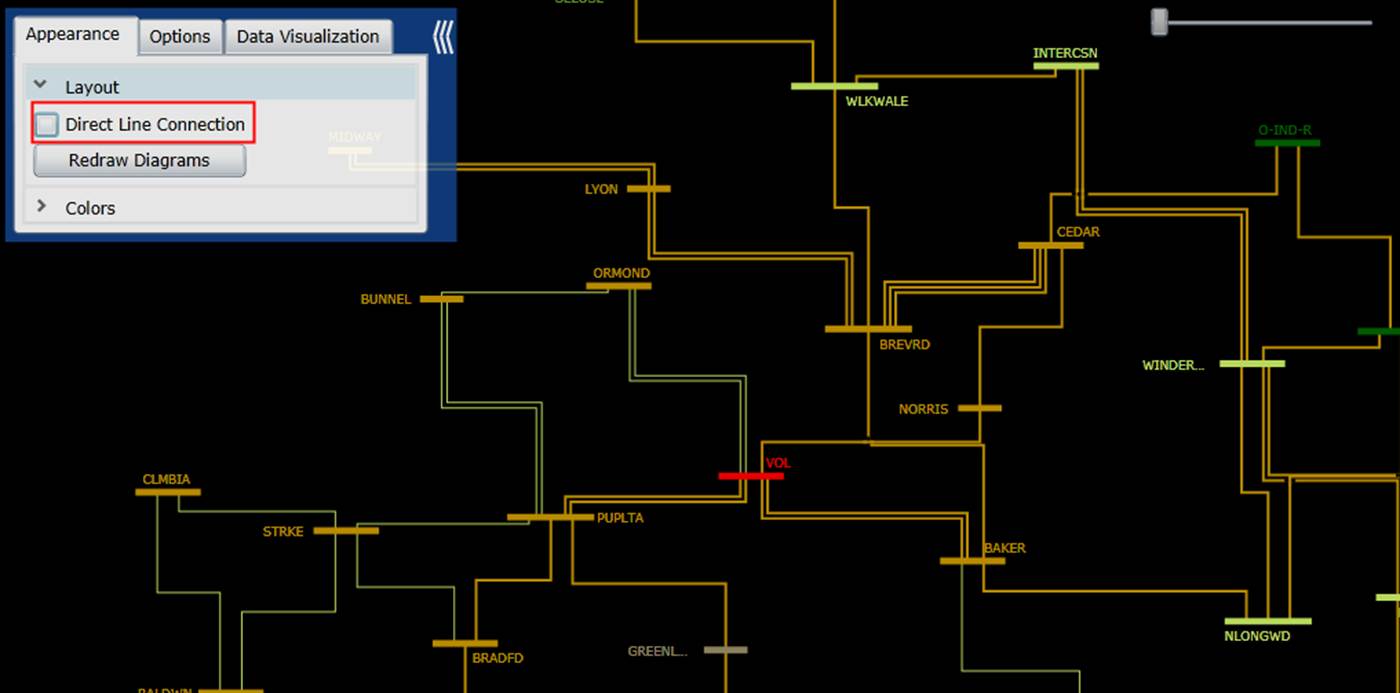
Users also have the option to decide whether the substations shall be directly connected or vertically/horizontally connected. Different users have different favors. The Tool let users to make their own decisions. The following two screenshots compare a directly-connected Neighborhood Diagram with the corresponding vertically/horizontally connected Neighborhood Diagram. This option is not available to Geo Neighborhood Diagram.
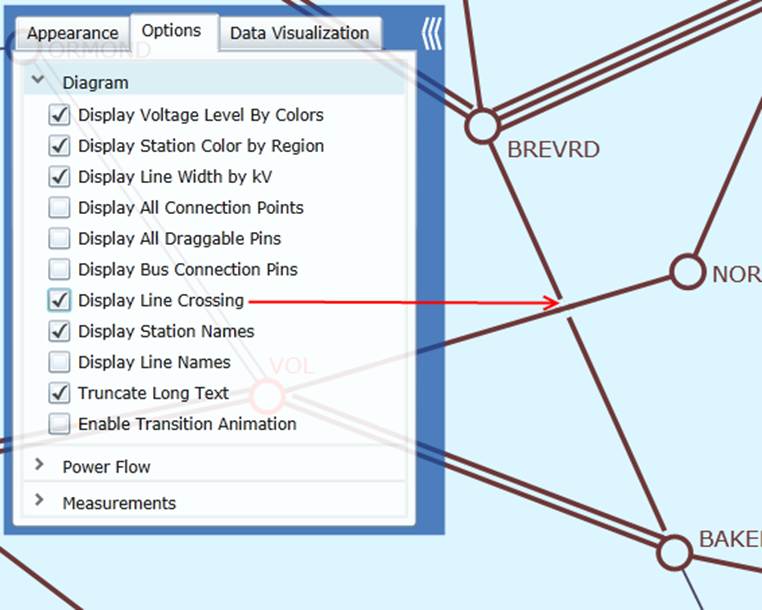
Line crossing is inevitable in some cases.. When the “Display Line Crossing” option is enabled, a small gap is added for one of the crossing lines, reminding users that the lines/buses are not connected. In many cases, this option enhances the clarity of the diagram. The following two screenshots illustrate the crossing lines in Substation Diagram and Neighborhood Diagram respectively.
Geo Neighborhood Diagram Look and Feel
Specifically available to Geo Neighborhood diagram, users can toggle Show Map Background menu to display or hide the map background. Without map background, the diagram behaves more like standard Neighborhood diagram. With map background, the user interaction and experience are similar to Geographic Diagram.
Neighborhood Diagram for ACLineSegment/Line/Contingency
Neighborhood diagrams, schematic or geo-based, can also be created for ACLineSegment, Line, or Contingency, as illustrated below.
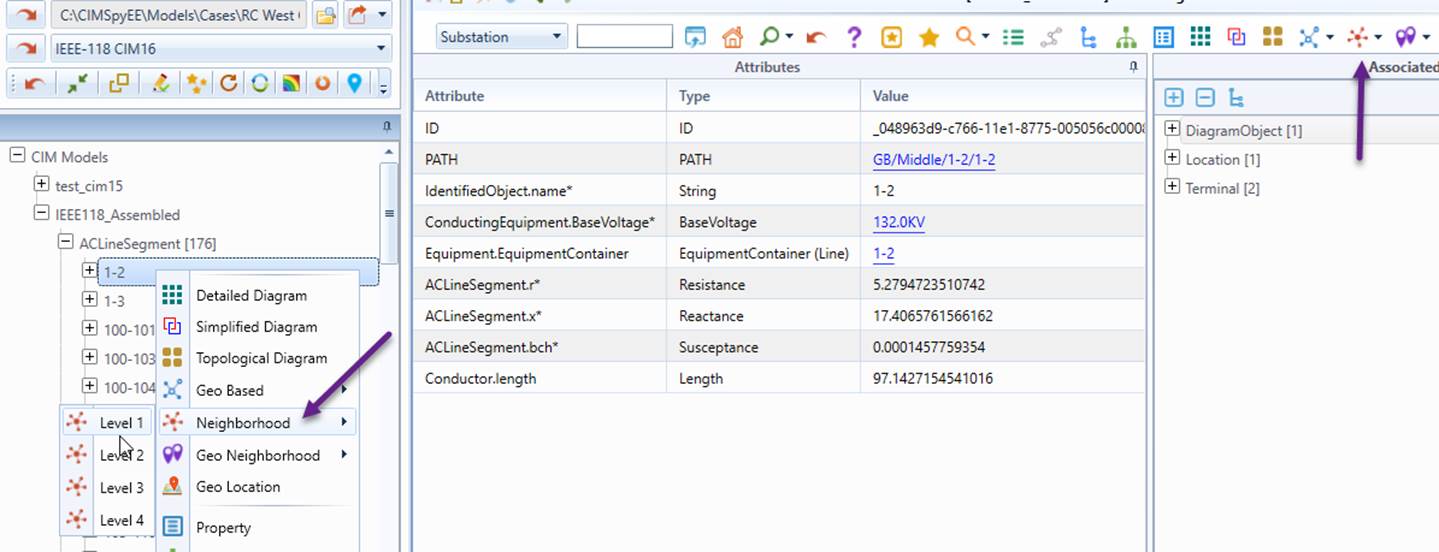
Note
In these Neighborhood diagrams, Level 1 displays only the object itself. For example, at Level 1, an ACLineSegment shows only the ACLineSegment and its connected Substations. Level 2 expands on Level 1 by including one additional branch, and this pattern continues for higher levels.
Multi-Station Diagram
A Multi-Station Diagram can be generated from a Neighborhood diagram, schematic or geo-based, showing the detailed network information.
Diagram Adjustment
Users can adjust the Neighborhood Diagram auto-generated for clarity and better look-and-feel.
Diagram Saving & Export
Users can save the auto-generated Neighborhood Diagram and export it for future use or sharing with other applications.
Locating Substations/Lines on a Schematic/Geographical Neighborhood Diagram
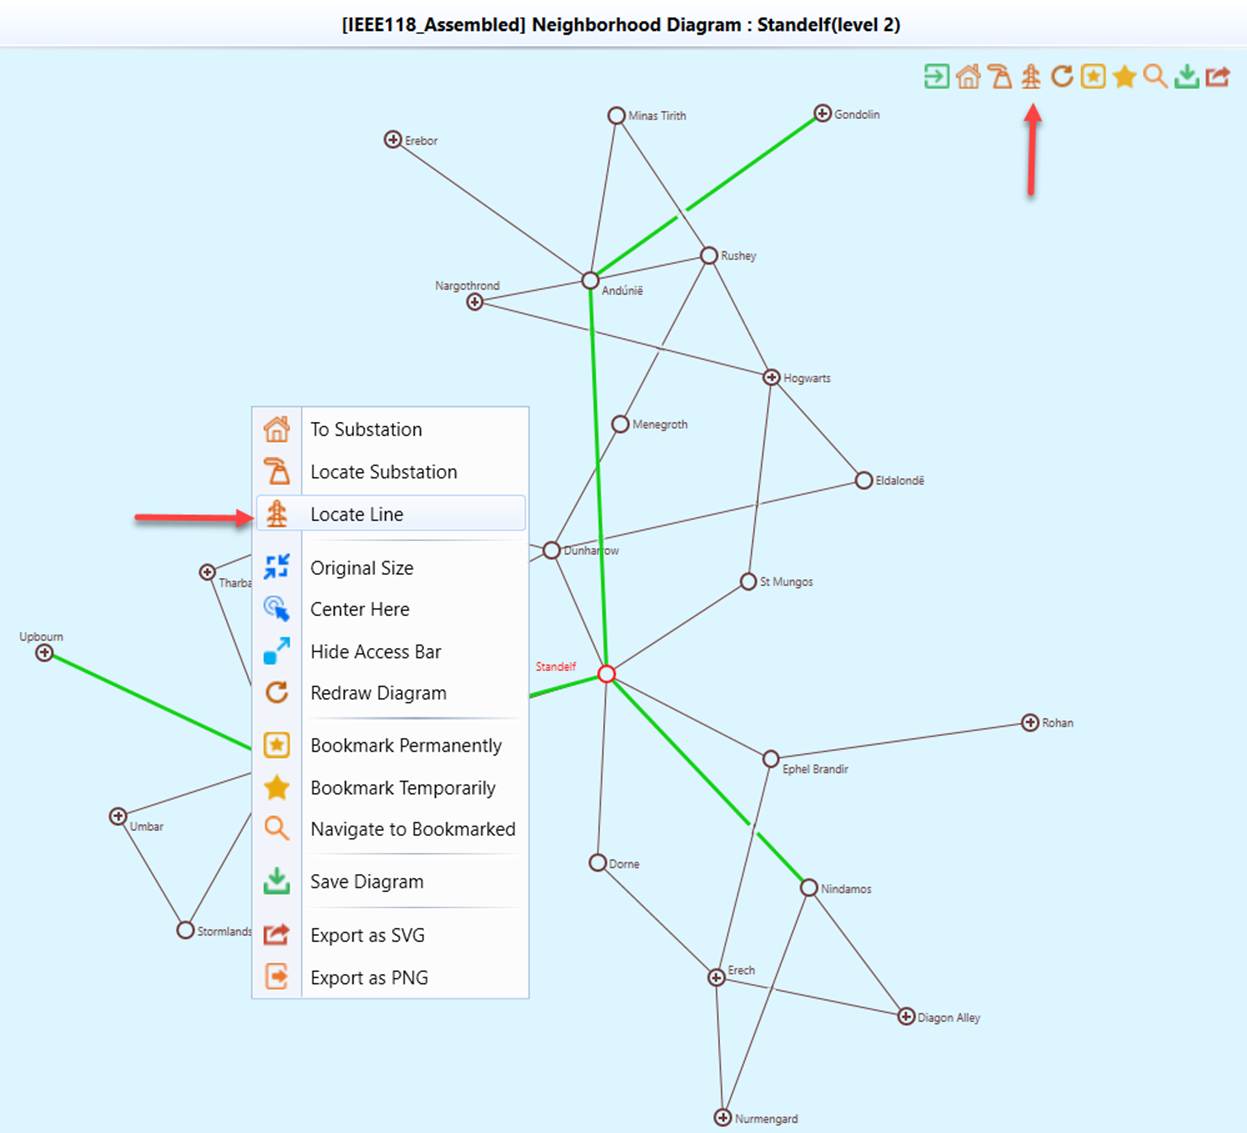
Users can locate a Substation/Line in a schematic/geographical diagram, as shown in the following example.
To locate a Substation/Line in a neighborhood diagram:
- Right-mouse-click a blank spot in the neighborhood diagram and select the “Locate Line” or “Locate Substation” context menu item, as illustrated below.
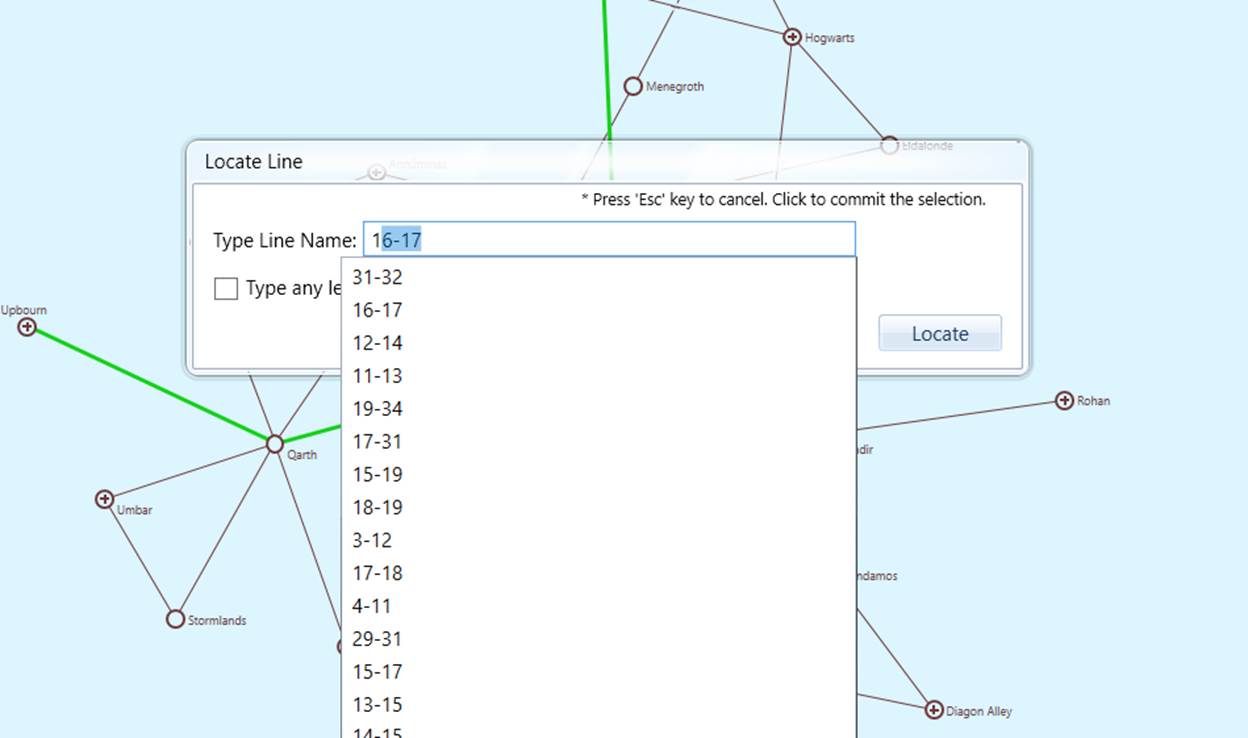
- An information search wizard will pop up. As users enter the name of the Substation/Line, the hint list will be updated. Typically, after enter 2 to 3 letters, users shall be able to find the name from the hint list.
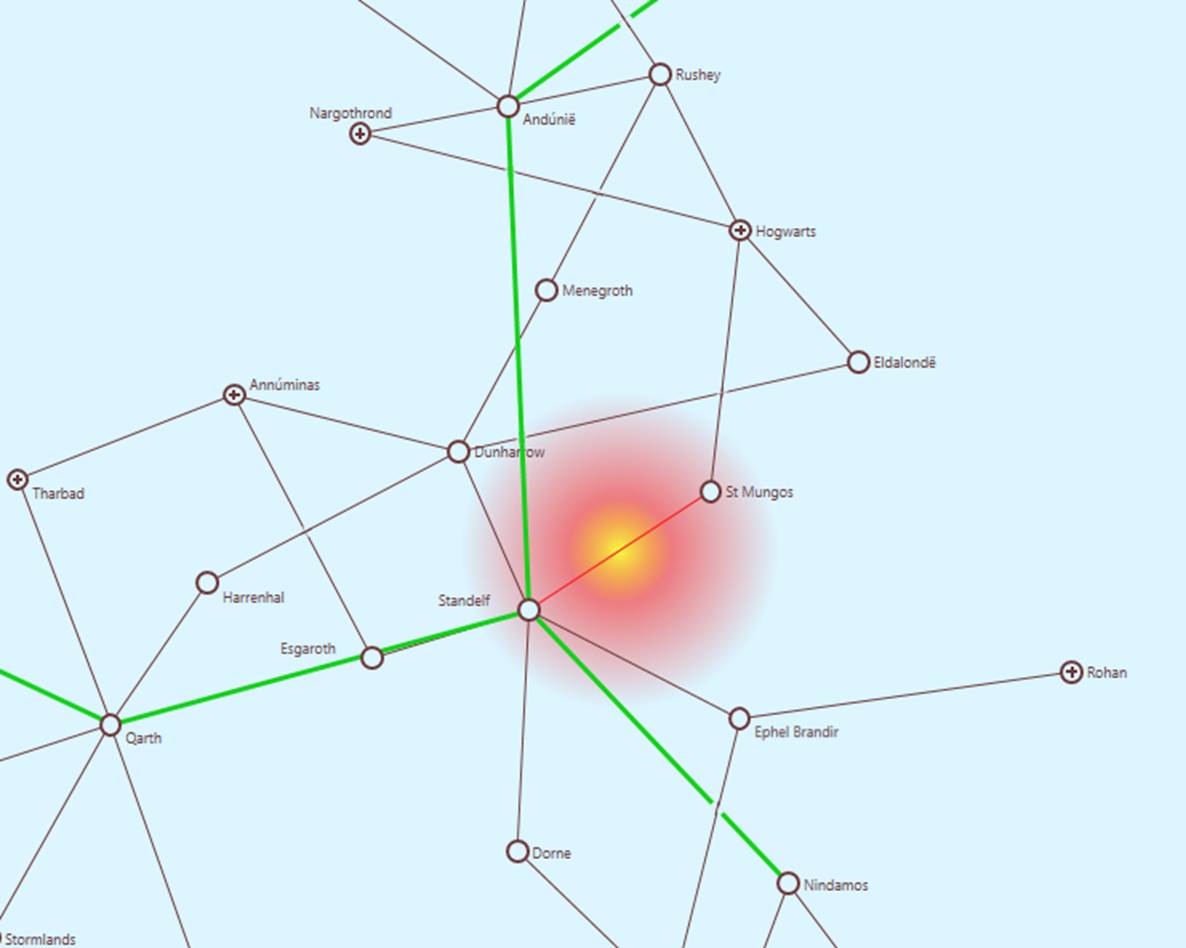
- Once the query is submitted, the Tool will zoom the generated diagram to a proper size, center the identified object, and highlights it in red color. Additionally a heatmap will be created, flashing. It enables users to quickly identify the location of the located network component, as illustrated below.
.