Customizing UI Display
The Tool enables users to customize UI displays for a particular model defined in a Data Source. This is accomplished through applying a Presentation Style, which includes special configuration information used to specify how a model shall be displayed and visualized at the client UI. A Presentation Style is a shared resource. It is defined separately. The same Presentation Style can be applied to multiple Data Sources, and multiple Presentation Styles can be applied to a Data Source. The supported Presentation Styles are specified in the presentationStyle attribute of a (data) Source element. Multiple Presentation Styles can be specified in the presentationStyle attribute, each separated by a “;”. In the case that multiple Presentation Styles are specified, they will be applied sequentially. Thus if there are redundant configuration specified, the one specified in the last one applied will prevail. The following example illustrates how two Presentation Styles are declared and then applied to a Data Source.
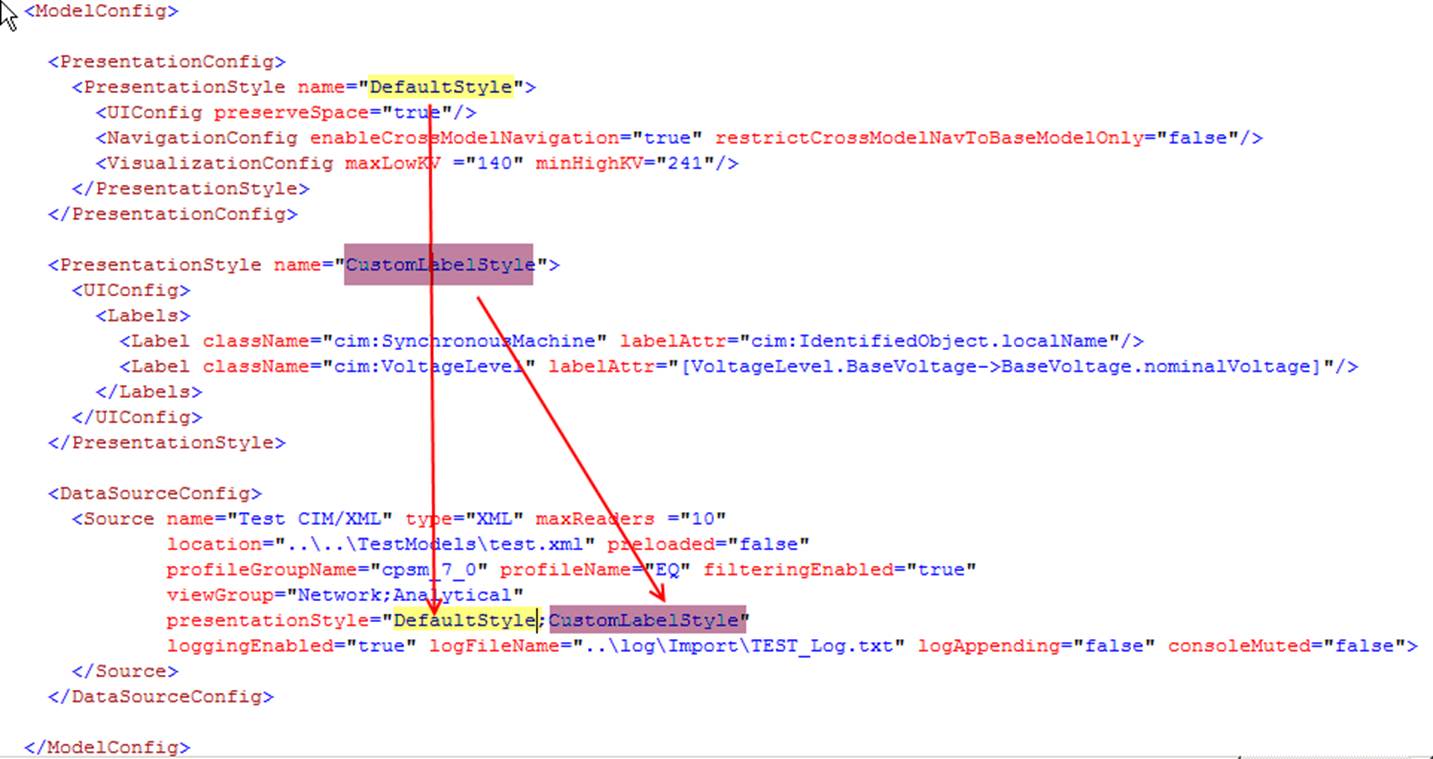
Each loaded model must be associated with at least one Presentation Style, even the modeled is not specified as a data source. The standard server configuration defines a DefaultStyle, which is applied to any of the loaded by default. These default settings, however, can be overloaded by the Presentation Style applied to a specific data source.
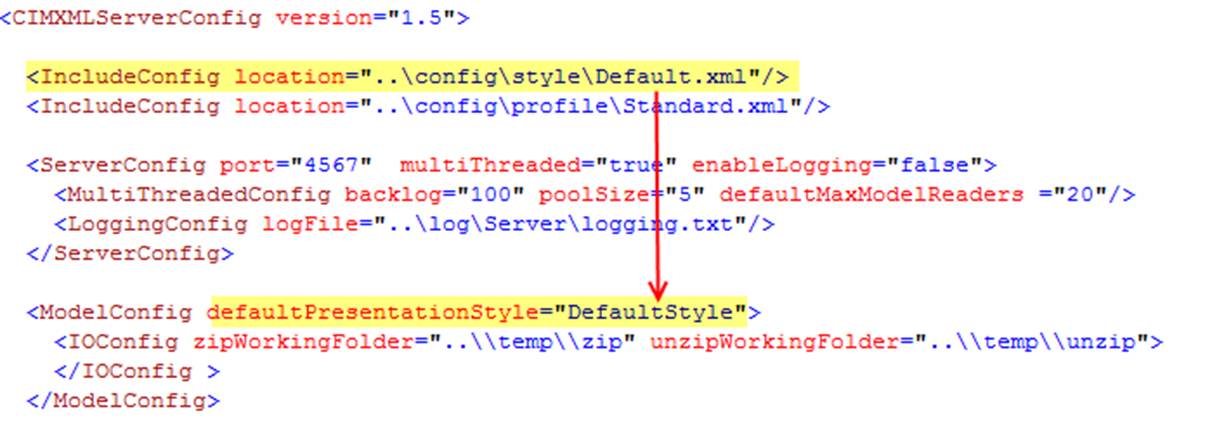
A Presentation Style contains the following optional components:
General UI Configuration
The UIConfig element in a Presentation Style defines some general UI configurations.
- The preserveSpace attribute specifies whether the property string values shall preserve the white spaces. If this attribute is set to ‘false’, any of the parsed property string vales will be processed and all of the white spaces at the two ends of the string will be removed.

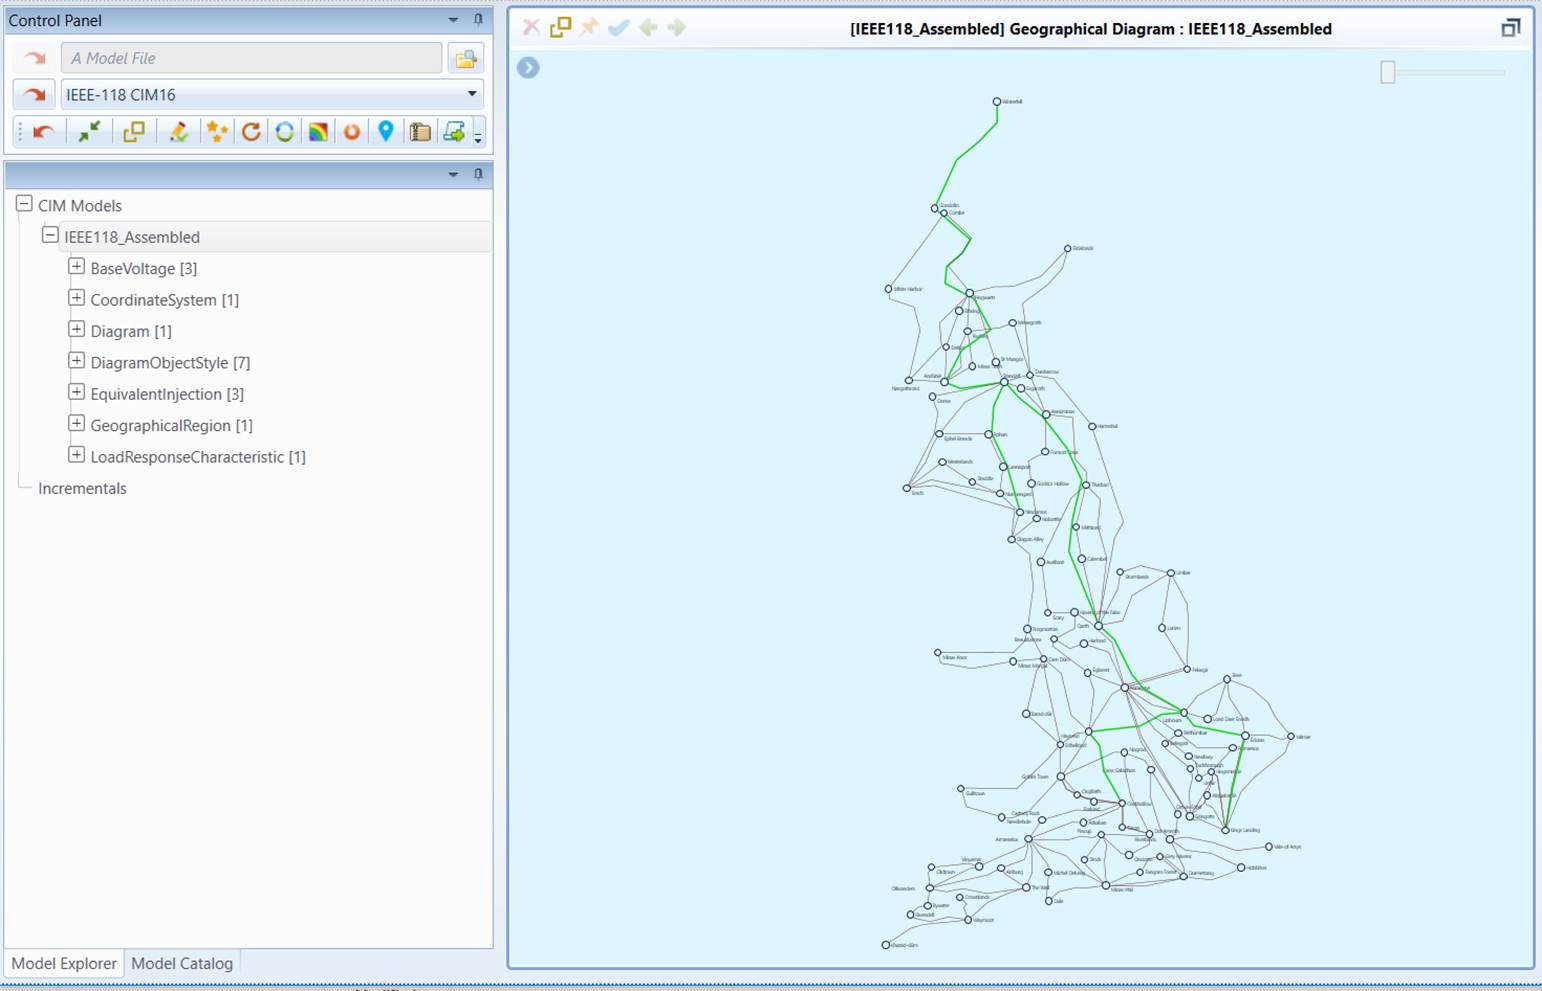
- The startPage attribute (optional) specifies the initial display to be shown after the model is loaded. By default, the model summary page is displayed and this attribute doesn’t need to be specified. The following example, however, specifies the initial page shall be a geographical diagram once the model is loaded. Currently, enumeration ‘geo’ is the only option supported.

Navigation Configuration
The Tool supports cross-model navigation which is very useful when multiple related partial models are loaded into the Tool. The cross-model navigation behavior is configurable in the governing Presentation Style. It can be completely disabled by setting the enableCrossModelNavigation attribute to ‘false’ or restricting the navigation only from the dependent model to the base model by setting the restrictCrossModelNavToBaseModelOnly attribute to ‘false’. In the latter case, the dependency between models must be specified in the Header of the model files.

Name Display Configuration
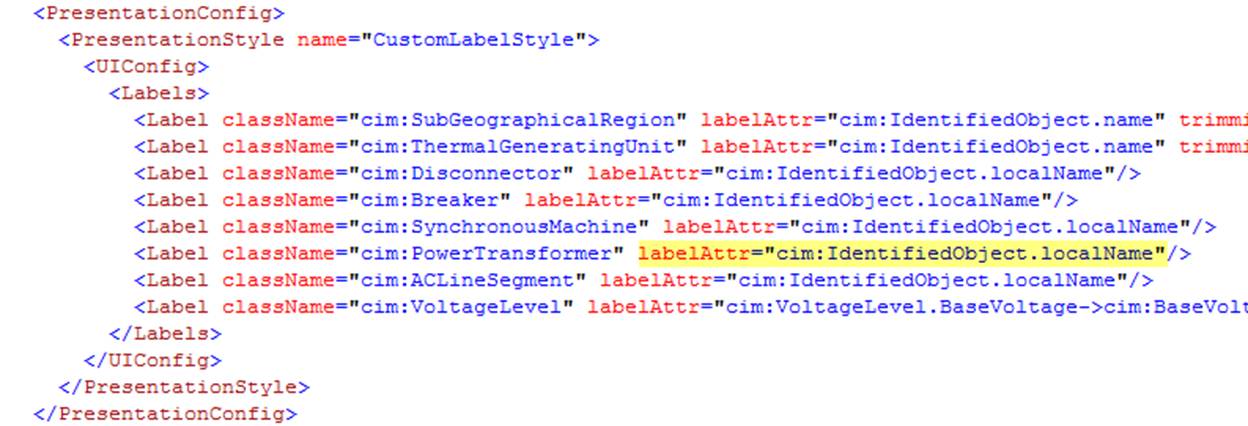
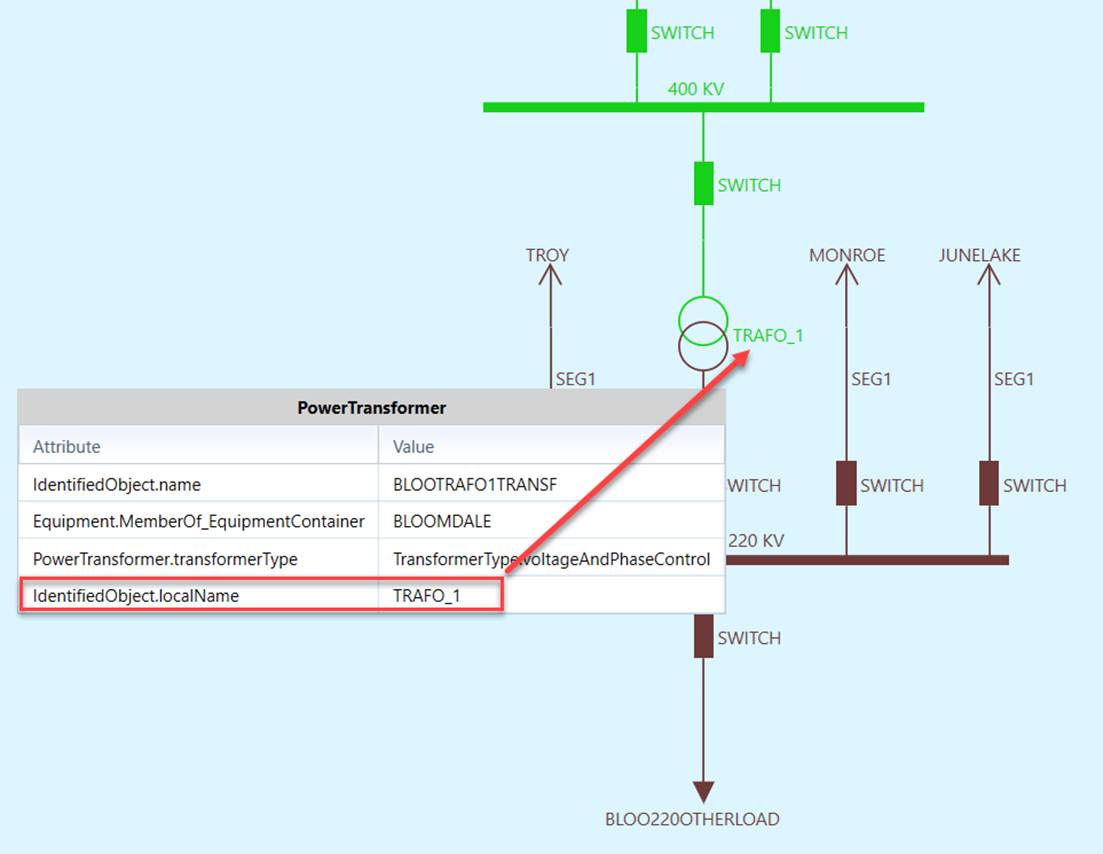
The Tool enables users to customize the name displays for a specified data source through configuration of the Presentation Style. By default, attribute Identifiedobject.name is used as label in the navigation trees and schematic/geographical displays. Users can specify other attributes as labels by adding label XML segments in the Presentation Style definition. For example, the following data source definition lists the label definition for some modeling entities. Attribute IdentifiedObject.localName is used as attribute.
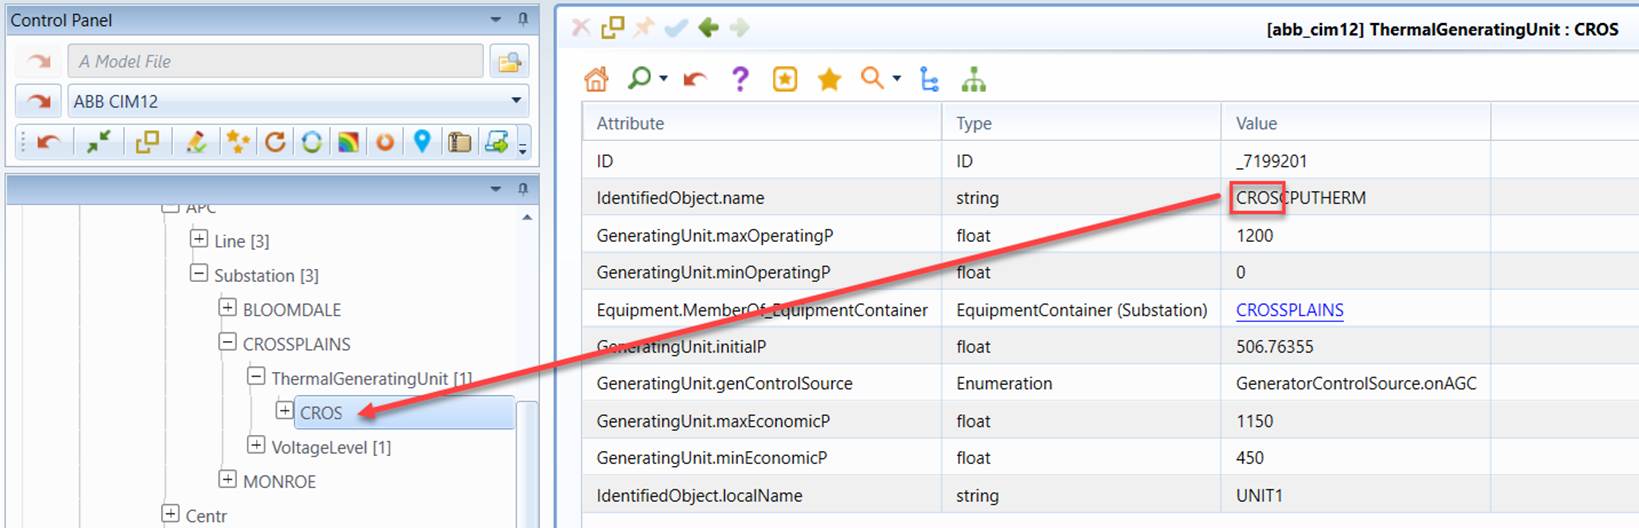
Users can also trim the specified attribute to use partial string as labels. In the following example, the first 4 characters of attribute identifiedObject.name are used as label.

The attribute used as label can also come from an associated object. Users can specify the label property as a MQL string. In this case, the optional attribute, i.e. isMQL, must be set as ‘true’. Users can also restrict the customized label to be applicable for diagram only by setting the optional attribute, forDIagramOnly, to be ‘true’. The following example specifies that Substation name will be displayed along with the name of its SubegographicalRegion. This customization is applied for diagram only.

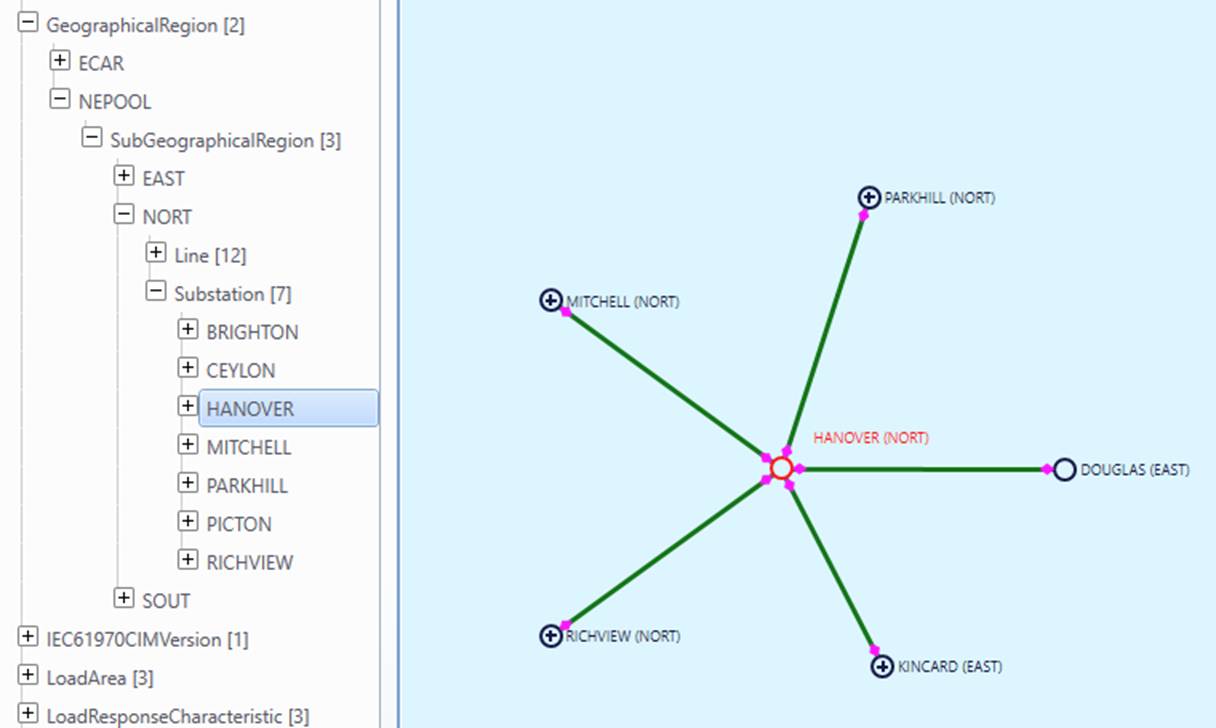
Diagram Configuration
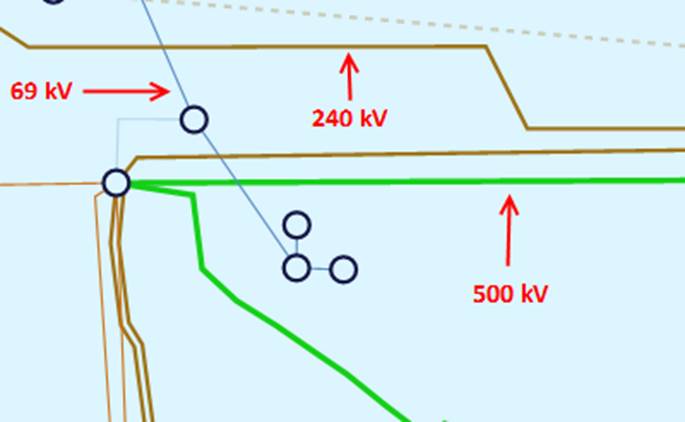
In the geographical diagrams and neighborhood diagrams, high voltage backbone transmission lines are clearly visible. They are represented as thicker lines as shown below.
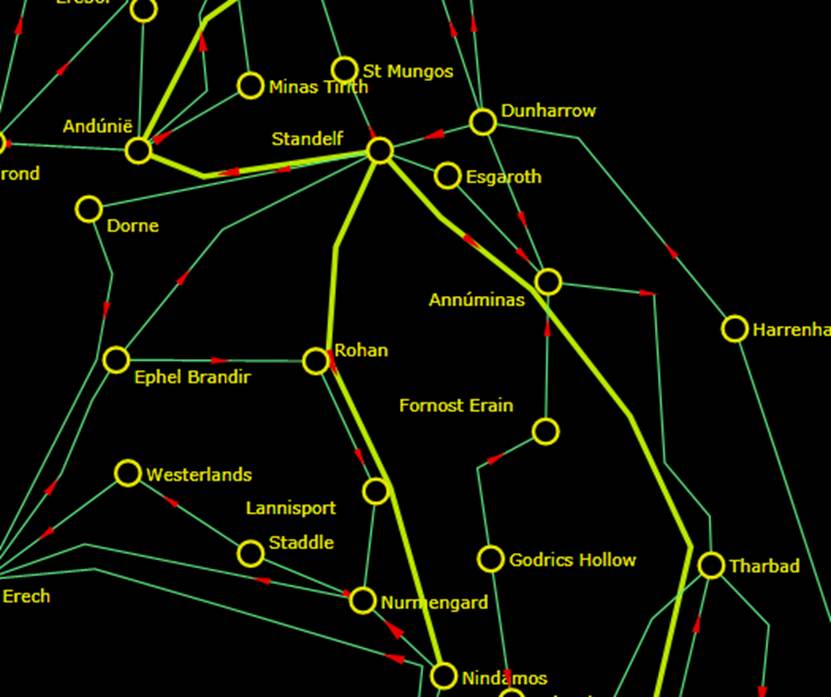
Transmission lines are classified into 3 groups: low-voltage (1 pixel), medium-voltage (2 pixels), and high-voltage (3 pixels). Users can define the kV range for each group in the Presentation Style definition, as shown below.

The 3 kV groups are defined as follows:
- Low-Voltage <= maxLowKV
- High-Voltage >= minHighKV
- Medium-Voltage > maxLowKV and Medium-Voltage < minHighKV
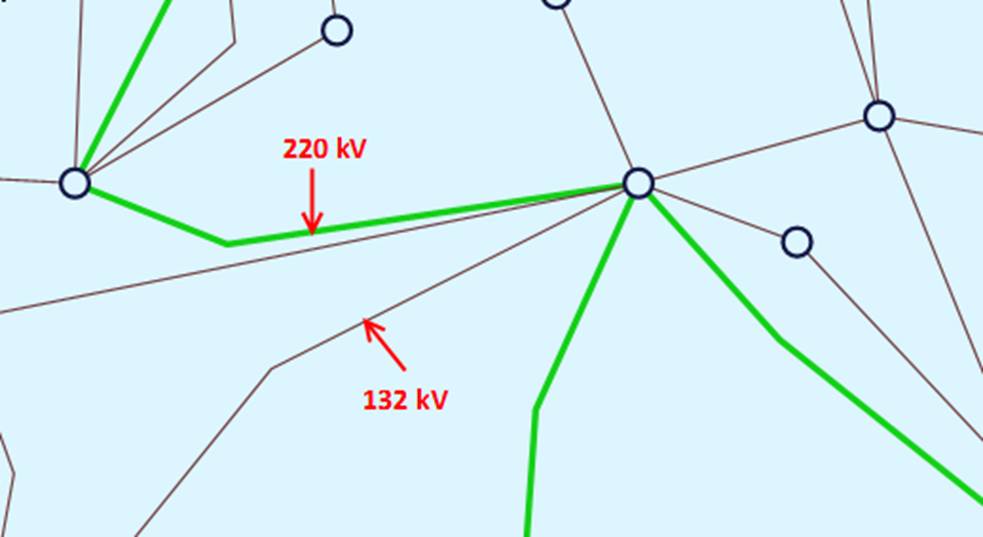
The three voltage levels are normally defiled in the default Presentation Style as shown above. Users, however, can overload the default settings by defining a special Presentation Style. The following example overload the default voltage level settings. It basically specifies any transmission line above 140 kV shall be displayed as 3-pixel thick lines.

Defining Your Own Color Code
The Tool provides two built-in color themes and, at the same time, provides users the ability to control the third custom theme. The color themes are applied to all of the models loaded into the Tool. Many utility organizations have their own color code. In order to apply a customized color code to a particular model, users must define the model-specific color code in the configuration file. The Tool enables users to customize the voltage colors for a specified data source through configuration of the Presentation Style. The following shows an example of the defined voltage color profile.
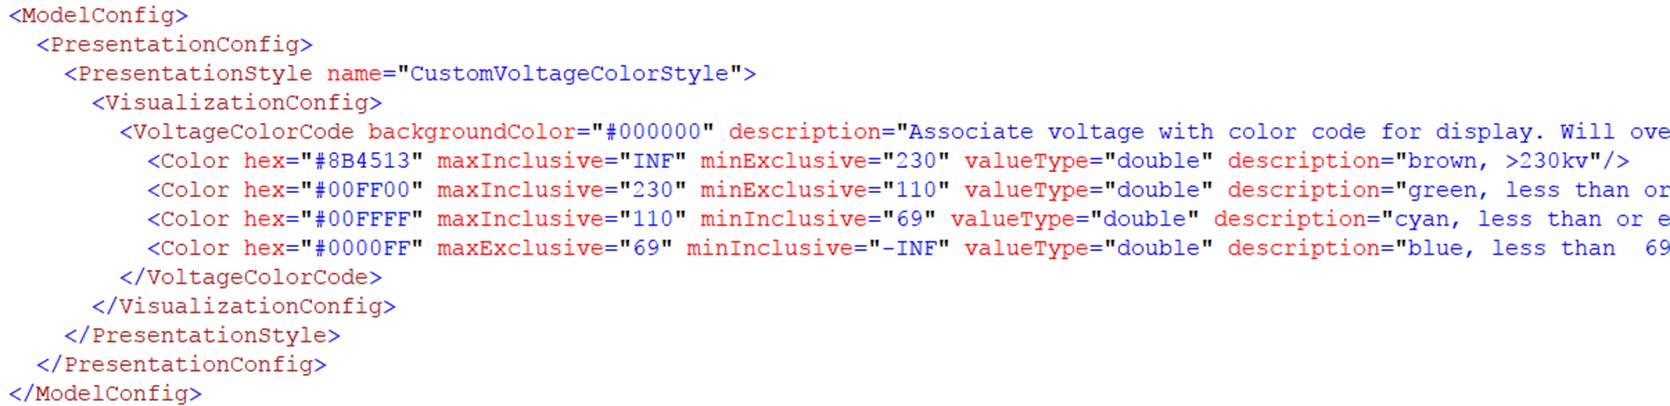
Each Color element in the defined color code represents a color for a specified range of voltage level. It consists of the following required, attributes:
- hex: Hex value of the color, i.e. a hexadecimal notation (HEX) for the combination of Red, Green, and Blue color values (RGB).
- minInclusive/minExclusive: minimum voltage in kV (inclusive or exclusive). A value of ’ –INF’ represents negative infinity.
- maxInclusive/maxExclusive: :maximum voltage in kV (inclusive or exclusive). A value of ’ INF’ represents positive infinity.
Optionally, users can also specify the background color by declaring attribute backgroundColor, as shown in the above sample.
Once a customized voltage code is defined as a Presentation Style, users can apply the defined color code to a data source, as shown in the following example.

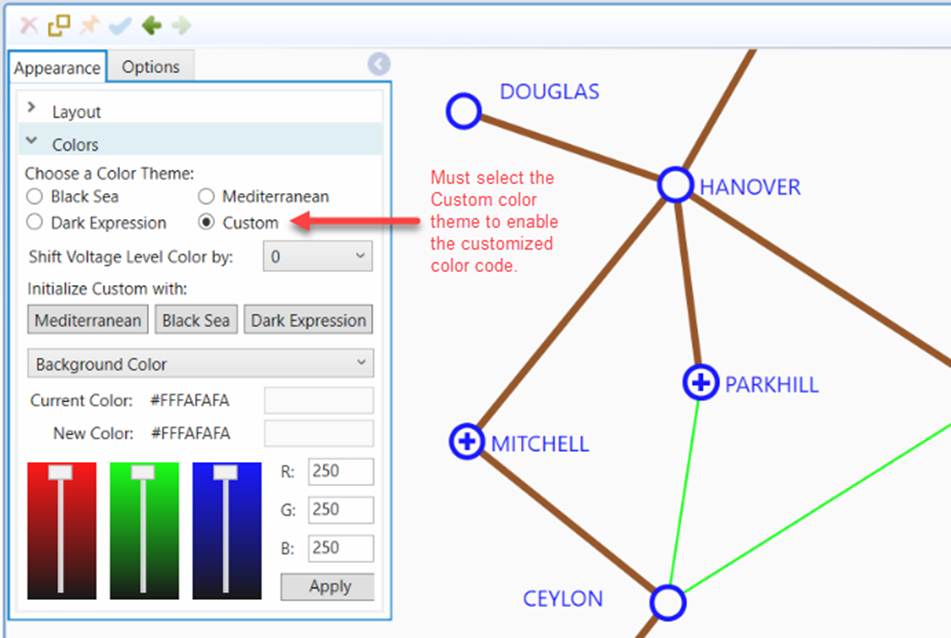
For the loaded model defined in this particular data source, the customized color code will overwrite the colors defined in the Custom color theme, including voltage color and background color, as illustrated below. It is important to note that the customized colors only apply to the Custom theme. Users muse select the Custom color theme in order to enable them. Additionally, after customized color is applied, any voltage profile shift will be ignored.
Suppressing Success Status Alert
When users perform some import/export tasks, such as exporting of a model file, the Tool will pop up an alert if the task is successfully accomplished, as illustrated below.
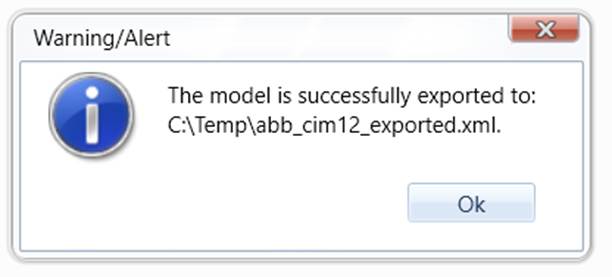
If users feel these popups are annoying, they can be suppressed by setting attribute supressSuccessAlert to ‘true’ in the server configuration in the custom configuration file, as illustrated below. This setting is a global setting, applicable to all of the loaded models. If the operations result in an error, the error message will be prompted regardless of the value of this configuration parameter.
