Visualization of Enhanced Analytical Results
CIM supports exchange of analytical results, such as those obtained from network topology analysis and power flow study, For example, analytical results from a neighboring utility or a foreign system can be used initialize the operating conditions of external system or create equivalents. However, CIM analytical models, such as those specified by Topology and State Variables, were not designed to facilitate the understanding. Instead, they were mainly designed to optimize the data exchange. For example, only raw analytical results are exchanged to minimize the volume of the data transfer. Such information is hard to understand. The Tool provides an ability to help users interpret such raw analytical information.
Visualization of Enhanced Topology Analysis Results
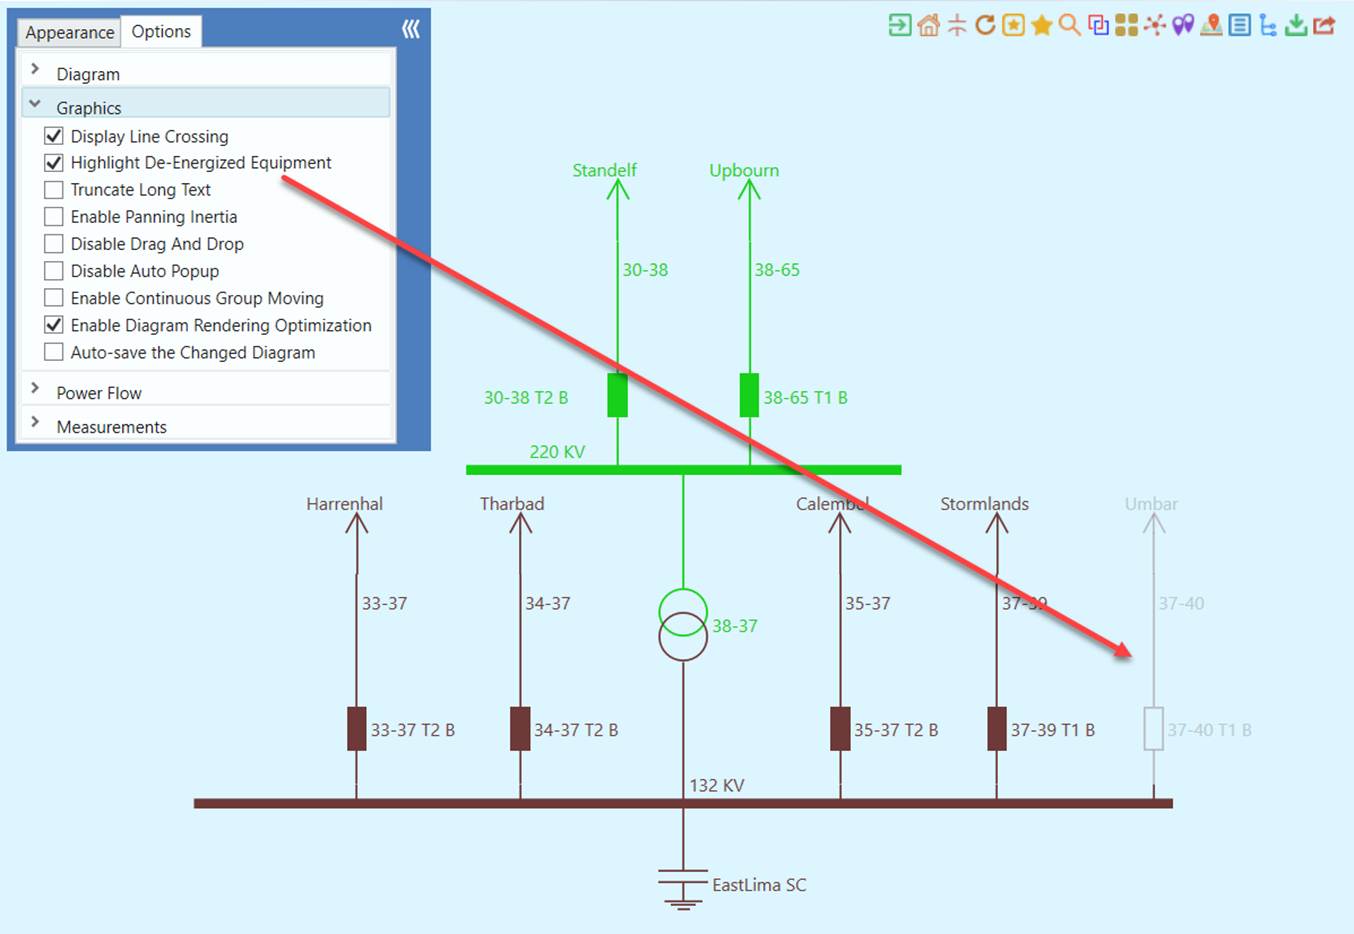
For example, the network topological connection is modeled using Attribute Terminal.connected in CIM Topology profile. It is not easy for human analysts to figure out the network topology just based on the values of this attribute. The Tool processes such raw network topological information, translates it to human-friendly interpretation like de-energized equipment or substation, and finally presents the processed information graphically to facilitate comprehension. For example, in a Substation Diagram, users must enable “Highlight De-energized Equipment” in order to grey the de-energized equipment, as illustrated below.
Visualization of Enhanced Power Flow/State Estimation Results
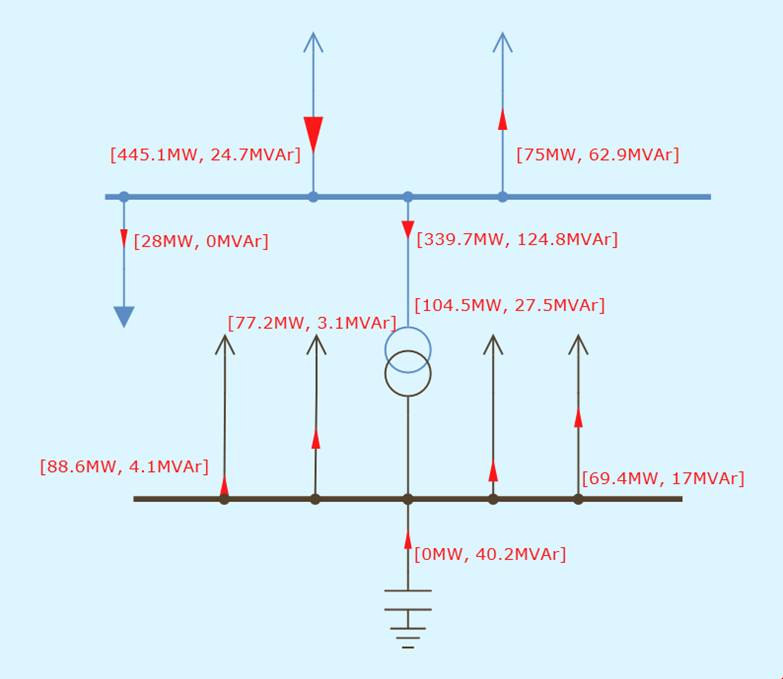
Similarly, the network simulation results, such as those obtained from power flow or state estimation, can be intuitively presented. In addition to the raw analytical results, like node voltage, the Tool also extracts more “interesting data” from the raw analytical results, such as branch MW/MVar flow, limit violations, etc. and display the process information on the generated one-line diagrams. More specifically, the following power flow results are displayed in the one-line diagram:
- Bus voltages in Substation and Equipment diagrams
- Branch MW/MVAr or Amp/Limit flow in Substation, Neighborhood, and Equipment Diagram
- Flow direction with moving dot animation in System, Substation, Neighborhood, and Equipment Diagram
- Limit violations with blinking graphical symbols and labels in Substation, Neighborhood, and Equipment Diagram
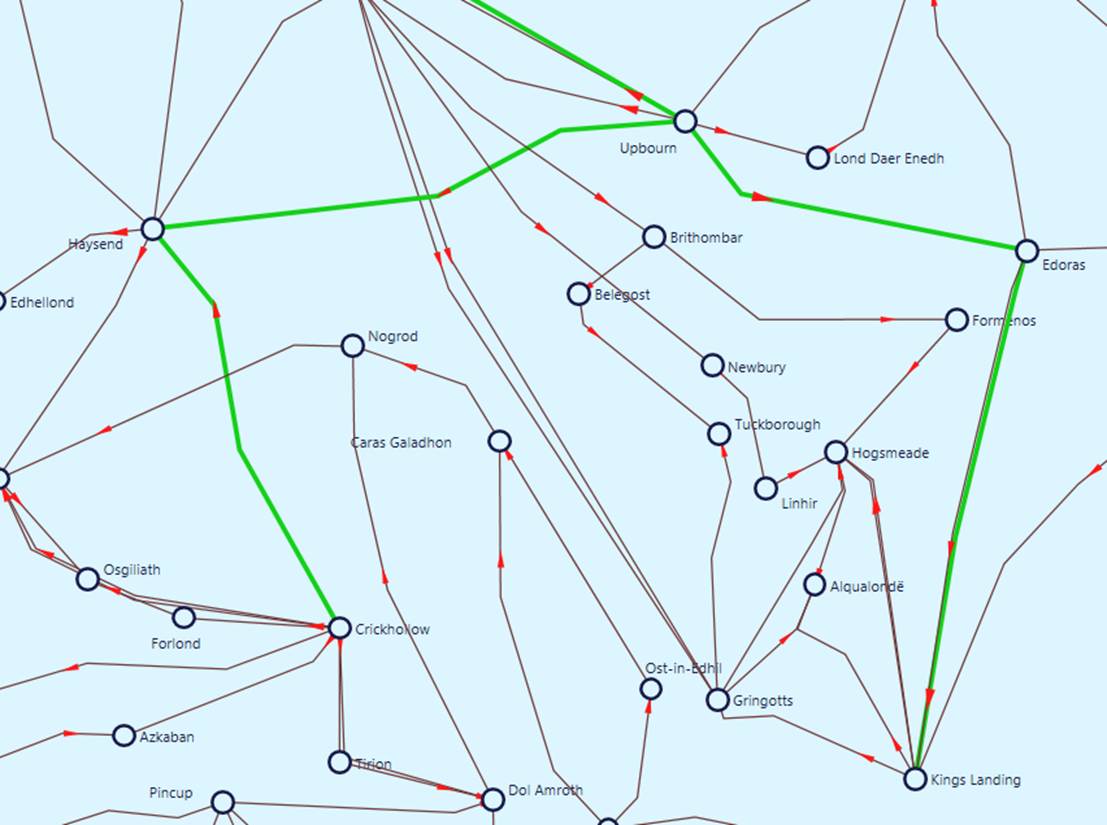
Additionally various data visualization techniques are applied to help users understand the data. For example, the size of the arrow that represents the power flow and its moving speed are determined by the apparent power of the branches. If an over-limiting condition is detected, the branch and its flow arrow will flash to alert users.
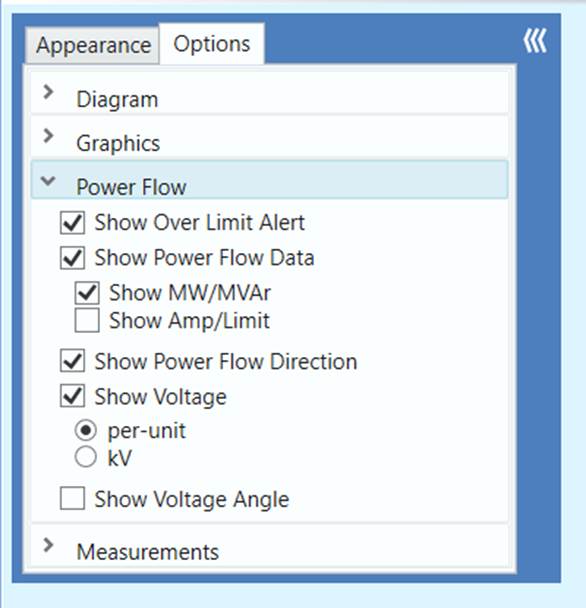
Visualization of analytical results can also be customized. This is accomplished by changing the settings in the Power Flow panel as illustrated below.
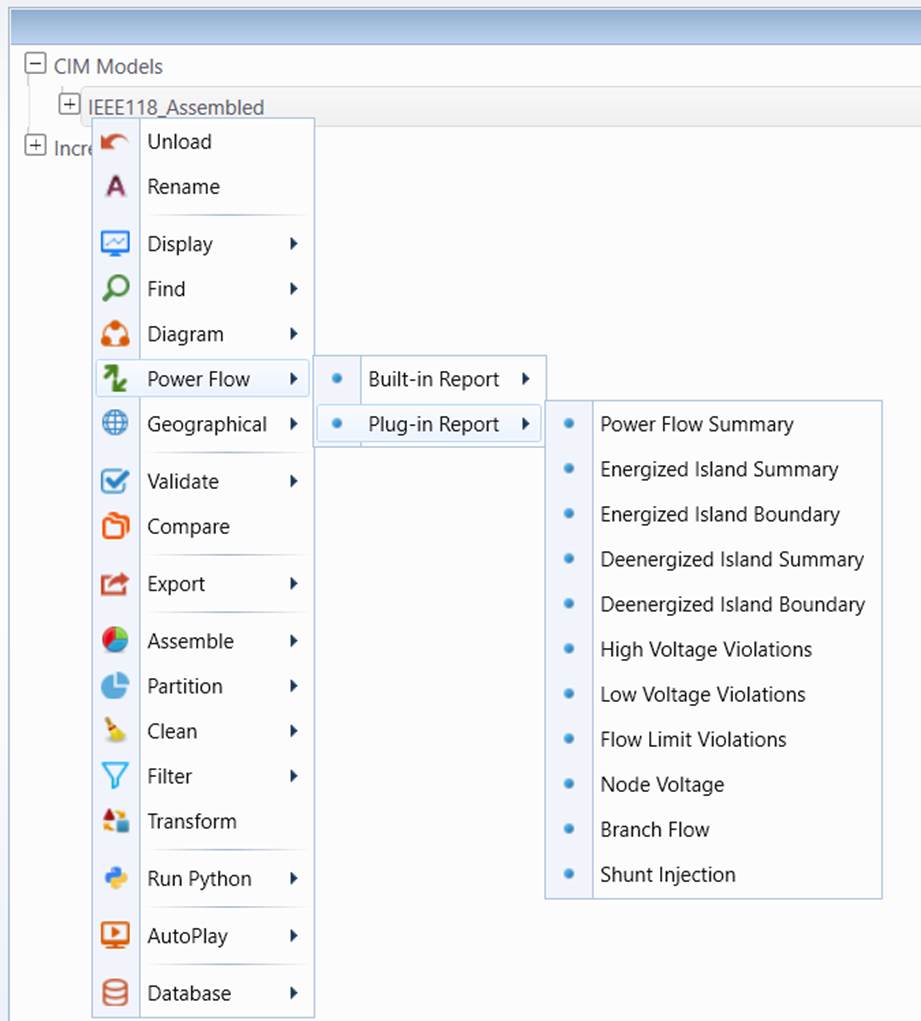
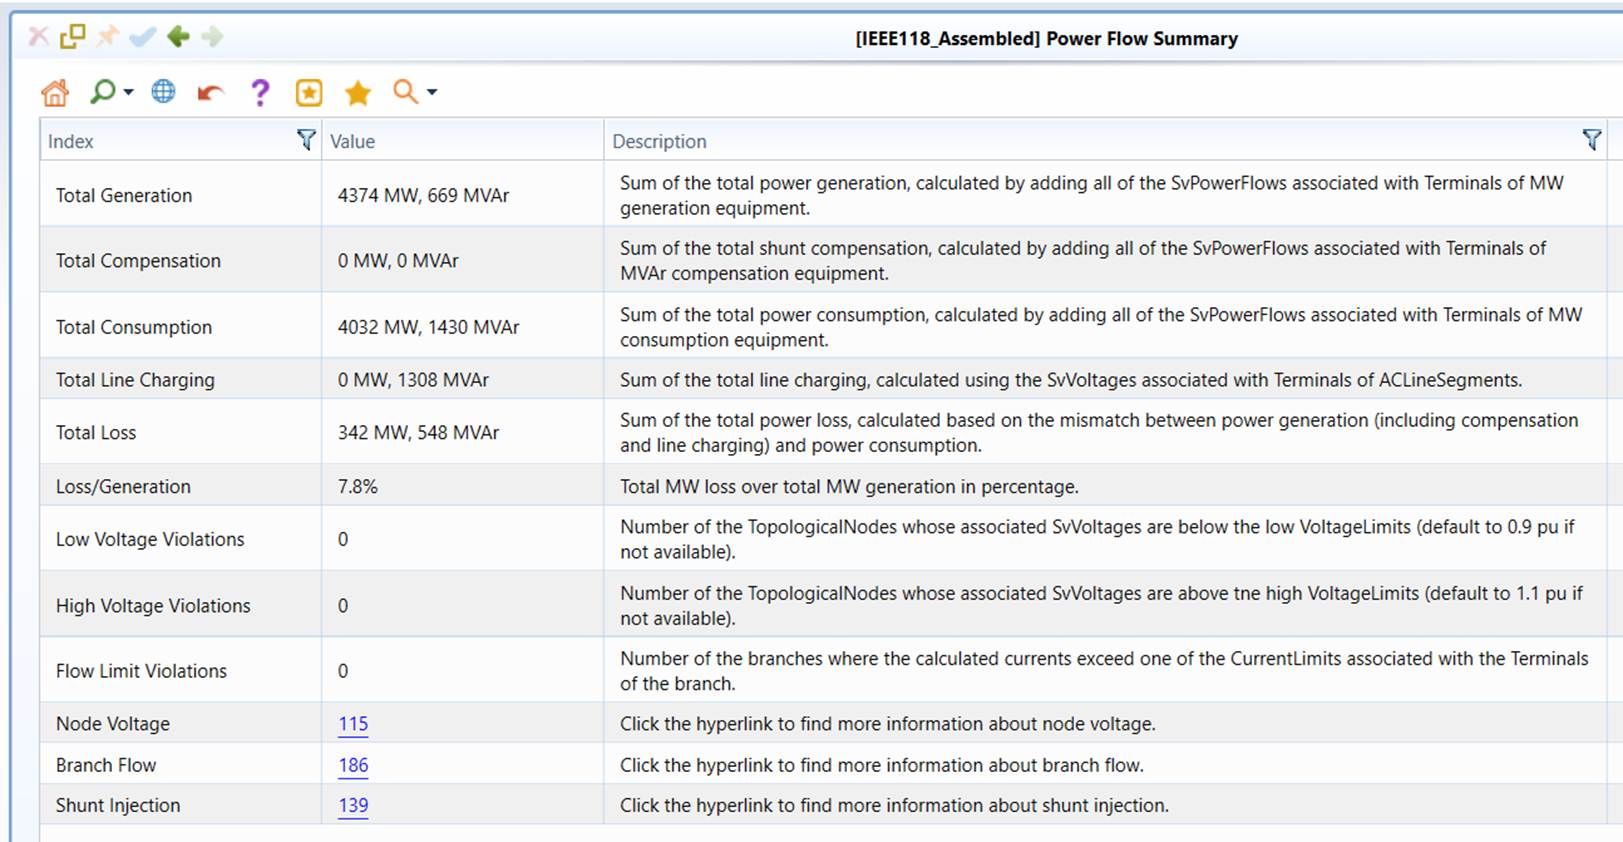
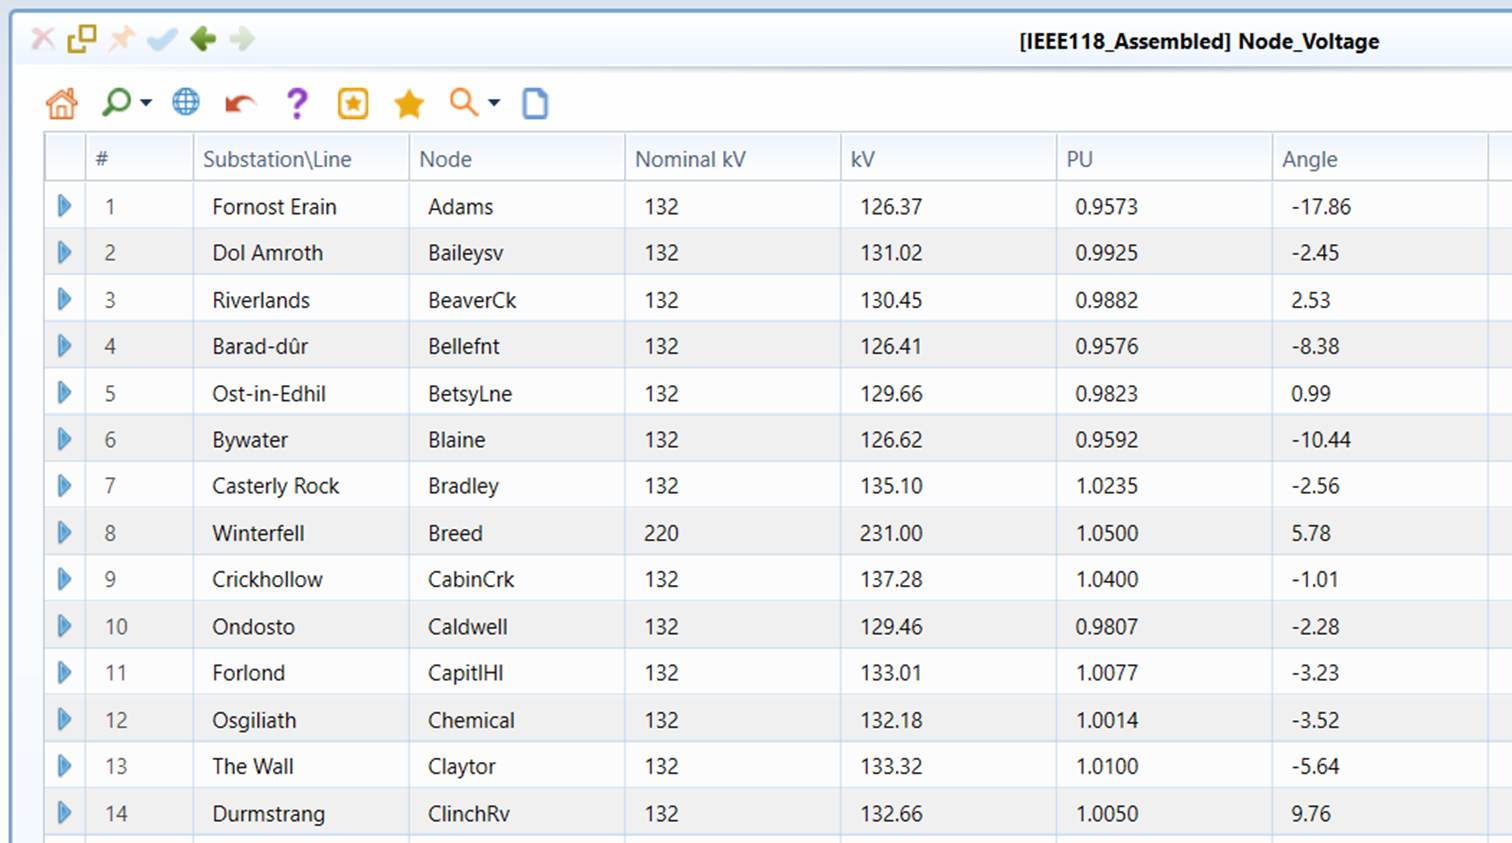
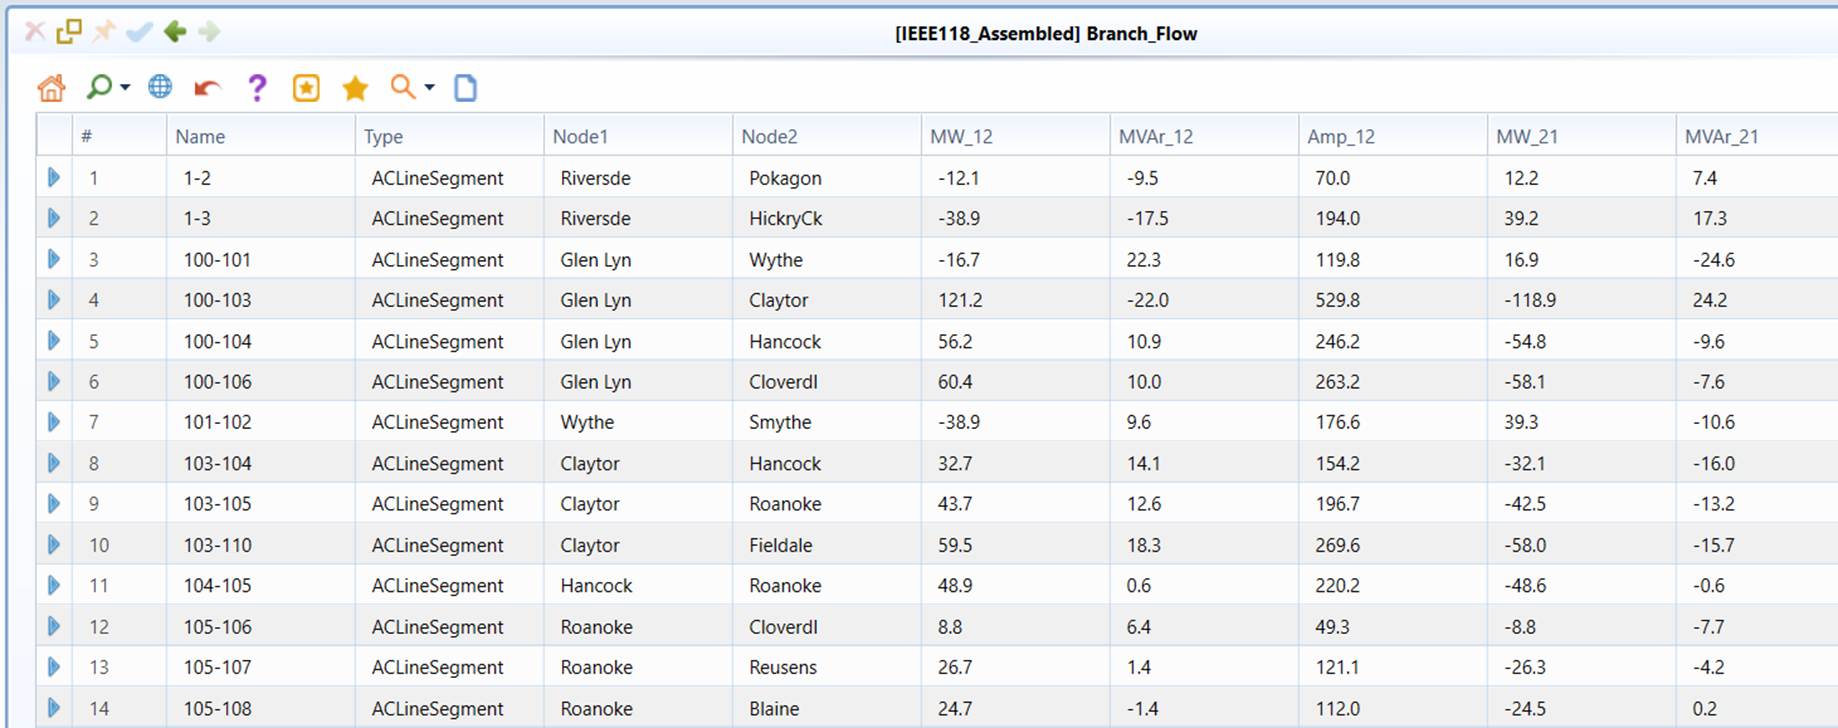
In addition to displaying the analytical results on the generated one-line diagram, the tool also generates two kinds of reports to summarize and present the extracted “business intelligence”. Built-In Reports are old reports provided by the Tool, while Plug-In Reports are custom reports specially built for power flow reporting and plugged into the Tool. The goal is to help uses enhance the situational awareness. For example, to help users monitor the power system operating conditions, the Tool provides a variety of tabular displays summarizing the power flow/state estimation results, including statistics of energy generation/consumption/loss, branch flows, bus voltages as well as shunt power injections, as shown in the following screenshots. The statistical summary display also reports the limit violation of both bus voltages and branch currents. Hyper links are provided at the summary display to call a filtered bus voltage or branch flow display that lists only those with limit violations.