Optimizing the Rendering of Large Geographical Diagrams
For large-scaleGeographical Diagrams, rendering can be time-consuming and resource-intensive, especially when handling extensive network data. As the diagram size increases, the Tool must process a higher number of elements, including substations, transmission lines, and labels, which can lead to performance bottlenecks. This challenge is particularly noticeable when zooming, panning, or making adjustments to the diagram.
To address this, optimizationtechniques including Diagram Virtualization and Level-of-Detail adjustments can be applied to enhance performance while maintaining clarity and usability. These methods ensure that only the necessary portions of the diagram are processed at any given time, significantly improving responsiveness and efficiency.
Notably, Diagram Virtualization and Level of Detailare seamlessly integrated in the Tool to optimize both performance and clarity.
Diagram Virtualization
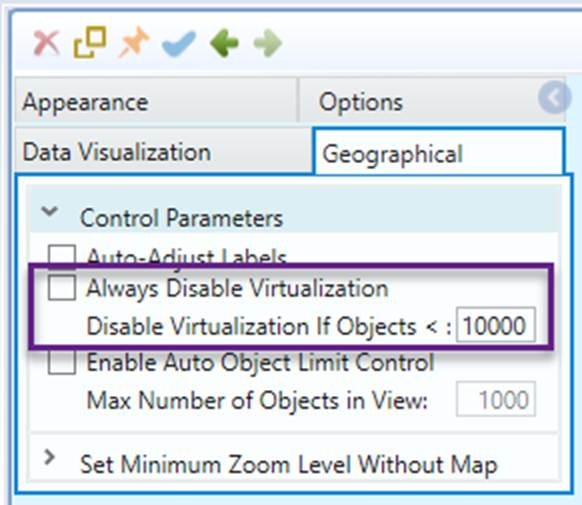
Diagram Virtualization is a technique used to enhance the performance and usability of large-scale diagrams by dynamically rendering only the visible portions of the diagram while keeping non-visible elements unloaded or simplified. This approach significantly improves responsiveness, reduces memory usage, and ensures smooth navigation, even in complex and data-heavy visualizations.
In most cases, Diagram Virtualization is disabled. However, the feature will be automatically enabled if “Always Disable Virtualization” is unchecked and the number of graphical elements in the diagram exceeds the configurable limit (10,000 by default).
Level of Details
Level of Details (LoD) refers to a technique used in diagram visualization to dynamically adjust the amount of displayed information based on the voltage levels or zoom level. This ensures that users see the most relevant details without unnecessary clutter, improving readability and performance.
More specifically, voltage levels and zoom levels are used to determine whether a graphical element should be rendered. Initially, only high-voltage grid backbones are displayed, providing a clear overview of the transmission network. As the user zooms in, additional details such as medium-voltage and low-voltage components gradually become visible. This approach ensures that diagrams remain uncluttered at higher zoom levels while providing detailed insights when needed, enhancing both readability and performance.
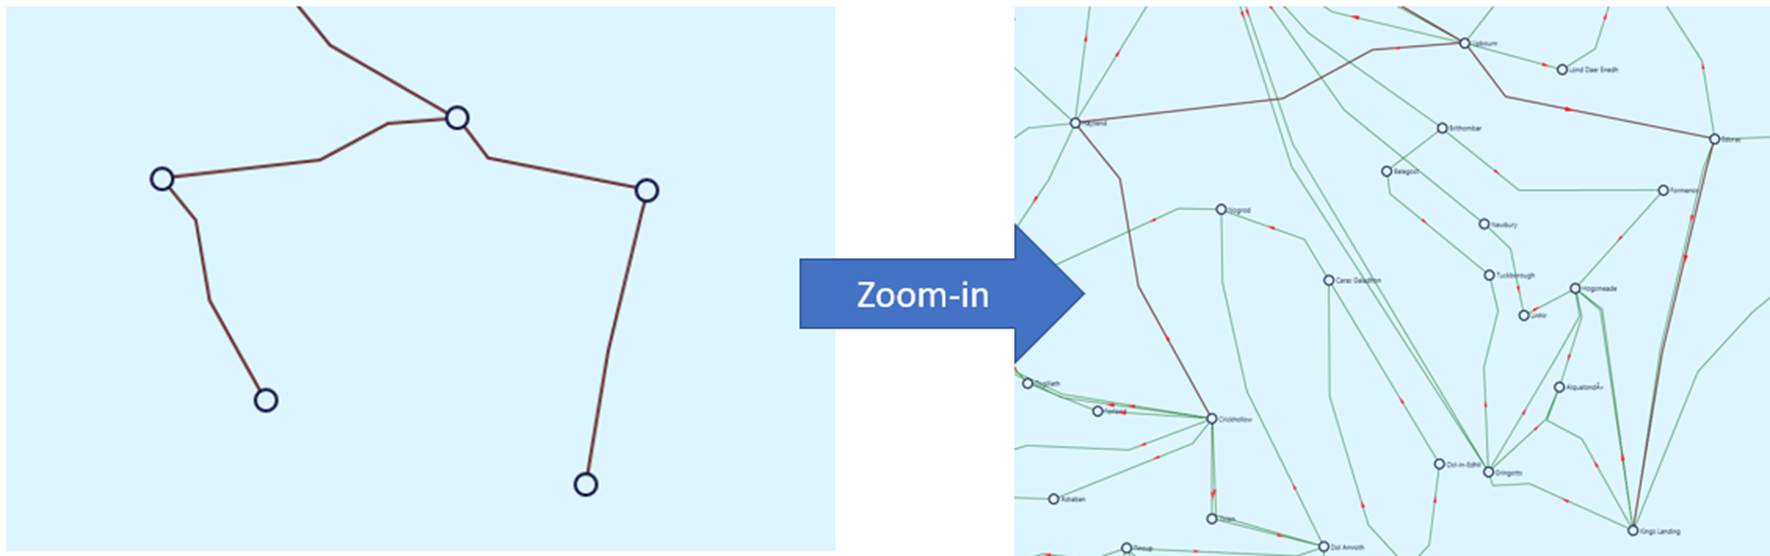
There are two modes controlling how LoD functions in the Tool:
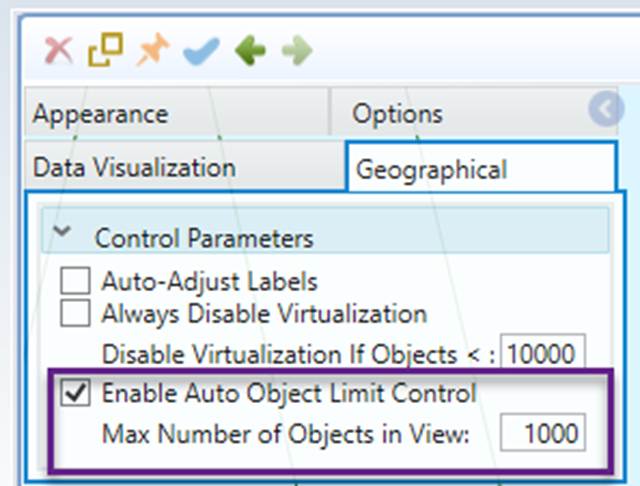
- Auto: In this mode, the tool dynamically determines which elements should be rendered at each zoom level, ensuring that the number of graphical objects in the visible view does not exceed the specified limit (1,000 by default). This mode is simple yet effective, this set as default configuration.
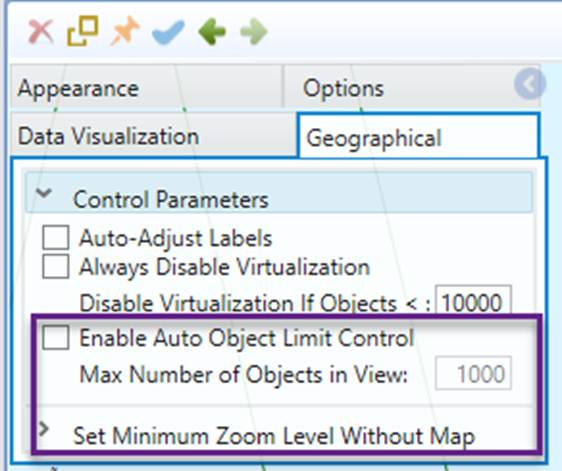
- Manual: In this mode, users customize DoL by configuring the settings. While this mode requires more effort to adjust, it allows for a consistent user experience that may be familiar to users.
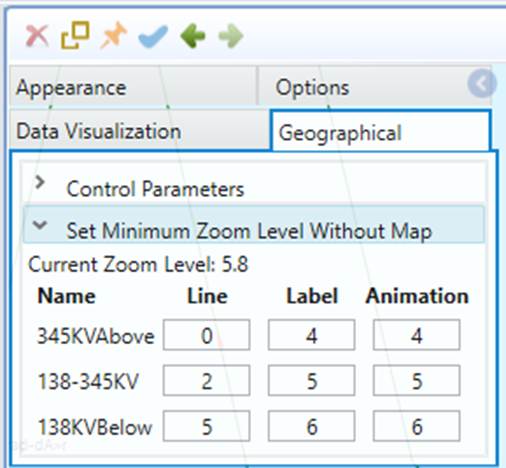
In summary, by applying Level of Details based on voltage levels, the Tool dynamically presents the most useful information for grid, ensuring a balanced view between detail and clarity.